TAPAS.network | 17 September 2025 | Commentary | Nicola Pastore
Children’s travel matters, and that’s why it must be properly measured

Moves to address the excessive level of car use to take children to school are being hampered by a lack of detailed comparative behavioural data, says . She explains why she is leading a campaign to reinstate the collection of travel data as part of the annual school census that produces returns on other pupil metrics collected and submitted by schools.
THE RECENTLY PUBLISHED 2024 National Travel Survey reported on some aspects of children’s travel to school (LTT921 4 September and [1]). The household survey showed that in 2024 51% of trips to and from school for children aged 5 to 10 were made by walking while 43% were by car and 2% by local bus. The NTS notes that before the Covid-19 pandemic (2019), the proportion of trips to and from school made by walking was at an all-time low of 46%, but that this proportion has increased in recent years.
But does this tell the full story – and if we had it, could we act more effectively to promote desirable school travel behaviour? Regrettably, in 2011 the government stopped collecting detailed data on how children travel to school. This requirement had been introduced by the government as a qualitative metric by which to measure the success of the Travelling to School Initiative (TTSI) which ran from 2003-2010 and included the development of sustainable school travel plans and travel advisors [2]. In its absence, the new NTS information confirms that the government is failing to meet its walking to school targets. If that commitment is to be taken seriously, isn’t it time for them to bring back this regular measurement?
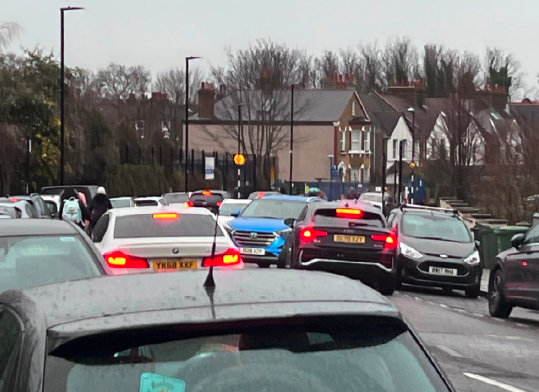
Monitoring at a South East London junction showed that the congestion generated by the
school could be linked to a 50% increase in air pollution
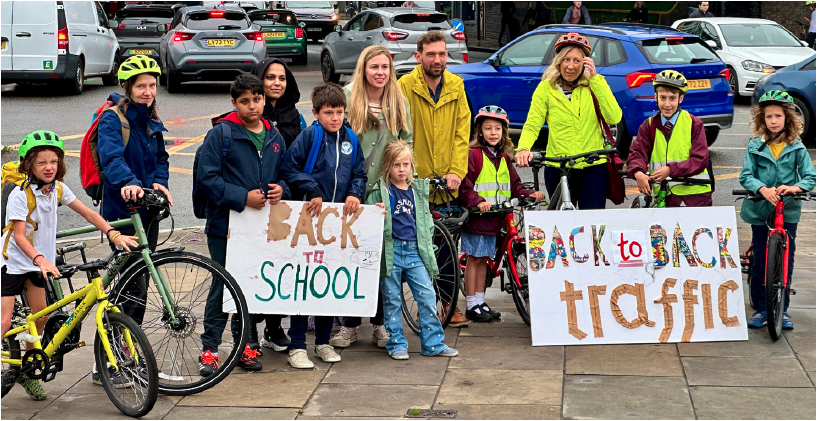
We are all affected by school run traffic. It is a safety concern, creates congestion in our local streets, delays public buses and other essential services, and is increasing air pollution.
In England 43% of primary pupils and 30% of secondary pupils [3] are driven to school, and the school run car trips generated make up over 25% [4] of morning peak time traffic. Monitoring at a South East London junction showed that the congestion generated by the school could be linked to a staggering 50% [5] increase in air pollution. And for anyone catching a bus to work, analysis from the same location showed their journey is going to take over 50% longer during term time as in the school holidays.
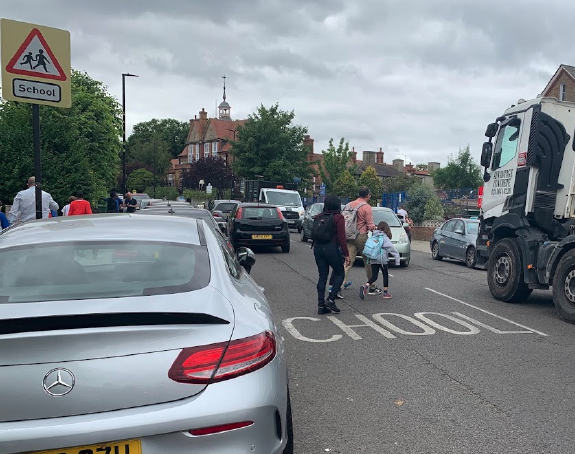
School run traffic creates congestion on local streets, delays buses and other essential services
Creating ‘fear of missing out’
National Active Travel Commissioner Chris Boardman recently said that he wanted to create “fear of missing out” when it comes to school active travel. “If we get to a point where x per cent of kids in an area have the freedom to walk or ride to school, I think we’ll see parents in neighbouring streets and communities thinking, ‘hang on, why can’t we have that’,” he said [6].
Our parent-led charity, Solve the School Run, strongly agrees. Our aim is to combine data insights with experience of real-world, parent-powered solutions. We believe parents should absolutely have the information to judge the local situation – and act. They should be outraged that their children can’t walk or cycle to school independently, or get an easily available school bus, like they can in so many other developed countries.
Instead, in England, a quick Google of “zebra crossings” and “schools” brings up pictures of parents and children up and down the country dressing up in zebra suits to demand safer crossings outside schools. These are scenes that would be almost farcical if the stakes weren’t so high. In April this year, over 40 MPs attended the “road safety and active travel to school” parliamentary debate [7] to pass on the impassioned pleas from their constituents for these essential daily journeys to be safer.
Perhaps the most telling representation came from Matt Western, MP for Warwick & Leamington, who relayed how a school in his constituency had “opened without even a direct footpath to the site, and certainly no cycleway”. Western told MPs: “Sadly, within four weeks, there was a serious accident involving a child who had to be airlifted some 60 miles.”
Public, accessible and transparent data on how children are currently getting to school, as we have seen in many other sectors where there are similar issues to address, would enable public awareness to grow and provide the scrutiny needed to hold authorities to account and drive progress.
This could follow the same lines as school league tables that showcase clear, comparative data on metrics like Ofsted reports and exam results. Parents pour over this information and are even willing to pay for enhanced access to it.
“Location” and “convenience” regularly rank as some of the most important factors for families choosing a school [8] indicating how important the journey to school is beyond the direct transport issues. Imagine if accessibility could be shown by the numbers of children walking and cycling to schools, and be compared in these league tables in the same way?
We are, however, a long way away from this being possible.
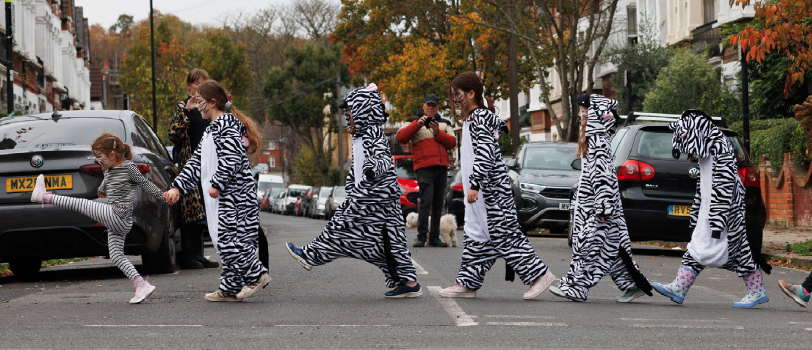
Parents and children up and down the country have been dressing up in zebra suits to demand safer crossings outside schools
Fit for purpose data
From 2008 - 2011, the Department of Education collected data on how each child travelled to school. It did this as part of the annual school census that produces returns on individual level data for various pupil characteristics, collected and submitted by schools. The child’s mode of travel to school was captured by school staff and submitted along with health metrics such as child height and weight.
However, in 2011, a decision was made to remove this requirement to capture how children travel to school. So, whilst the government continues to collect outcome health data at child level, such as obesity rates, which show us an alarming deterioration in children’s health, they have stopped measuring an important driver in improving these health outcomes – children’s active travel to school.
The travel to school data that is currently available comes from two main sources. The first is the National Travel Survey [9], which is compiled by the Department for Transport using a sample survey of parents. This is effective for understanding nationwide trends on how children are travelling to school. However, currently the sample size is too small to offer a sense of what is happening at region or city level.
Even if a larger sample boost made this possible, it would never get down to the factual position at local school level, which is needed to show the relative performance and create that “fear of missing out” factor for parents. Without the school level or neighbourhood level information, it’s also not possible to systematically evaluate how local transport schemes such as bike lanes or school streets are impacting the school run.
The second available data source is school-level information that is submitted by schools as part of Transport for London’s Travel for Life project (formerly known as STARS). This is a free accreditation programme that offers a series of free educational programmes (from ages 3 to 17) to schools and education settings across London [10].
School staff collect information on how children travel to school often via a show of hands from each class. The data is available at school level, but not by individual child. This data source is an effective way for each school to evaluate its own progress on reducing school run driving, and the collective data set is useful in evaluating the overall progress of schools engaged in these schemes. This data is also shared with local authorities that can feed it into their school active travel programmes.
Beyond the TfL approach, the Modeshift STARS accreditation scheme has also been adopted in some school settings. It provides a simple five-step process that empowers organisations anywhere in the country to enhance everyday journeys through their Travel Plans by creating, delivering, and tracking the effectiveness of them whilst working towards national accreditation. This is helping spread best practice, in enhancing opportunities to walk, wheel, ride, and use public transport for everyday journeys.
However, as a means to generate public, accessible, comparatives both these methods are limited. The Travel for Life and Modeshift Stars data is only available for a certain percentage of schools, so there are significant data gaps. The schools that do opt into these programmes and collect their mode of travel data are likely to be those inherently more engaged with active travel, which means their travel results may contain bias. And, lastly, inconsistent methods are used to collect the data. Schools often complete their travel surveys at different times of the year and at different frequencies, making comparatives difficult.
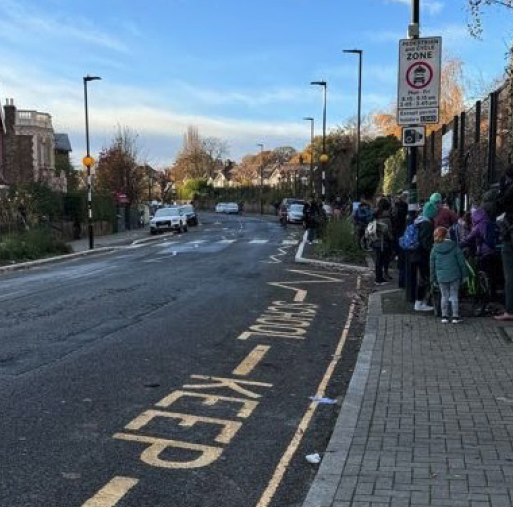
ANPR cameras have been key to reducing road danger outside schools
A game-changer for active travel
Against this background ,comprehensive child-level measurement of travel to school could across the country could be a game-changer for active travel on the school run.
Child level data on school travel, collected systematically from every school as part of the school census could provide a public, integrated view on how far children are travelling and what mode they are using. This would enable comparatives for every school, ward, city and region in England.
An example of what this could look like can be seen in our London primary school travel dashboard [11]. The dashboards provide a view of how pupils are journeying to their London primary school. You can investigate and compare schools, to understand how many pupils are walking and cycling and how far they are travelling. You can also compare London wards and boroughs to each other, to see which areas are doing well for primary children travelling sustainably and which areas have high rates of school run driving (and no doubt high levels of morning traffic congestion as a result).
The data within these dashboards relies on actual school catchment data but modelled mode of transport data, precisely because no comprehensive actual data exists. But the completeness of the dataset, the availability of the comparatives and the capability to look at the issues and key metrics in a connected way from a Cross-London view, right down to a borough, ward or individual school hopefully provides a sense of the possible. The work was funded by the Foundation of Integrated Transport and draws on data expertise from the Propensity to Cycle tool.
This type of actual data availability would mean that the public are informed and could hold local authorities to account on progress in their areas. We could learn from success; children’s travel independence is a gift to parents, and this data could put a spotlight on the areas doing well and create a race to the top. Local authorities and national government could meanwhile use the data to make evidence-based decisions about where to direct resources to achieve desired change, and researchers could conduct high quality systemic evaluations of new policies and solutions such as school streets, low traffic neighbourhoods, cycle lanes and cargo bikes.
To create FOMO we also need to make the data public and digestible. Accessibility and digestibility is just as important as the data being collected in the first place. Ultimately, even if you have the most detailed, reliable dataset, it is of limited value if it is buried in the depths of impenetrable files. We need children’s travel to school to be public, prominent, and easily available information for parents and school travel stakeholders. It should be viewable on individual school websites, council websites and in school and health league tables, so families can see what they’re missing out on and drive change.
Public monitoring and tracking of air pollution outside schools has increased public awareness
‘You can’t manage what you can’t measure’
Just as we have seen how public monitoring and tracking of air pollution has greatly increased public awareness and concern over the issue, so we should be applying the same approach to the school run.
Currently we don’t have the granularity of data and public accessibility to understand which neighbourhoods, towns or regions in England are doing well, where is being left behind, and what policies and solutions are having a successful impact. As the old adage goes, “you can’t manage what you can’t measure”. Children’s travel matters, and it deserves to be measured well.
To join the campaign to reinstate the collection of children’s travel to school data in the school census email: hello@solvetheschoolrun.org.
References and Links:
-
https://www.livingstreets.org.uk/press-media/government-failing-to-meet-walk-to-school-target/
-
https://assets.publishing.service.gov.uk/media/5a7cd15aed915d63cc65d036/TTSI_Final_Report.pdf
-
https://www.gov.uk/government/statistics/national-travel-survey-2024/nts-2024-travel-to-and-from-school
-
https://www.london.gov.uk/who-we-are/what-london-assembly-does/questions-mayor/find-an-answer/car-journeys-during-school-drop-offs
-
https://www.theguardian.com/education/2025/jan/14/private-school-run-in-south-london-linked-to-27-per-cent-rise-in-air-pollution
-
https://www.transportxtra.com/publications/parking-review/news/78663/national-active-travel-network-launched-at-active-city-york
-
https://hansard.parliament.uk/commons/2025-04-22/debates/97145CA1-ED45-4751-8EF4-6FD128715076/RoadSafetyAndActiveTravelToSchool
-
https://www.schoolguide.co.uk/blog/location-is-number-1-factor-for-choosing-a-school
-
https://www.gov.uk/government/statistics/national-travel-survey-2024/nts-2024-travel-to-and-from-school
-
https://travelforlife.tfl.gov.uk/
-
https://www.solvetheschoolrun.org/schooltraveldata
Nicola Pastore is co-founder of Solve the School Run, a charity devoted to enabling families to have safe, green and convenient school runs. She was previously a Principal Consultant at financial analytics platform Metapraxis.
This article was first published in LTT magazine, LTT922, 17 September 2025.
You are currently viewing this page as TAPAS Taster user.
To read and make comments on this article you need to register for free as TAPAS Select user and log in.
Log in