TAPAS.network | 6 February 2024 | Commentary | Phil Goodwin
Decision time for England’s biggest road project. What are the implications? (Part One)

The recently completed examination of the revised National Highways proposals for a new downstream crossing of the Thames between Kent and Essex exposed some fundamental issues about how the rationale behind its justification was both presented and tested, believes . These are matters of more general significance, he feels, and here he provides an analysis of the case presented, and the wider questions it highlights about major road scheme appraisal and the robustness of the review process, in the first of a two parts TAPAS contribution on the Lower Thames Crossing, and the issues it raises
AMONGST CONTINUING DISCUSSION about the place of new road investment in a sustainable transport policy for the UK, a small number of major schemes have become high profile case studies of the key issues
Back in October 2022 I published an article in LTT and on TAPAS about one of these, the imminent Public Examination into the proposed £10bn Lower Thames Crossing, a new tunnel under the Thames, with extensive associated road construction, intended to provide long-term relief to traffic congestion at the Dartford M25 Crossing.
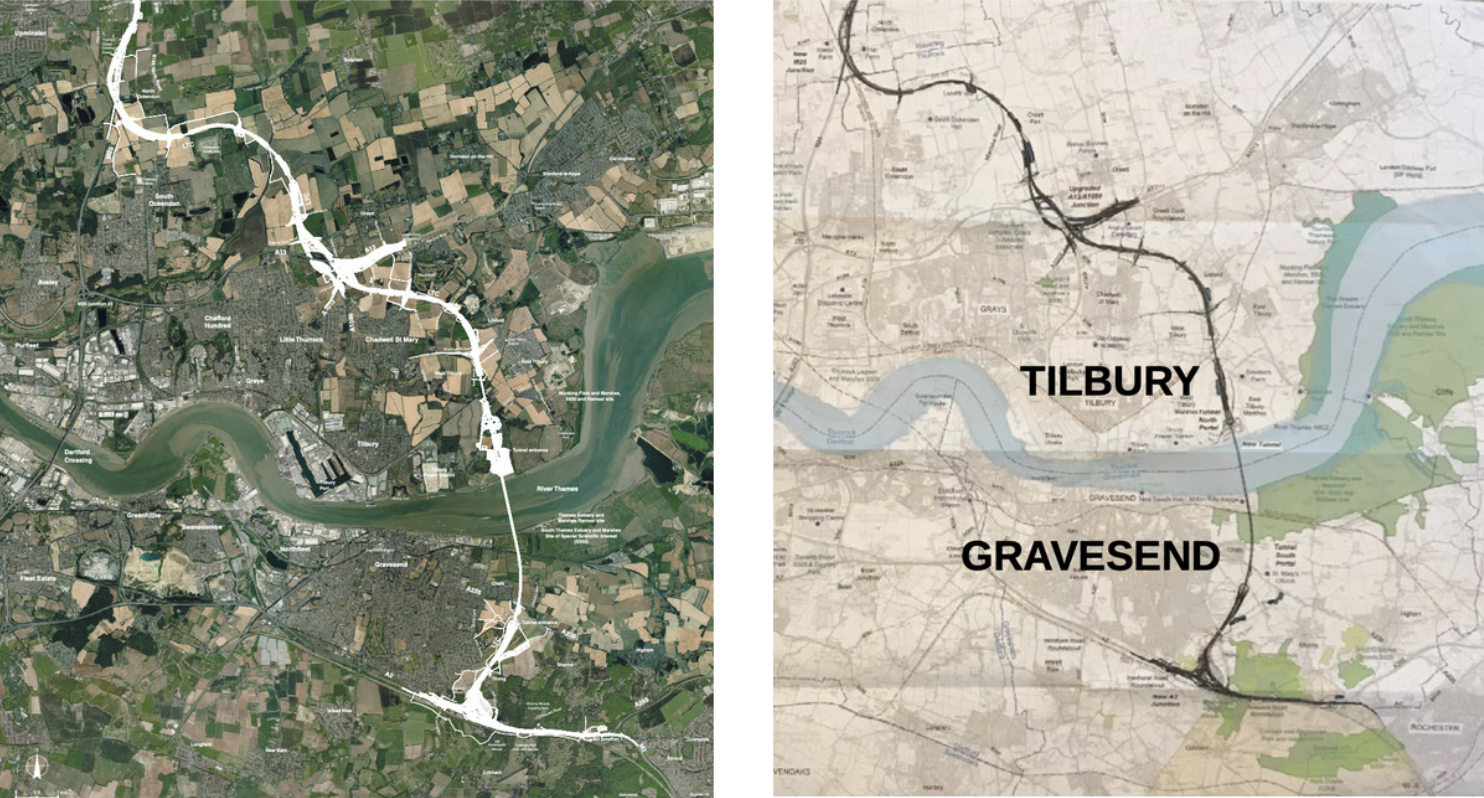
The Lower Thames Crossing in its geographic context. The National Highways satellite image issued for consultation, and a map equivalent (right) both showing the proposed position of the road.
I wrote ‘I am expecting that there will be a strong and critical challenge to the scheme at any forthcoming Examination’.
Well, the Examination has since happened, in the second half of last year, under a new Development Consent Order submission obligation that the Examination must be completed within six months
The Examination website lists 3640 documents submitted to the examination – the most in any scheme ever, I think. Of these, 2423 were by National Highways, the Promoter. Some of them are very long, with multiple Appendices and Annexes, highly technical, and with very many detailed tables, maps, and figures. Interested Parties had to respond to these at 12 very short deadlines, and most of the discussion, argument, questions and answers were conducted by comments, rejoinders, further comments and further rejoinders. This was done by exchanges on paper in a tightly specified format, often with a deadline of 2 or 3 weeks for the consideration of several hundred documents. Towards the end it meant dozens of documents in a few days. There were no cross-examinations, and verbal presentations only occurred on a few selected topics.
This accelerated effort had been intended to answer a perception that ‘it takes too long to take decisions’, with an expectation that a brisk, efficient process would reduce the likelihood of subsequent legal challenge or other delays.
I had the privilege of working on this project, in an advisory role to one of the local authorities most affected by the project, and as an ‘interested party’ in my own right. This enabled me to pay close attention to contributions by other local authorities, a residents’ campaign group, two ports, a number of other interested parties, and above all the detailed technical documents submitted by National Highways.
By the end of the examination period, just before Christmas, my conclusion was that the process and its content were not fit for purpose. This of course is my own personal and professional view, not representing any of the organisations or individuals involved. Nothing in this article should be regarded as a statement on behalf of any of the interested parties except where I explicitly quote their submissions.
I should make a caveat that I did not review all the documents. Indeed, it is certain that nobody could have read all the documents, in any real sense of the word ‘read’. Moreover, I did not meet anyone who felt genuinely satisfied with the process, but I met many who were so exhausted by it that there was nothing but relief when it finished-albeit with much concern about what happens next, because the quantity and size of documents is not the point, if the quality and relevance is inadequate, or if key information is not included.
Did the LTC examination add new clarity to the role of the road programme?
As you would expect, of such a major scheme, there was mention of all the big issues that challenge the design and planning of the road programme as a whole – climate change, carbon, the future of mobility, congestion, the effect of Covid and Brexit, issues of equity between different parts of the country and different social and geographical groups. But there was little place for these matters in the proceedings, and anyway much of the process of it was assertive, brief and uninquisitive. In one sense this is a Flagship scheme, but there were no new visions or understandings being tried out, to befit that status. It seemed, in fact, as though this was just another scheme rolling off the production line. But there were, in fact, struggling to be seen through the mass of paper, some key unresolved questions.
I see these being, in particular :
(a) how can it be that a scheme which performs so badly by the long-established metrics of costs and benefits, could have commanded such a high place in the battle for funding?
(b) How can it be that the programme of analysis has failed to follow key Department for Transport appraisal guidance, or recognise significant DfT published research results, on key issues?
(c) Do we need to rethink the arrangement whereby traffic and appraisal models, developed with public funds, are used as private tools owned by the scheme promoter, choosing which results they will publish and which they can refuse, rather than public property to be used and tested by all interested parties technically competent to do so?
In this Part One of a two part article the Editor has kindly provided me with the space to write, I want to focus on two main issues – the treatment of the overall value for money of the scheme, because I believe it fails to comply with the Department for Transport’s improved advice on the treatment of Uncertainty; and the demand modelling of Goods Vehicles, because it fails to reflect the DfT’s published research results on that subject.
The downward trend of net benefits from the LTC
Table 1 The downward trend of estimated net benefits
Successive outline appraisals of the Lower Thames Crossing by the Promoters
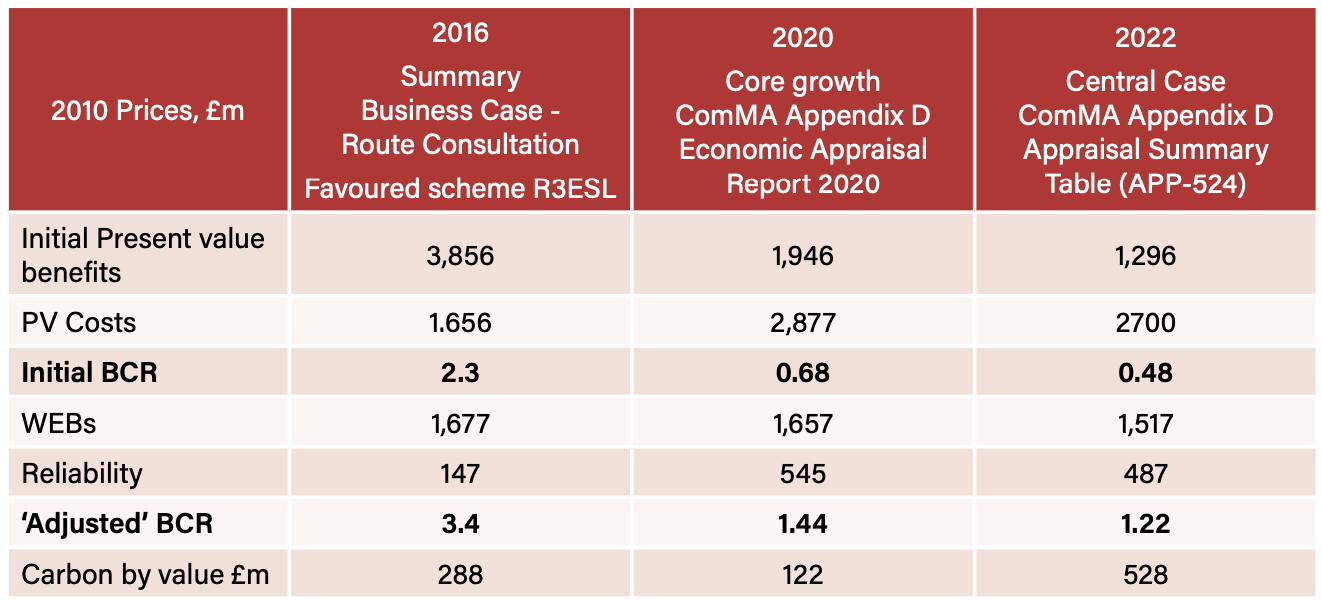
There has been a long history of lobbying for crossings in this area, and in 2016 the first detailed comparison of a number of different designs, of which the favoured one claimed conventional benefits (mainly value of forecast time savings) which were reported as more than twice as high as the costs. The less established calculation of ‘wider economic benefits’ added half again to the benefits, with a further bonus of suggested improvements in reliability. Altogether, estimated benefits at over three times the cost seemed to promise a serious net benefit and good value for money.
Then it all started going downhill. By 2020 the most recent revised travel time and related benefits only covered two thirds of the cost, and even after adding the less well established wider economic effects and reliability benefits, the overall value for money was still classed ‘low’. And by 2022, at the opening of the Examination, National Highways reported that the travel time and related benefits covered less than half of the cost, and the project was completely dependent on the more doubtful benefits (which I shall examine in Part Two of this article to struggle up to an even lower BCR of 1.22 – and still, as will appear, on a potentially downward trajectory.
The role of DfT’s ‘Uncertainty Toolkit’
The DfT had been steadily moving away from the idea of a single preferred or ‘most probable’ future in the national traffic forecasts in 2015 and 2018, implemented in the renamed National Road Traffic ‘Projections’ in 2022, and continuing to be clarified in 2022 and 2023. The current position is outlined in the DfT’s ‘Uncertainty Toolkit’, and its use of a set of distinct, specifically defined, Common Analytical Scenarios (CAS) as the recommended common framework for appraisal. The central principles start from a recognition of the inherent uncertainty involved in all the forecasts:
‘There is considerable uncertainty about how the transport system will evolve in the future, particularly with the potential for emerging trends in behaviour, technology and decarbonisation to drive significant change over time. The use of transport models, a fundamental aspect of scheme appraisal, can also introduce uncertainty to transport analysis, through the data, assumptions and model specifications required. To ensure decision-making is resilient to future uncertainty, decision makers need to understand how the outcomes of spending and policy proposals may differ under varying assumptions about the future.’
Therefore analysis should not focus exclusively on a core scenario, and uncertainty should be considered holistically across the strategic and economic cases and ‘throughout the planning process.’
The starting point for this recognition had been, more simply, to consider different scenarios for high and low traffic growth (this is only one of many dimensions of uncertainty, but it is an important one). Table 2 below shows National Highways’ analysis of three different traffic growth calculations, tabled at the beginning of the DCO application.
Table 2 BCRs for Low, Core, and High Traffic Growth (£m, 2010 prices and values)
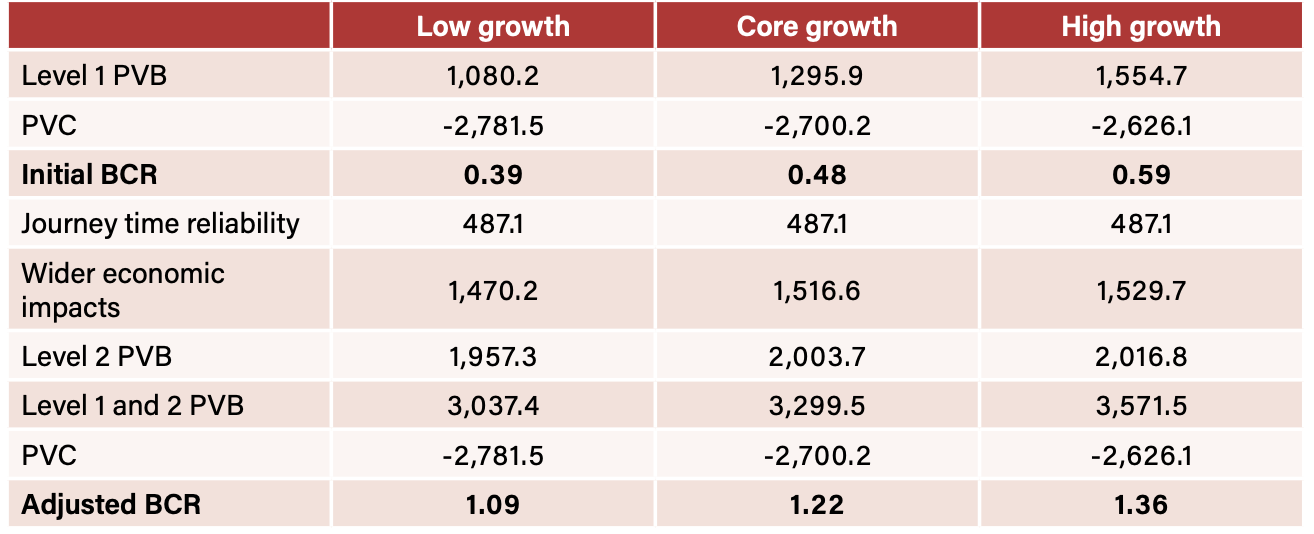
There are some aspects of this table which are not at all convincing, including the strange assumption that in the three scenarios the same costs and benefits will apply for accidents, environmental impacts (mainly carbon), and ‘reliability’ benefits, and very nearly the same value for ‘wider economic benefits’. All of these surely would be expected to vary with traffic growth.
The longest established (and claimed to be the most reliable) figure is for traffic benefits, mostly of ‘time savings’ (defined conventionally as travel times with the Crossing in place forecast to be less without it). The estimated benefit in the ‘low growth case’ is 17% less than the core, and the high growth case roundly 20% higher. This is driven essentially by the fact that the forecast of base ‘no LTC’ congestion in the low growth case isn’t as bad as in the high growth case, so the benefits of the extra capacity are not so great. Conversely, although the time savings estimated in the high growth case are higher, so also is the trend for congestion to get worse following the construction, so traffic conditions more swiftly start to deteriorate, of which more below.
All these features are central to the DfT advice on treatment of uncertainty in the appraisal. The relevant guidance in this case is the explicit DfT advice, in TAG Unit M4 (Forecasting and Uncertainty), para 4.1.1, which states the ‘key questions’ which analysis of uncertainty should address:
“‘Key questions include:
- Under high demand assumptions, is the intervention still effective in reducing congestion or crowding, or are there any adverse effects, e.g. on safety or the environment?
- Under low demand assumptions, is the intervention still economically viable?
- Under a wide range of possible futures, does the intervention still provide value for money?’
The significance of traffic growth: How high? How low?
Conclusions from Table 2 obviously depend on how far apart ‘low’ and ‘high’ growth rates are taken to be. The NH figures were calculated from a formula suggested by DfT of adding 2.5% per year symmetrically above and below the base traffic forecast, but damped by using the square root of the number of years. This is an ad hoc method judged at the time to relate to the increasing uncertainty as time progressed. However, then DfT established its ‘Common Analytical Scenarios’ (CAS) for appraisal. These, which underpin the 2022 traffic projections, were based on a range of explicit combinations of economic growth, prices, population, and interpretation of behavioural trends. It was discovered that the 2.5% adjustment was not enough to encompass the range of possibilities in the CAS scenarios, and the DfT recommended using 4% instead.
For all the ‘value for money’ analyses reported to the Examination, National Highways refused to do this. They wrote:
“The Applicant does not consider it proportionate to update its modelling and appraisal work whenever there is a change in the DfT’s guidance, where this change occurs after submission of its DCO application. This position is supported in national policy at paragraph 4.7 of the 2014 NNNPS which notes that Transport Appraisal Guidance is updated regularly but states that ‘updated guidance is only expected to be used where it would be material to the investment decision…’ which it would not be in the Project’s case. The transport modelling using NTEM 8 and the Common Analytical Scenarios was undertaken to demonstrate that the need for the Project and the relief provided by the Project at the Dartford Crossing, compared to the Do Minimum situation, remained with the revised traffic growth forecasts and in each of the Common Analytical Scenarios.”
and
‘As is usual practice the FBC [Full Business Case] will be produced for the Government if the DCO is granted consent’
The NNNPS condition is that updated guidelines should be used if it would be material to the investment decision, and there is simply no basis for asserting that this would not be the case for the Lower Thames Crossing; quite the reverse, because all of its benefit-cost calculations are now so low. It is true that NH had been adopting a practice of calculating a ‘Full’ business case only after approval was given, but this related to the addition of a discussion about fit with strategic objectives and other speculative factors which might enhance the case (or, in principle, diminish it, though this seems to have been much rarer). But the DfT has never recommended that inclusion of the Common Analytical Scenarios would count under this ‘Full Business Case later’ practice. Quite the reverse. It is spelled out explicitly and very clearly in Table 2, page 25 of the DfT’s TAG Uncertainty Toolkit that critical Common Analytical Scenarios should be run, and the Value for Money reported, not only in the ‘Full Business Case’, but also in the ‘Outline Business Cases’ which are the ones submitted for Examination. This applies not only for high impact projects, which LTC is, but even for medium impact projects.
And in any case, as a matter of Examination procedure, how could it be reasonable to ask the Examining Authority to recommend consent at the same time as telling them that the information necessary to assess the key question ‘Under a wide range of possible futures, does the intervention still provide value for money?’ will only be reported after the scheme is given consent?
This is especially the case given that under low traffic growth futures, simple extrapolation of NH’s earlier calculations in table 2 above indicate that the net present values will be negative, and the Benefit Cost Ratios (BCRs) less than 1, for credible cases well within the CAS envelope. For example, ‘low traffic growth’ can be produced by either low economic growth, or by a revised appreciation of shifts in behavioural trends since 1991, including the impact of Covid. In the revised scenarios, either would result in lower benefit cost ratios and both together would probably produce BCRs of less than one, i.e. negative net present value. This would certainly be ‘material to the investment decision’, and even more so if a more active programme of mode shift was pursued than is currently included in any of the defined scenarios. (DfT, while not encouraging the multiplication of further scenarios or combinations, does provide for this to be done if there is a public interest or relevant information in doing so. Such a practice would be implied if other alternative policies or projects had been assed, which I’ll discuss in Part 2).
Why higher traffic growth poses an appraisal problem
The effects of a higher traffic growth rate raise a different problem. The value for money calculation suggests a higher BCR (though even then, still in the DfT category of ‘low value for money), but this is because it is based on a worse ‘without LTC’ forecast, not a better ‘with LTC’ one. The problem is that then the projected relief from congestion applies to a shorter and shorter time, the higher the traffic growth, and raises the prospect of a ‘predict and provide’ further crossing to be required within, possibly, in less than a decade.
This is shown in Table 3 below in which I re-present NH high traffic forecasts at Dartford using the three years 2016, 2030 and 2045 (now delayed to 2032 and 2047), reported by National Highways. This table addresses two questions:
a) Approximately what year would the forecast traffic at Dartford grow past the level seen in the base year 2016?
b) For how long after 2030 or 2032 would traffic remain lower than in 2016, enabling lower levels of congestion, separately for the original core analysis reported by the NH and for the higher levels of traffic using the 2023 traffic calculations?
Table 3. Dartford Crossing predicted traffic flow (pcu), compared to base conditions in 2016
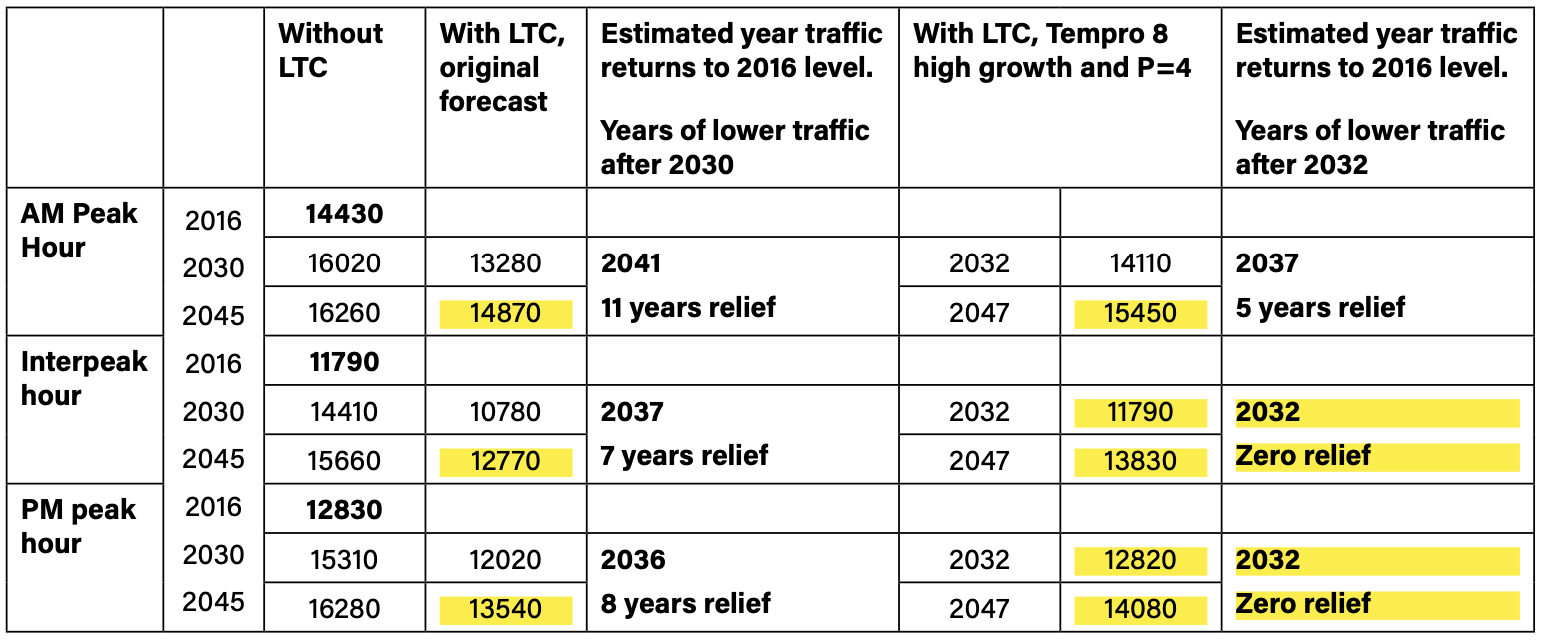
Source; calculated from Table 5.3 ComMA 7 D Base case
The yellow highlighted figures are the ones for which traffic exceeds the 2016 base. This shows that even with the original core forecasts for Dartford, NH forecast traffic levels are less than 2016 in 2030 in all three time periods, but they all exceed the 2016 levels by 2045. Interpolating (assuming linear growth) gives an estimate of another 7 to 11 years declining relief until the traffic at Dartford again exceeds 2016 levels.
However, the revised figures for the high traffic growth forecasts show a dramatically reduced period of relief following 2032, in the morning peak. And for interpeak and evening peak traffic, forecast flows for 2032 will already have reached the 2016 level, and progressively increase above that level until 2047 and beyond. The engineering challenges of traffic congestion increase through the whole period.
In the metric of the relative traffic congestion with and without the crossing, there is ‘relief’, in a sense, throughout. However, using a metric ‘are traffic conditions improving or getting worse’, the relief is a temporary interruption to a deteriorating trend. This is a recipe for a crisis in public confidence.
The impact of induced traffic: HGVs and LGVs
National Highways use a model for forecasting traffic that they developed themselves, with public funds, and refuse to let other interested parties have direct access to it. For car traffic, it is a ‘variable demand’ model meaning that there is some provision for road users to change their demand in response to network expansion, so it makes an allowance for induced traffic (arguably not enough, but I won’t pursue that here). However they assert firmly, but very briefly:
‘TAG Unit M2.1 sets out that LGVs and HGVs do not experience variable demand as their journeys are driven by commercial needs, and therefore remain consistent between the Do Minimum and Do Something scenarios.’
So there is no induced traffic forecast, as a result of the Lower Thjames Crossing, for LGVs or HGVs. The words quoted simply do not appear in TAG Unit M2.1 or indeed anywhere else in TAG Unit M2. TAG uses a much softer and more nuanced statement that assuming there is no induced traffic for freight transport is ‘often done’, mainly due to modelling difficulties. So there is indeed a sort of recognition of the existence of the practice, but it falls far short of a firm recommendation that this omission should, let alone must, be done. The drafting has some signs that there may have been a difference of opinion about the matter, and the result is a compromise.
This is not surprising, because the main evidence that there is indeed very likely to be induced traffic in relation to goods vehicles is contained in work published by the DfT itself, over some decades. That evidence is too long, detailed and technical to include in full in this Column, but I am pleased to report that LTT’s associated publication for professional authored papers on transport topics, TAPAS, has agreed to include a fuller summary which will be open as always to discussion and (if there is any!) controversy.
Why induced demand for goods movements surely exists
In summary, the five main strands of evidence I would suggest in favour of recognising induced demand for good vehicles is as follows:
-
The project itself has largely been designed to facilitate additional freight movement across the Thames. The Thames Crossing Action Group, a local body campaigning against the project, provided a service in submitting as evidence a large number of National Highways public relations videos which NH had not submitted itself, consisting of interviews with national and local companies who supported the Lower Thames Crossing precisely because - they firmly insisted – it would enable them to develop new markets or expand activity on existing ones. (They would no doubt have been astonished if they had known that NH was firmly convinced they would be unable to do so, on the proposition that “LGVs and HGVs do not experience variable demand as their journeys are driven by commercial needs”, and therefore that their demand would be the same both with and without the Lower Thames Crossing).
-
The DfT report ‘Final van statistics April 2019-March 2020’, issued in 2021, provided a detailed analysis of van statistics, which are the largest category of Light Goods Vehicles. This showed that their largest function (54%) is to carry equipment, tools and materials, for example by builders, plumbers, electricians and other tradespeople, Other important activities are ‘delivery’ (16%), and Private domestic non-business use (also 16%) and recreation, leisure and holidays (11%). All of these, in different ways, are perfectly able to respond to changing traffic conditions by carrying out more or less activities. So even if the ‘no induced traffic- were to apply to HGVs, it would not apply to the very numerous LGVs.
-
There is a long tradition of econometric work on the response of goods traffic to changes in money cost, especially fuel price, of which the most recent review was the DfT report, Road traffic demand elasticities: A rapid evidence assessment, by Fay Dunkerly, Charlene Rohr and Andrew Daly, summarising key findings from several earlier studies, with their best overall estimate being
“the elasticity estimates are reasonably consistent, in the range 0.1 to -0.2 for the fuel price elasticity of demand in tonne-km and in the range -0.25 to -0.4 for the fuel price elasticity of demand in vehicle-km.
They comment that these figures for the sensitivity of goods traffic to price are broadly similar to those found for the sensitivity of passenger demand to price. There is a hard-wired relationship in the transport modelling and appraisal used by NH and DfT, that responses to money costs and time costs are connected by the value of time. If the volume of freight traffic is sensitive to fuel price, the conclusion can be firmly drawn that it must also be proportionately sensitive to journey times. To reject such a relationship would undermine a central feature of the economic appraisal and would cast doubt on all the values of time savings.
-
The Standing Advisory Committee on Trunk Road Assessment (SACTRA) in 1994, in its report Trunk Roads and the Generation of Traffic, triangulated the evidence on induced traffic from many different empirical and theoretical sources, with empirical analysis of before and after counts of traffic changes associated with the provision of additional capacity. Most of those studies used PCU counts of both cars and lorries added together. The same has been used by Highways England/National Highways own series of before-and after studies, called POPE (Post-Opening Project Evaluation). Thus any conclusions about induced traffic from these studies cannot be used to conclude that induced traffic exists for cars but not lorries (though it does imply that if this is indeed the case, the induced traffic for cars has been underestimated).
-
The SACTRA Report ‘Transport and the Economy’, 1999, included a substantial discussion and review of ‘How firms respond to transport changes’, of both theoretical and empirical analyses of the mechanisms in logistics and supply chains, ability to reach new markets, ability to use time and money savings productively, which will be represented, especially over the longer term, in extensive flexibility of the mileage travelled.
The importance of this is that, by very well established transport demand methodology, the assumption ‘there is no induced traffic for HGVs or LGVs’ will overestimate the benefit cost ratio.
It does remain true that National Highways has not developed models which enable these changes in the volume and pattern of goods traffic to be estimated, bearing in mind that this will be very different as between HGVs and LGVs, due to their distinctly different functions, and also no doubt different for domestic and international transport. My conclusion from all this is that a new model development activity – it should be initiated by the DfT itself – is vital to address the ‘modelling difficulties’ that have prevented this from happening in practice. I think that Consultants with expertise in model development would be very well advised to prepare themselves to respond to such a need (and academic modellers with access to research council or other funding would do well not to wait). Of course it just might be the case that some of them will say that they have already developed the skills to model variable demand for LGV and HGV movements, and this already could have been done?
Meanwhile, the modelling for LGVs especially, and to some extent HGVs also, will underestimate induced traffic and therefore underestimate the resulting growth of congestion. There are ad hoc adjustments that can be made, to allow for this bias, and this should be done pending necessary model development.
Some Interim Conclusions
Though this has been only the first part of my extended look at the Lower Thames Crossing case study, I can offer some quite firm observations. Firstly, it seems to me that the form of Examination where so much material has to be considered in so short a space of time – and in which some of the most crucial information is not allowed to be considered at all – is not fit for purpose. Instead, I believe, it undermines real scrutiny, presents an impossible task to the Examining Authority, and is unlikely to reduce subsequent challenges. This is especially the case in a context where the scheme promoter is also the sole custodian of the model used for appraisal. Perhaps it is time to reconfigure the respective roles, make the models shared property of the interested parties, and give the responsibility of modelling appraisal to an independent professional body.
On the specific issues considered in detail, I most clearly conclude that the core economic assessment casts great doubt on whether the project provides acceptable value for money. If demand is lower than anticipated, then the net present value is likely to be negative, i.e. it makes a loss to the economy as a whole. If demand is higher, then there is the prospect of a very short period of congestion relief, and a serious issue of public confidence in transport professionals and what will be seen as Government promises to address an issue, but not actually do so.
In Part Two of this Contribution, I will discuss the treatment in this scheme of a range of other matters that have more general implications for appraisal. These comprise : Wider Economic Benefits; Reliability; an unresolved conflict between the results of local simulation models and the NH wider network analyses; longer term impacts of Covid; revised official economic growth estimates following financial crisis and estimated effects of Brexit; the ‘high’ carbon values advised by BEIS; potential effects of climate change on economic activity; potential impacts of declared Government policy on walking, cycling, public transport, and vehicle use; the (non) consideration of alternative projects and strategies; scenarios which go outside the DfT CAS, or are composed of combinations of them. And the significance of cost inflation.
References and Links:
-
Road traffic demand elasticities: A rapid evidence assessment
-
Road traffic demand elasticities: A rapid evidence assessment
Professor Phil Goodwin is Emeritus Professor of Transport Policy, University College London and University of the West of England. He was head of the Transport Studies Unit at Oxford University for 16 years, before moving to UCL in 1996.
This article was first published in LTT magazine, LTT885, 6 February 2024.
You are currently viewing this page as TAPAS Taster user.
To read and make comments on this article you need to register for free as TAPAS Select user and log in.
Log in