TAPAS.network | 22 January 2025 | Commentary | David Metz
Travel demand saturation means we should accept our road system has reached maturity, and act accordingly

For a number of reasons our major road network does not justify further expansion, believes. He sees parallels in the way we put an effective stop to road building in urban areas and turned to better capacity management and behaviour change, rather than congestion relief, as key objectives. Now is the time to grasp the nettle for the trunk and primary road network too, he argues
THE NEW Labour government includes a junior minister in the Department for Transport with responsibility for roads, but with the unusual title of ‘Minister for the Future of Roads’, perhaps implying that the future will not be business as usual – likely to be the case, in my view. Consistent with this, the Department has established a panel of external experts to provide advice on strategic considerations for its capital investment portfolio (LTT magazine, 28 November 2024). The government is also establishing a new body, the National Infrastructure and Service Transformation Authority (NISTA), combining the functions of the National Infrastructure Commission and the Infrastructure and Project Authority. NISTA will be located in the Treasury and is intended to bring oversight of strategy and delivery under one roof, supporting the development and implementation of a ten-year infrastructure strategy (LTT magazine, 9 January 2025).
Several sets of eyes are therefore going to be looking hard at where investment is genuinely needed to support the Government’s key missions, a dominant one of which is delivering economic growth.
There is a general belief, voiced by the Prime Minister, other politicians and many industrialists, that we need to invest more in infrastructure to facilitate economic growth, decarbonisation and other policy objectives. To be sure, the case is persuasive for investment in new electricity sources of supply and transmission, in the water industry to clean up effluents and build new reservoirs, in fast broadband, in flood defences and in solid waste disposal. But transport is different, and the perceived links between infrastructure provision and economic development not as hard-wired as has previously been thought, as I argue in my new book, ‘Travel Behaviour Reconsidered in an Era of Decarbonisation’.
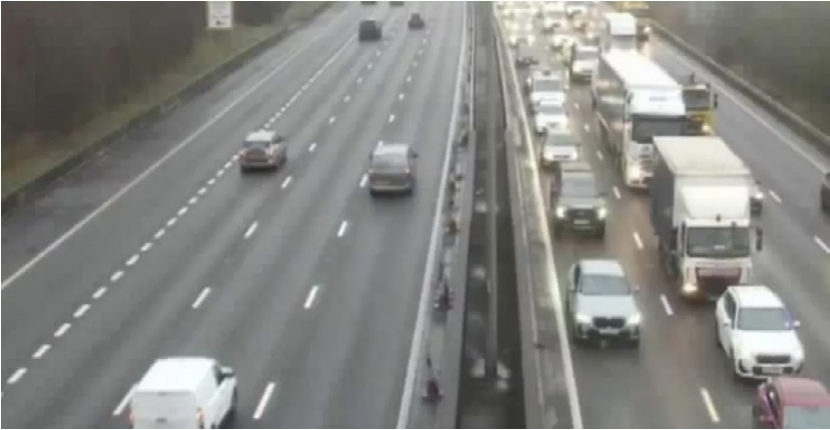
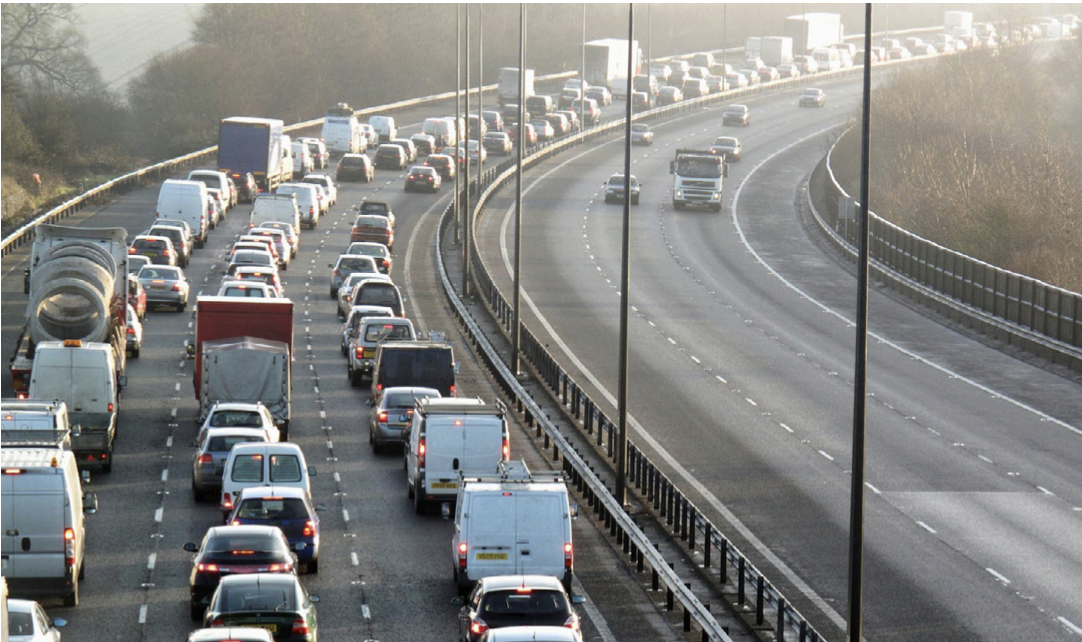
Generally, our existing road system provides adequate capacity but problems mainly arise when there are incidents, or at peak commuting times. Both can be addressed by management measures rather than new road building
Personal travel in Britain, on a per capita basis, has not increased over the past 25 years. According to the National Travel Survey, on average we are on the move for about an hour a day, making about a thousand journeys a year, covering some 6500 miles by all travel modes (except international travel by air, a different story). This is unlikely to increase in the future. We have reached the limits to the speed of travel with existing technologies, and new technologies, such as electric vehicles or automated vehicles, whatever the other benefits, will not allow us to travel significantly faster.
Besides, there is evidence that most of us have enough travel to meet our needs for access to people and places, employment, services and activities, family and friends, with an ensuing good range of opportunities and choices. For instance, a study by the former Competition Commission found that 80% of people living in urban areas had a choice of three or more large supermarkets within 15 minutes’ drive, and 60% had a choice of four or more. If a choice of three or four supermarkets is sufficient to meet your needs, your demand for travel to this class of destination is said to be ‘saturated’, a standard concept in business economics. This has come about through both the growth of car ownership providing access, and the supermarket chains taking advantage of road construction that made land accessible for new large stores both in and on the edge of urban areas, both trends now largely played out. Moreover, with the growth of local ‘convenience’ food stores in recent years, both branches of major chains and independents, a similar situation commonly applies in urban areas for those who shop locally.
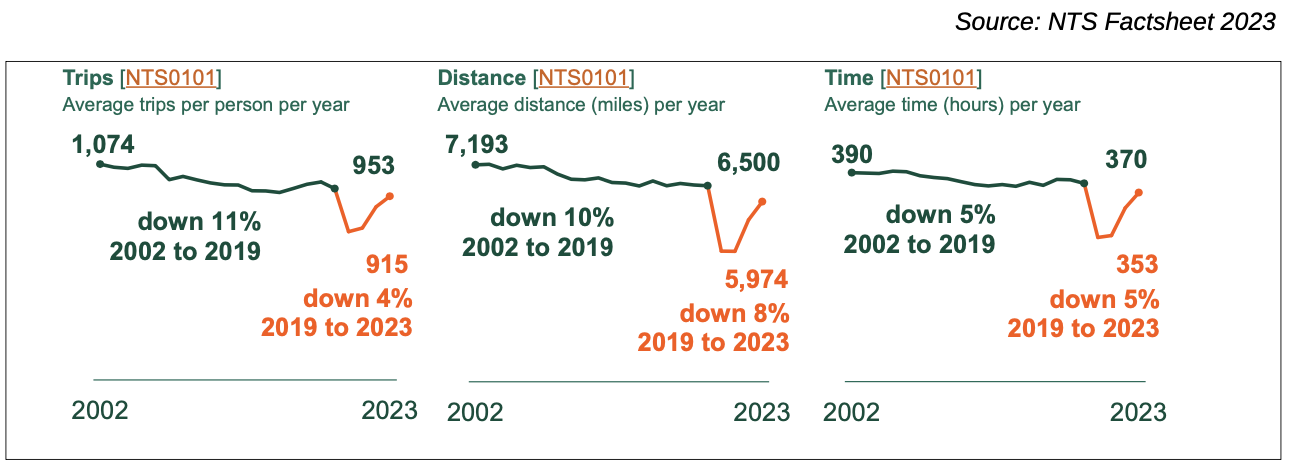
Trips, distance and time spent in travel have not increased for the last 20 years
Beyond food stores, DfT Journey Time Statistics for access to key services indicates high proportions of potential users having access to key services within reasonable travel times. For example, for access to GPs, 71% of users are within 15 minutes travel time by public transport/walking and 96% within 30 minutes, while 87% are within 15 minutes by bicycle and 98% by car. Similarly, high levels of access are found for other services, including employment opportunities, schools, food stores and town centres. Journey time statistics can also be used to infer levels of choice of such services. For instance, the populations of a majority of English localities have access on average to five or more GPs within a 30-minute journey by public transport/walking, and almost all localities have such choice within 15 minutes by car (ref 1). Moreover, new methods for connectivity analyses are allowing even better understanding of these relationships between transport services and the facilities and services people need to reach (see for example https://www.podaris.com/).
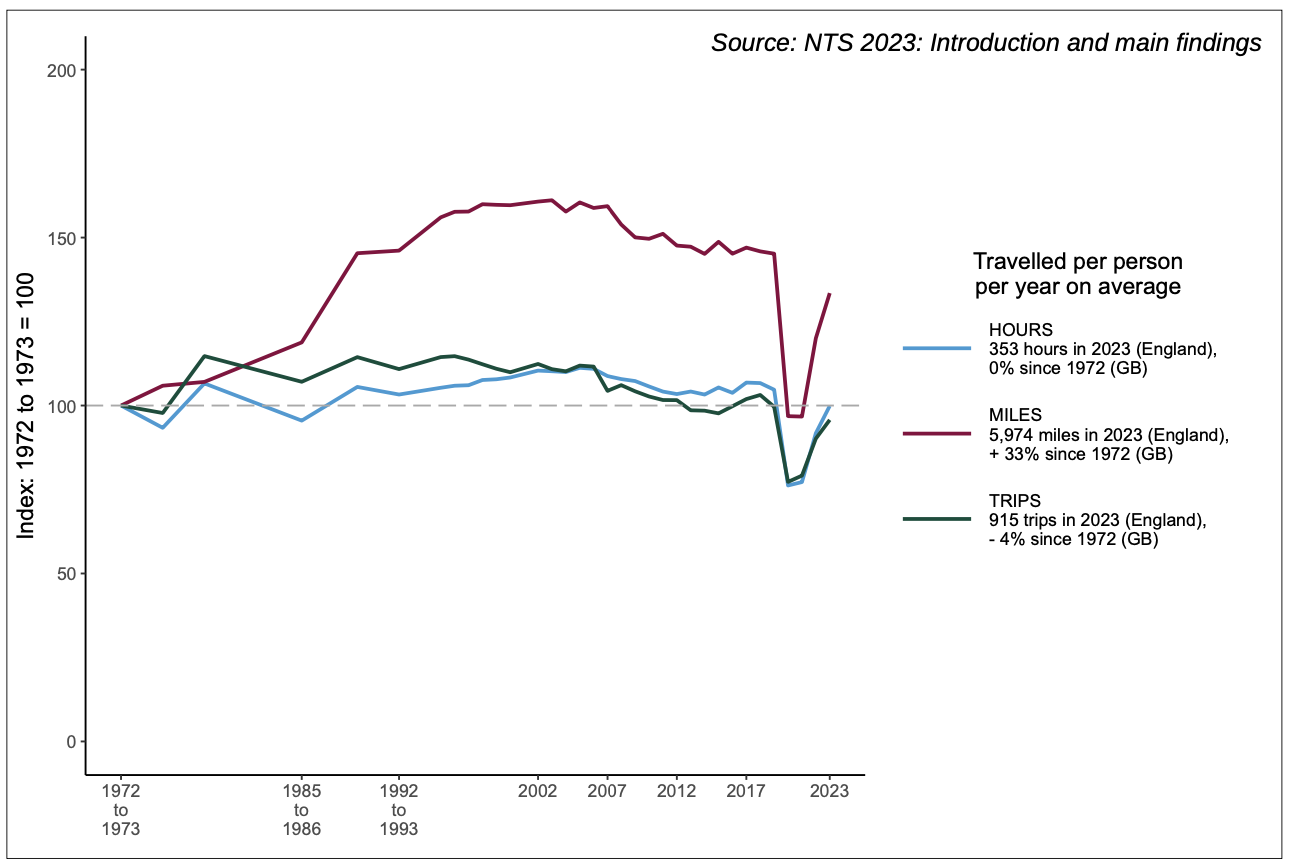
The impact of the pandemic is clear from this chart, but so is the pre-existing longer term downward trajectory since the beginning of the 21st century
More generally, the available evidence indicates that those with a car in the household, or who have the use of decent public transport services, as a result have good levels of access and choice of regularly used types of destination. There are, though, places where choice is limited, particularly in rural areas, which is where the car is particularly advantageous.
However, the population is growing, the consequence of net immigration. The impact on travel demand will depend on how this growth is accommodated: to the extent that new housing is developed on greenfield sites, car use will be important, leading to more traffic, and prompting further road investment; but to the extent that new homes are developed in existing urban areas, investment in public transport would be more relevant. This balance would be influenced by how demand for accommodation is influenced by the travel preferences of young adults. Yet the current bottom-up piecemeal approach to planning for new homes by each local authority, does not address the overall likely impact on the transport system.
Market maturity
The pattern of uptake of a new consumer item or service over time generally plots out as a S-shaped curve: slow growth initially driven by innovators who prize novelty or cutting-edge technology, followed by the early adopters, then the middle majority and subsequently by the laggards, in the well-known technology adoption life cycle. The eventual outcome is high levels of ownership and use, for instance over 85% of household ownership for many types of ‘white goods’, such as washing machines and refrigerators, and similarly for well established ‘brown goods’ such as televisions. When such high levels are achieved, demand is effectively saturated, with further sales dependent on technological advances where that is possible, prompting replacement, on obsolescence or excessive costs of repair, or on growth of households. Markets are then said to be mature.
Oddly, demand saturation and market maturity are concepts rarely considered in travel analysis. Although I published a paper in a peer-reviewed journal in 2010 titled ‘Saturation of Demand for Daily Travel’ (ref 2), few other investigators have pursued this theme. The general assumption is that travel demand will continue to grow as incomes grow, such that econometric analysis involves unquestioning extrapolation of historic data and relationships into the future, as the basis for forecasting of travel demand and appraisal of proposed transport investments.
The evidence for substantial travel demand saturation is fits well with the familiar concept of sustainable travel, and prompts my proposal that transport networks are best regarded as mature, with only marginal benefits to be gained from costly investment in additional capacity. This is already how we see urban roads, where, in the last century, efforts were initially made in the 1950s 60s and 70s, to increase capacity to meet growing car use, for instance by constructing urban motor roads (often elevated), by creating one-way systems (known as ‘gyratories’), and segregating traffic from pedestrians. But within a couple of decades this was seen to damage the urban environment and subsequently there has been a reversal of priorities, making more road space available for bus and cycle lanes and for pedestrians.
So we now effectively treat urban road networks as mature, the aim then being to manage demand for vehicle travel, whether directly as through London’s congestion charge or Nottingham’s workplace parking levy, or indirectly by investing in alternative travel modes, particularly rail-based mass transit technologies that are faster and more reliable than cars, buses or taxis on congested roads, such as Manchester’s light rail system.
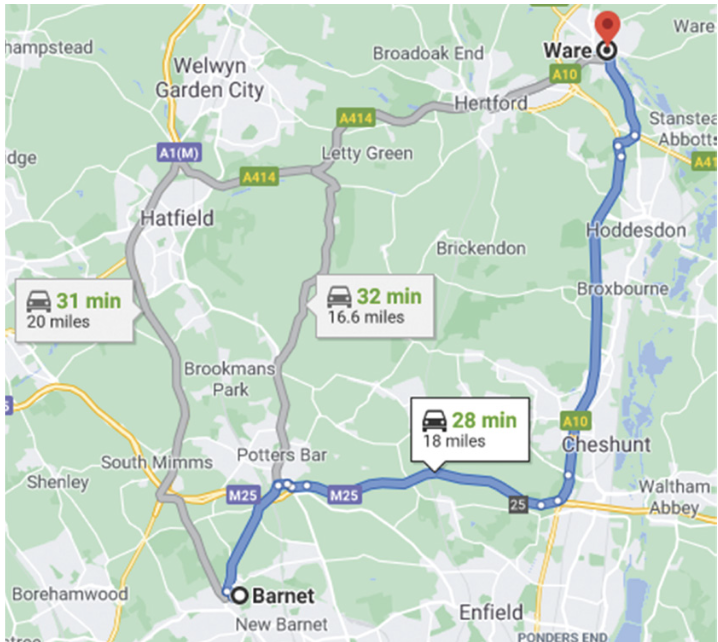
Use of satnavs is allowing drivers to adjust their trip to address pinch points or incidents on the routes they take
I suggest that there is now a good case for regarding the interurban road network as substantially mature, with little to be gained in general from constructing additional capacity. A very common situation is a major road in or near populated areas, with morning and evening peak congested flows. To the highways engineer, this is a prompt/opportunity to invest in additional capacity, whether by adding carriageway to the congested road or constructing a separate ‘relief road’, in order to alleviate congestion and hopefully to improve connectivity between cities, so boosting economic growth - motivations which politicians are generally pleased to endorse as delivering ‘solutions’.
However, the morning and evening peak flows indicate that the road is being used by commuters, who have alternative routes available. So, if the capacity of one route is increased and delays thereby reduced, commuter traffic will divert to that route, a process now facilitated by the wide use of digital navigation devices (commonly known as satnav) that indicate journey times by alternative routes (ref 3). Increased commuter diversion pre-empts additional capacity intended for longer distance business users, including freight, on which the economic case for the investment largely depends. This is the basis for the maxim that ‘we cannot build our way out of congestion’, which we know from experience to be generally true.
There will be cases where road investment may be justified, for instance to make land accessible for new development, whether commercial or housing. But the decision needs to be made jointly by the planning authority, the developers and the road authority, with the developers contributing to the cost of the road infrastructure from which they benefit, rather than claiming that the new capacity is a benefit to the whole community. Moreover, all instances of investment to increase road capacity result in increased carbon emissions, both from road users and from the embedded carbon in materials, notably cement and steel – a further reason to regard the road network as mature and its expansion as problematic.
Road freight
My argument so far has concerned personal travel, including travel by car on business and for commuting, both purposes recognised by the National Travel Survey. Yet cars share the roads with freight vehicles, so we need to consider how the latter impact on the demand for road capacity.
For aviation, though there are dedicated freight services, passengers in the cabin and high value freight in the hold are complementary sources of revenues for the airlines. On the railways, passenger and freight trains are distinct, but must be managed on busy intercity routes to optimise overall performance. But on the roads, such management is not attempted – it is effectively a ‘free for all’ as to who gets to use the available capacity.
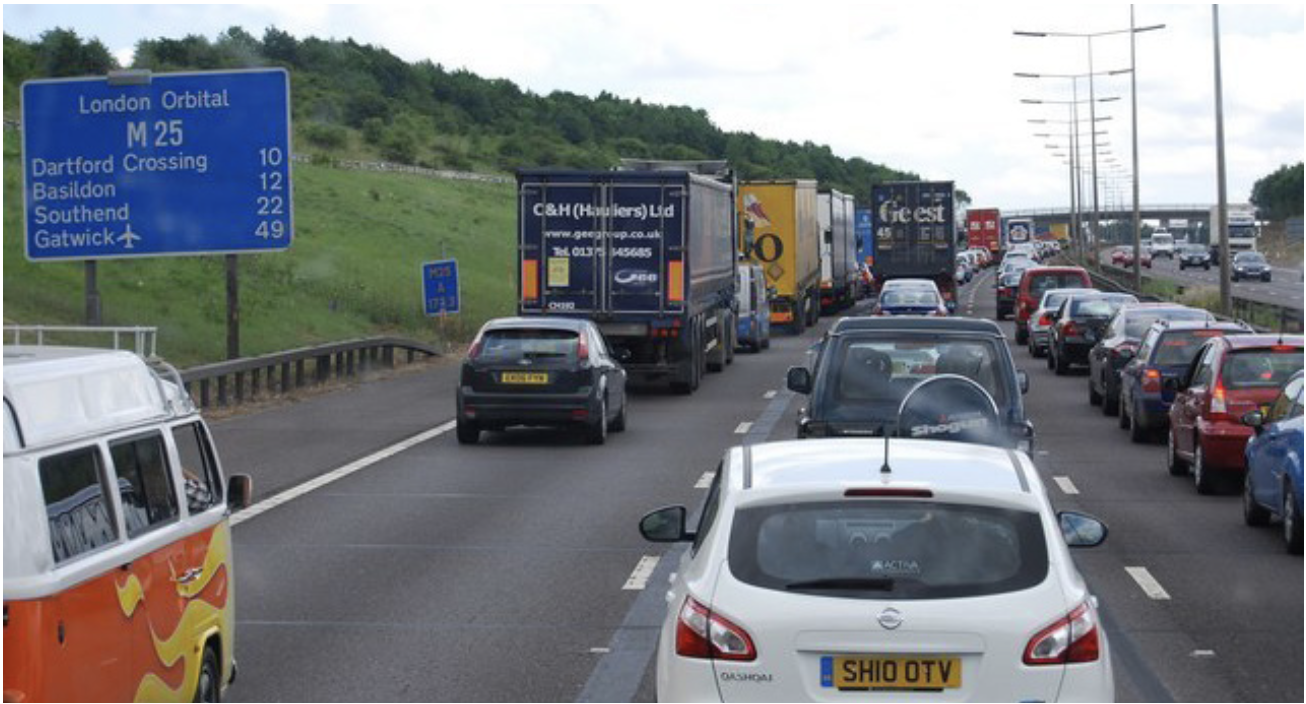
Different classes of road user share the capacity without any attempt to prioritise freight which might arguably warrant different treatment
The Department for Transport has collected survey data on road freight carried by a stratified sample of heavy goods vehicles (HGVs), including tonnes lifted, tonne-kilometres moved and kilometres travelled; domestically, these were 3-5% lower in 2023 than 2022 (ref 4). UK-registered HGVs operating internationally lifted 12% less tonnes in 2023 than in 2022, and 30% less than the 2015-2019 average, reflecting a long-term decline over the past twenty years, in part a consequence of the 2008 recession and Brexit (ref 5). The number of licensed HGVs in England has changed little over the past twenty years. So, we have seen no overall growth of HGV traffic in recent years, and have little expectation of future change.
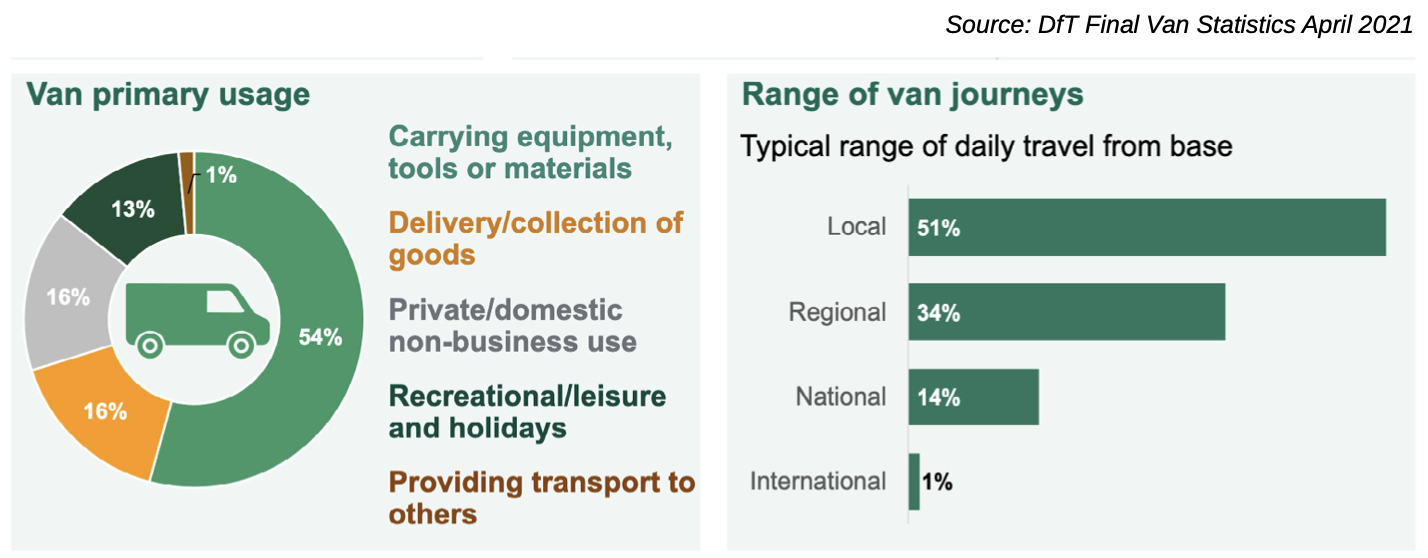
Van usage is the main growth area in the freight sector, but it is not all for carrying conventional freight and tends to be short distance and use more local roads
In contrast, the number of vans (i.e. light goods vehicles, LGVs) increased by 70% over the past two decades (ref 6). A pre-Covid-19 survey published by the DfT in 2021 found that total van mileage and van stock have increased in parallel in recent years, with little change in average mileage, although mileage varied with the type of use: in 2019-20, 54% of the van population carried equipment, tools or materials and was responsible for some 60% of total van mileage; 16% delivered or collected goods, responsible for about 25% of mileage; while almost 30% were used for private non-business use or for providing transport to others, responsible for 15% of mileage (ref 7). Use of vans for private non-business use would be captured by the National Travel Survey.
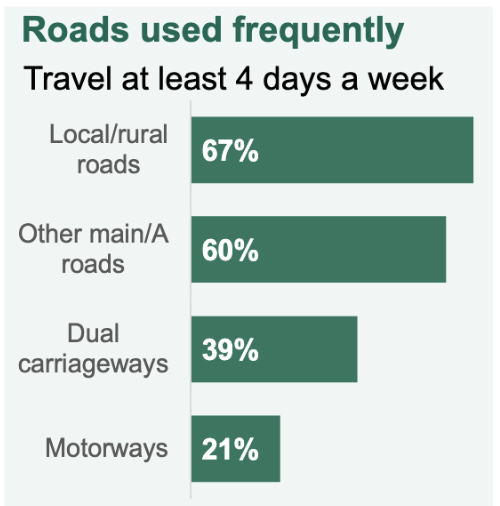
On a typical day, half of all vans stayed local, within 15 miles of their base, just over one third travelled regionally, and 15% travelled nationally or internationally. Vans travelling locally had the lowest average annual mileage overall, at 7,600, while vans that travelled nationally had the highest average mileage at 26,300. Over two-thirds of vans travelled on local or rural roads regularly, with other main or ‘A’ roads also used regularly by 60% of vans. Fewer vans use dual carriageways and motorways regularly, with only 39% and 21% of vehicles using these roads four or more days per week, respectively.
It may be supposed that factors contributing to the growth of van use include the increasing popularity of online shopping, and perhaps the shift in the structure of the economy from manufacturing to service provision. Also, there may be lifestyle changes amongst some previous car owners that prompt a switch to vans. Changes of this kind tend to have natural limits, although it is difficult to predict these in advance. Internet sales as a proportion of total retail sales increased steadily from 3% in 2006 to 22% in late 2019, then peaked at 38% during the coronavirus pandemic, reverting to around 26% post-pandemic, possibly now a stable level (ref 8). More generally, increased distances travelled by vans bring the businesses that use them into increased competition with similar businesses based elsewhere, implying diminishing returns and hence limits to distances travelled.
So to summarise, we have broadly steady HGV numbers and use, contrasted with rapidly rising numbers of vans, roughly two-thirds the usage of which is for business purposes and one third used for private trips that would be captured by the National Travel Survey. What does this imply for the argument that we should regard the interurban road network as mature?
To put the growth of vans in perspective, in 2023 cars account for 76% of all motor vehicle traffic, while vans have become more important over the last decades, now accounting for 17% of all motor vehicle traffic. However, vans are used predominantly on local roads, where generally there is little possibility or intention to increase capacity. The lack of growth of HGV numbers and use does not support any general investment in interurban road capacity. And the small proportion of vans using interurban roads, as well as the uncertain prospects for growth, likewise do not make a compelling case for further such investment. Accordingly, treating the interurban road network as mature seems a sensible approach.
Against this background, a major issue for both the DfT and the new NISTA must be the successor, if any, to the costly second Road Investment Strategy programme (originally announced at £27 billion for 2020-25), particularly at a time of severe pressure on public finances. Besides, any increase in road capacity negates the requirement to decarbonise the transport system, both on account of increased traffic and hence vehicle carbon emissions, and the embedded carbon in cement, steel and other construction materials, and in equipment and vehicles.
The interurban road network needs to be well maintained and used efficiently. The wide employment of digital navigation serves to enhance efficient use by offering optimal routing that takes account of traffic conditions and other impediments to movement. It is to be expected that the generality of vans used for business purposes would employ this technology, which is free to access via a smart phone.
I would argue that what is now needed is for road authorities to concentrate on keeping the system in good order, well managed operationally, and recognise and take advantage of the impact digital navigation is having on driver behaviour on their networks (ref 3).
What we do not need is a further major programme of investment to increase the capacity of motorways and major roads, with the futile aim of building our way out of congestion. DfT’s current review of its Appraisal and Modelling Strategy (LTT magazine, 9 January 2025) creates an opportunity to rethink Transport Analysis Guidance, to develop its application to the management of existing capacity, rather than to produce demand projections that underpin a pre-disposition to invest in new capacity, supported by un-evidenced claims that this will magically unlock economic growth.
References and Links
-
https://www.researchgate.net/publication/248984912_Saturation_of_Demand_for_Daily_Travel
-
DfT data set VEH 0101
-
https://www.ons.gov.uk/businessindustryandtrade/retailindustry/timeseries/j4mc/drsi
Charts
https://assets.publishing.service.gov.uk/media/66c5c0b6cbe60889bddd278d/nts-2023-factsheet.pdf
David Metz is an honorary professor at the UCL Centre for Transport Studies. www.drivingchange.org.uk
This article was first published in LTT magazine, LTT907, 22 January 2025.
You are currently viewing this page as TAPAS Taster user.
To read and make comments on this article you need to register for free as TAPAS Select user and log in.
Log in