TAPAS.network | 3 February 2025 | Commentary | John Siraut
National TSGB and London Travel data annuals underline changing patterns of transport use

New transport and travel data is emerging all the time, but it is useful to occasionally take stock of all the available material to tease out overall patterns and trends. Publication of the two annual compendiums Transport Statistics Great Britain and Travel in London at the end of the year provided such an opportunity for .
TWO LONG-TIME FAVOURITE perennials amongst transport data watchers were published just before the year end: the Department for Transport’s latest compendium Transport Statistics Great Britain (TSGB) and Transport for London’s equivalent Travel in London report. If you didn’t find them in your virtual Christmas stocking from Santa, don’t worry, this article will provide you with some of the highlights.
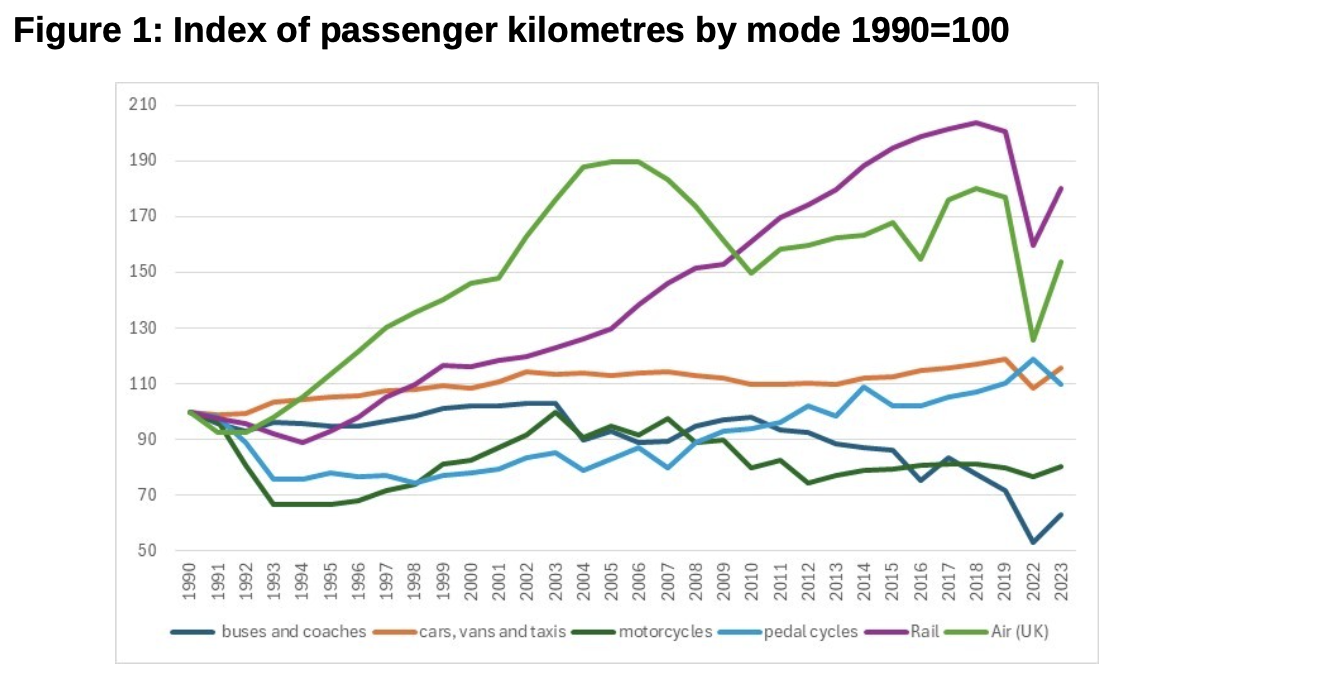
TSGB 2024 describes the major cross-modal statistical trends in Britain’s transport sector, often providing information on long-term trends as well as more recently collected data. For example, figure 1 shows how passenger volumes by mode, measured in billion passenger kilometres, have changed since 1990, (notwithstanding the blip of the pandemic years of 2020 and 2021.)
The data reveals notable shifts in transport use since 1990. Bus and coach travel has declined by a third, while motorcycle use has decreased by 20%. In contrast, pedal cycling has seen a steady increase, rising by approximately 10% since its low point in the mid-1990s. Car, van and taxi usage in total has remained relatively stable over the past two decades.
Domestic aviation and rail travel have experienced significant fluctuations. Domestic air travel grew by 90% between 1990 and 2006, but has since returned to levels seen 20 years ago, partly due to the global financial crisis and the rise of video conferencing, which significantly reduced business travel. Rail use also increased steadily from 1990 until the pandemic, with passenger kilometres doubling. However, like domestic aviation, rail use has not recovered its pre-pandemic levels, and in 2023 was still back at volumes seen a decade ago. In summary, taking a long view, over the last 30 years, rail and aviation have seen substantial growth, while bus use has experienced a substantial decline.
Source: https://www.gov.uk/government/statistics/transport-statistics-great-britain-2024
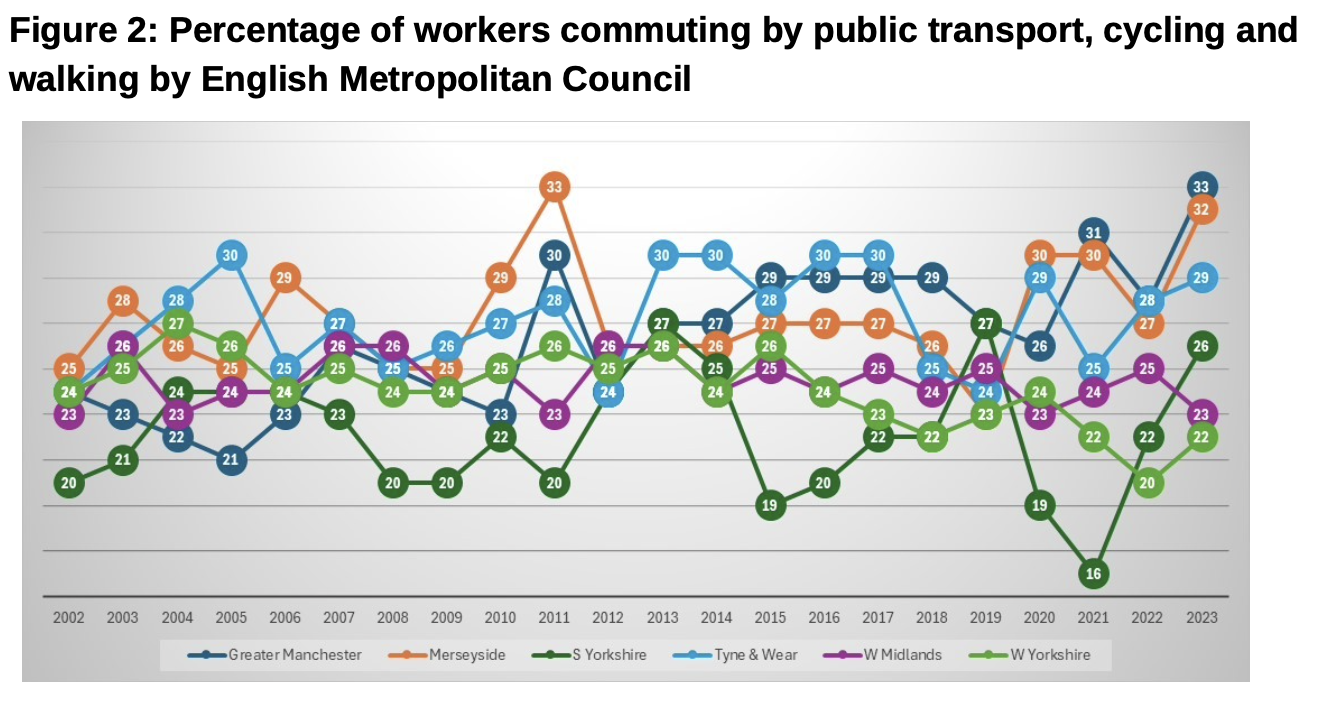
Another long-term series relates to travel to work. Figure 2 shows the percentage of workers commuting via sustainable modes — public transport, cycling and walking — in the six English metropolitan authorities from 2002 to 2023. In 2002, there was little difference between the six authorities, with 20-25% of workers commuting sustainably. Over time, significant differences have emerged. While the numbers fluctuate annually, overall, Greater Manchester and Merseyside have seen substantial increases in sustainable commuting, with up to a third of workers now commuting this way. Conversely, the West Midlands has seen very little change over the last 20 years. The other notable trend across all areas is a shift away from buses and increased rail use.
Source: https://www.gov.uk/government/statistics/transport-statistics-great-britain-2024
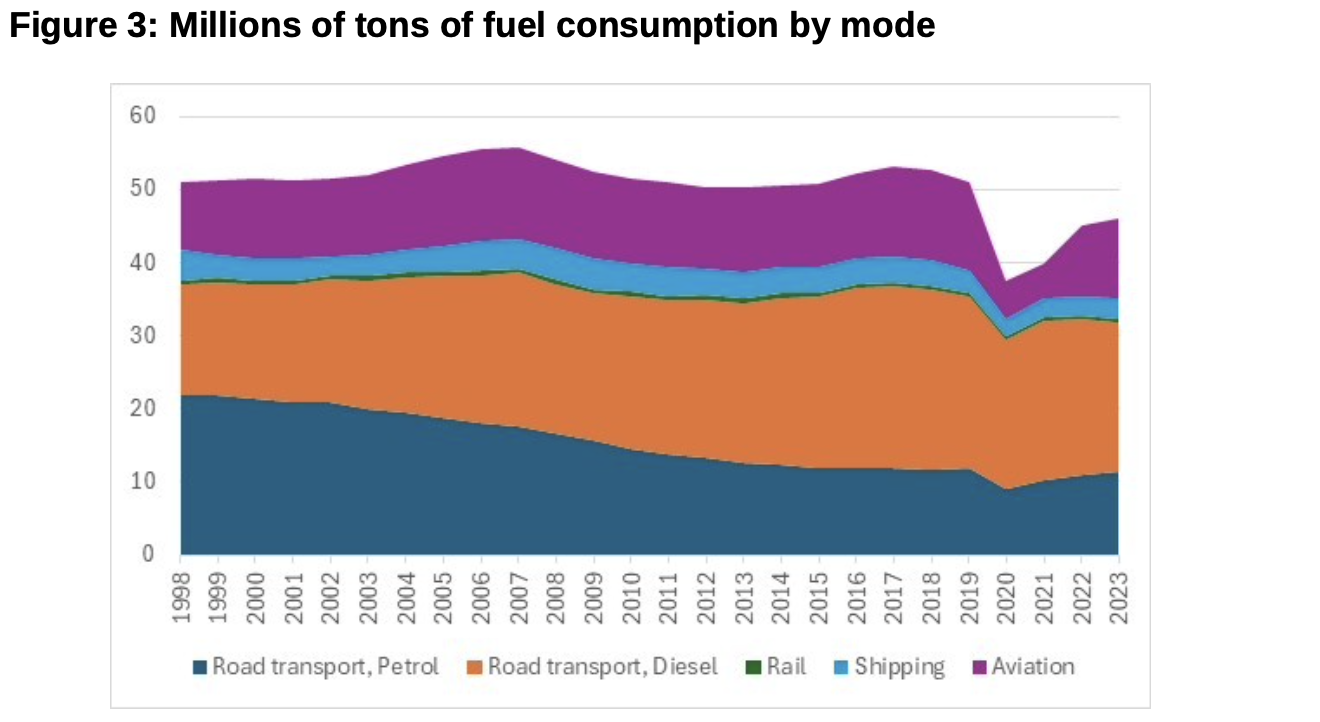
Transport overall has made relatively little progress in recent years towards the government’s net zero objectives. Figure 3 shows petroleum consumption in million tonnes by mode and fuel type for road transport. Overall, fuel consumption has remained broadly constant over the last 20 years, with only the pandemic causing a temporary dip. However, within this overall total, there have been significant changes. Petrol consumption has been steadily declining for a long time, due to a switch to diesel, improved fuel efficiency and, more recently, the move to electric vehicles. Diesel consumption, on the other hand, has grown strongly. By 2016, cars were using more diesel than petrol. However, since then, diesel use in cars has fallen significantly and has offset the continued rise in consumption by light goods vehicles. Aviation fuel consumption has been broadly constant for the last 20 years, but now makes up a significant 24% of all domestic petroleum consumption, up from 18% in 1998. Rail’s petroleum use is around 1% of transport’s total consumption.
Source: https://www.gov.uk/government/statistics/transport-statistics-great-britain-2024
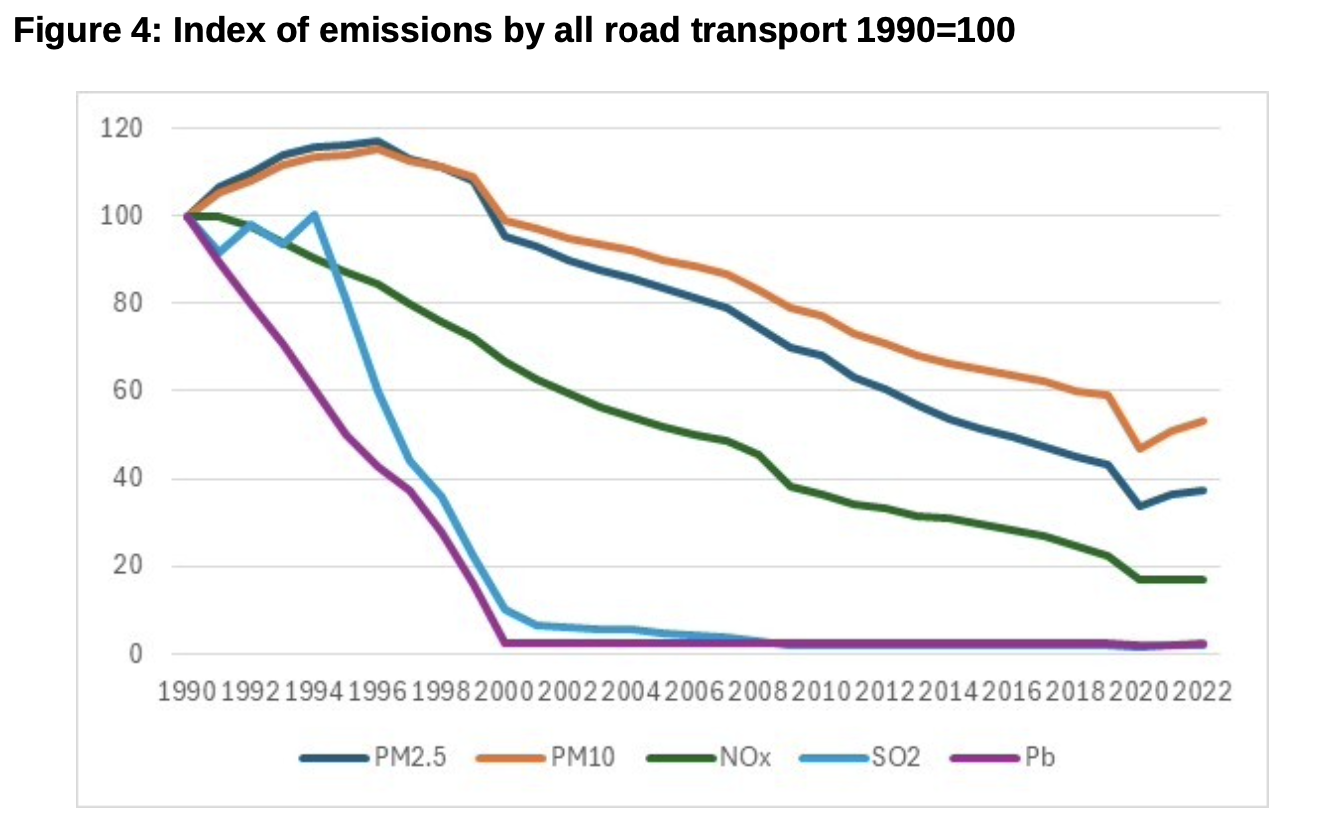
On a more positive note, transport has significantly reduced many of its other environmental impacts. Figure 4 shows the change in emissions of various pollutants since 1990, highlighting that significant environmental improvements are possible. The biggest changes include the removal of lead and sulphur from petrol, leading to a 98% fall in their emissions. There has also been a steady reduction in nitrogen oxides emissions, now down by 80% compared to 1990. Reducing airborne particulate matter has been a slower process as most of these emissions now relate to tyre and brake wear. While exhaust emissions of particulates have fallen by over 90% since 1990, emissions from tyre and brake wear have increased by around a quarter.
Source: https://www.gov.uk/government/statistics/transport-statistics-great-britain-2024
TfL’s Travel in London report (now in its 17th edition, and continuing to be excellently complied by Charles Buckingham, TfL’s Strategic Analysis Manager) also provides some useful cross-modal time series comparisons. Figure 5 shows the estimated average number of daily trips by mode. From 2000 until the pandemic there was a gradual decline in private vehicle trips, a 50% increase in public transport trips, a 20% increase in walking and a tripling of cycling trips. Comparing 2023 with 2019 across the pandemic shows that cycling is up, walking is back at the same level, private transport is just 4% down on pre-pandemic levels, but public transport use is down by 12%.
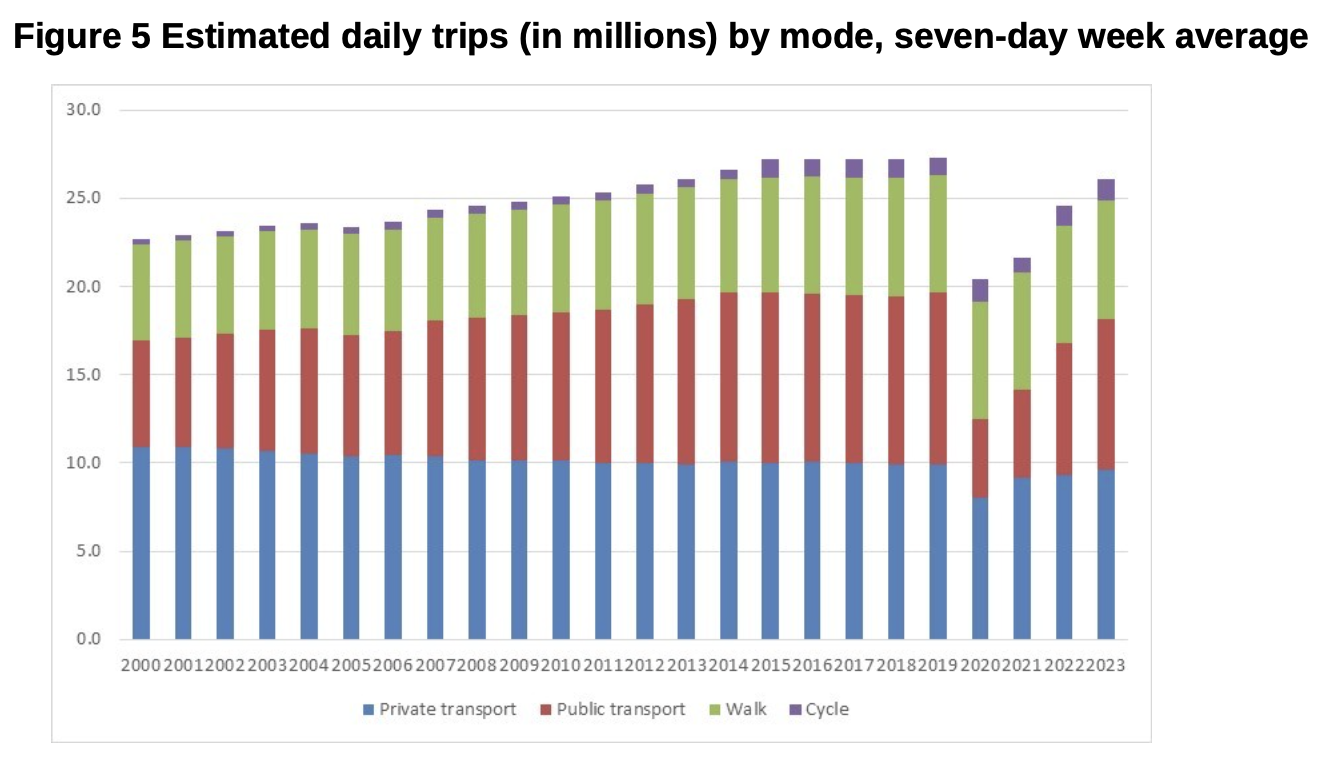
Source: https://tfl.gov.uk/corporate/publications-and-reports/travel-in-london-reports
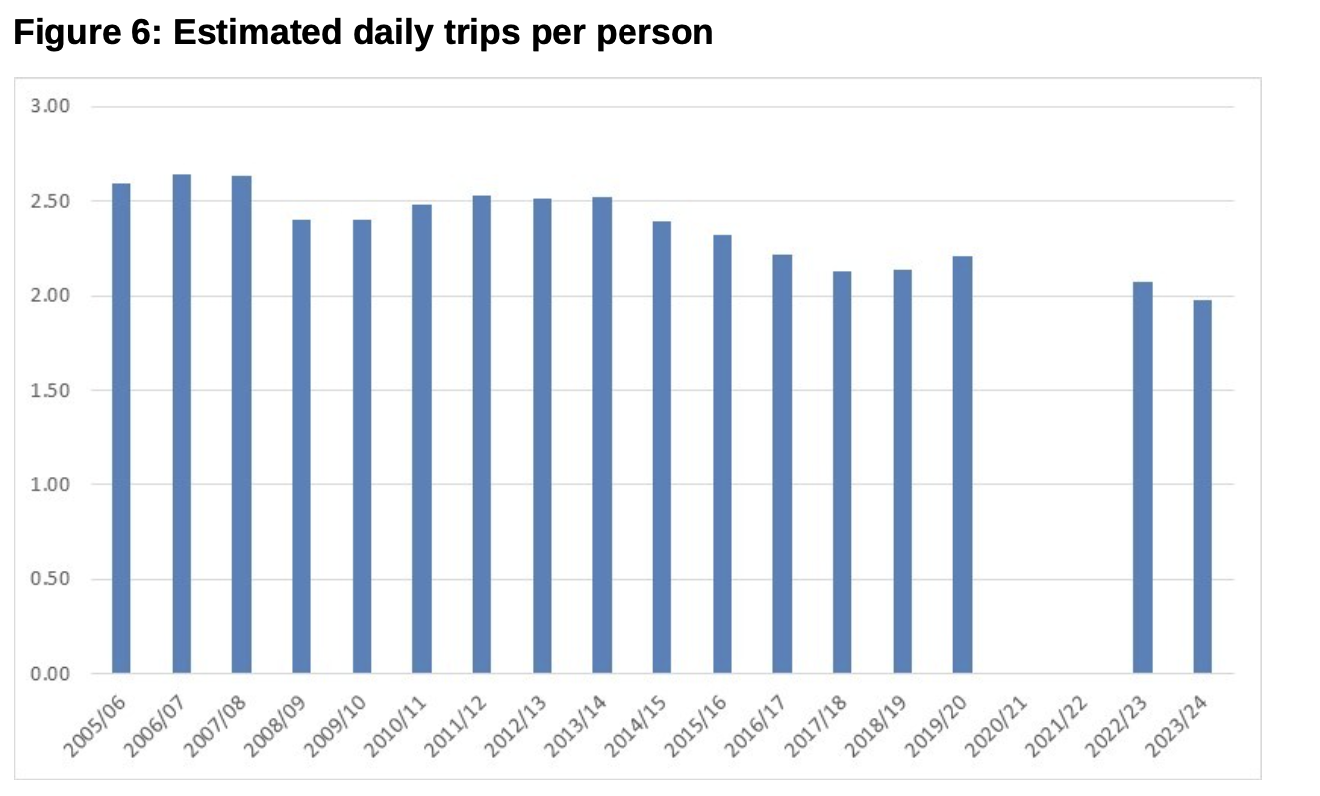
Figure 5 shows the number of trips made within London, whilst Figure 6 considers the number of trips made per day by London residents, excluding tourists and commuters from outside the city.
Even before the pandemic, the number of trips per person was gradually falling and this trend accelerated post-pandemic. This aligns with data from the National Travel Survey, which also shows a decline in number of trips per person. The reasons for this include greater working from home, increase use of on-line shopping, home meal delivery services and home streaming services. This has led to a 25% reduction in the number of daily trips per person. Despite London’s large population growth, the reduction in trips per person compared with the total number of trips in London suggests that non-Londoners now account for around a third of trips within the city compared to a sixth 20 years ago.
Source: https://tfl.gov.uk/corporate/publications-and-reports/travel-in-london-reports
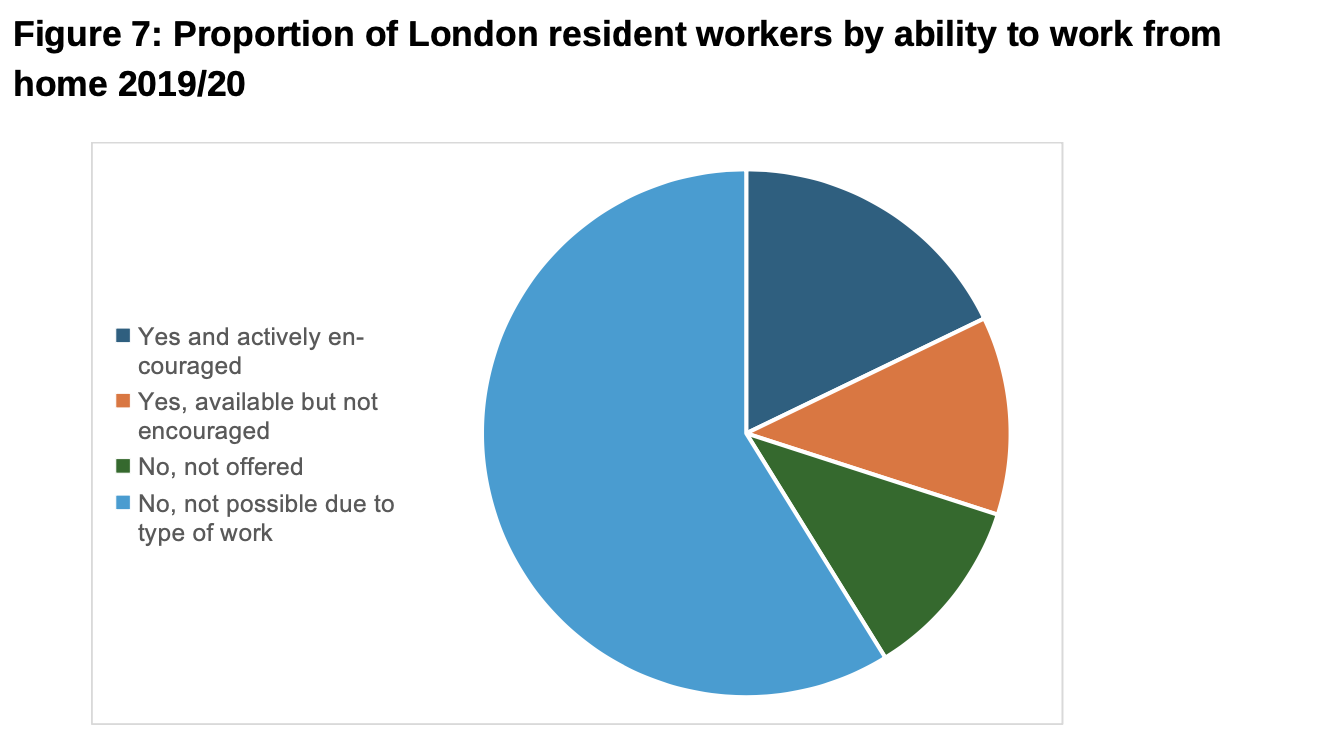
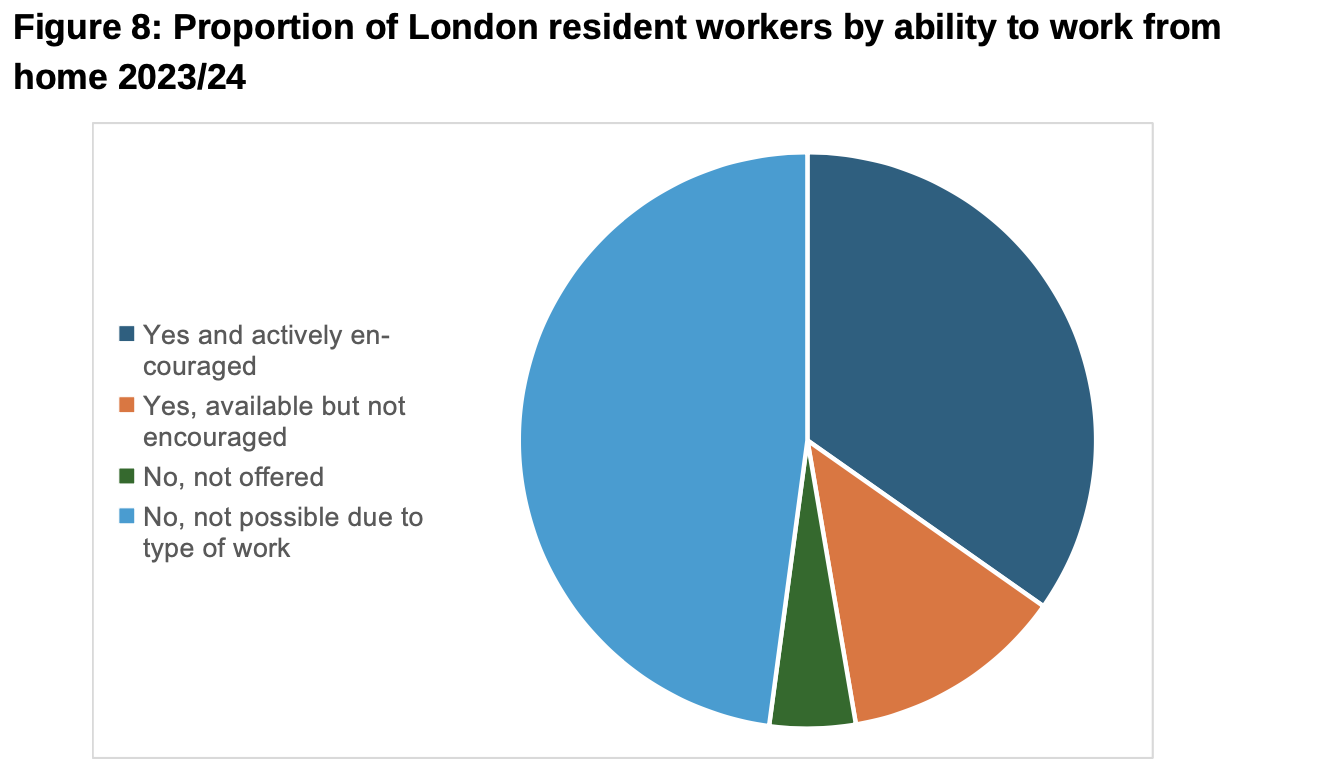
The changing attitudes to working from home are highlighted in figures 7 and 8 which show whether London residents can work from home or not. Pre-pandemic, figure 7, the majority of workers stated their job did not allow them to work from home and only 18% were able and encouraged to do so. By 2023/24 that proportion had doubled and the majority of jobs could, if allowed, now be done from home.
Source: https://tfl.gov.uk/corporate/publications-and-reports/travel-in-london-reports
Source: https://tfl.gov.uk/corporate/publications-and-reports/travel-in-london-reports
The pandemic has also significantly impacted the number of cycling trips in London. Figure 9 shows the change in the number of cycling stages from 2015 to 2024 by central, inner and outer London. Between 2015 and 2019 the numbers were static and even slightly declining in central and outer London. However, continuing investment in cycle infrastructure and the impact of the pandemic has led to a marked increase in cycling in all areas, up in 2024 by between 17% and 28% over 2015 levels depending on area.
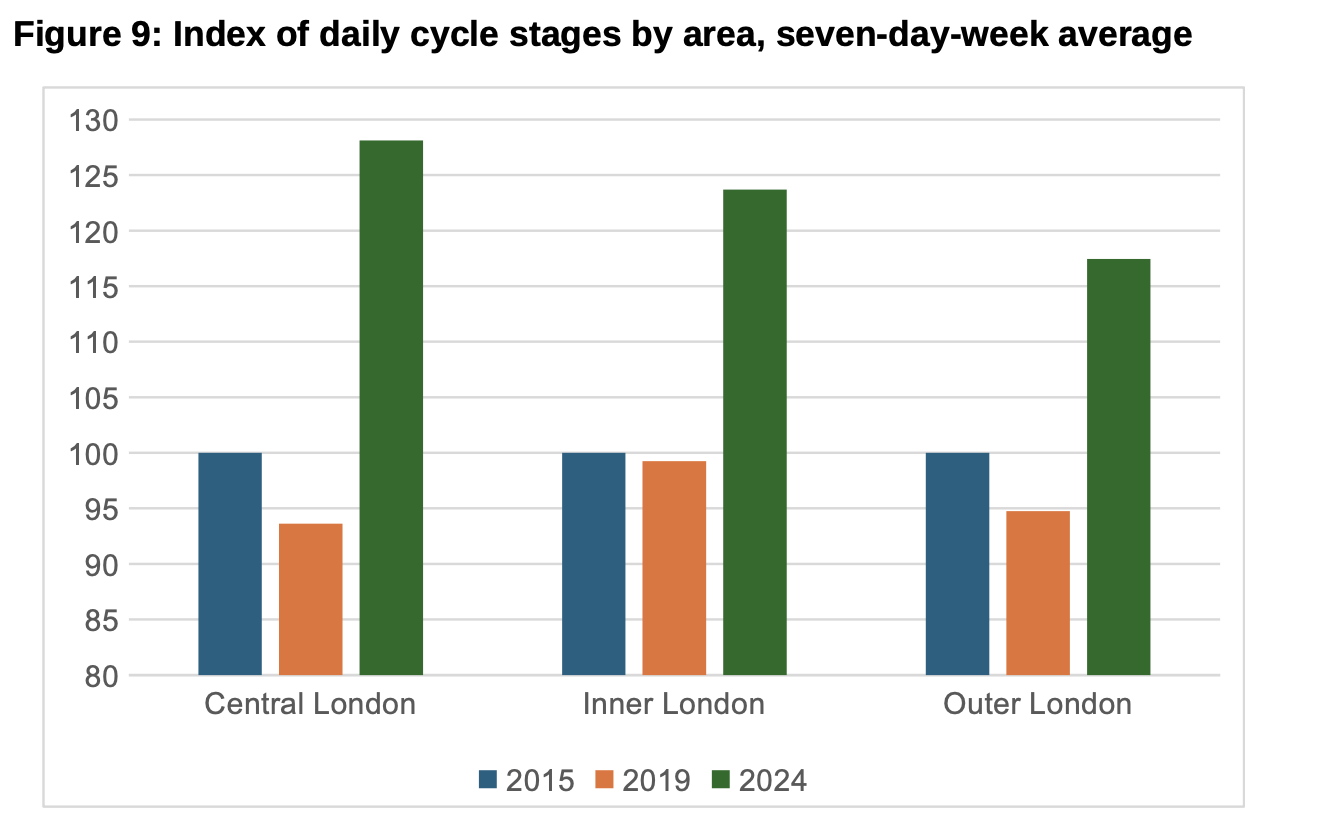
Source: https://tfl.gov.uk/corporate/publications-and-reports/travel-in-london-reports
Finally, thanks to the evolution of London’s Ultra Low Emission Zone, central London has shown how policy can drive technological change. Figure 10 shows the proportion of car kilometres, by engine technology, over the period 2019-2024. It highlights the slow but steady transition from diesel to electric or hybrid electric vehicles, which now account for over a quarter of car kilometres. This is around seven percentage points higher than in outer London, which nonetheless in turn is higher than the rest of the country.
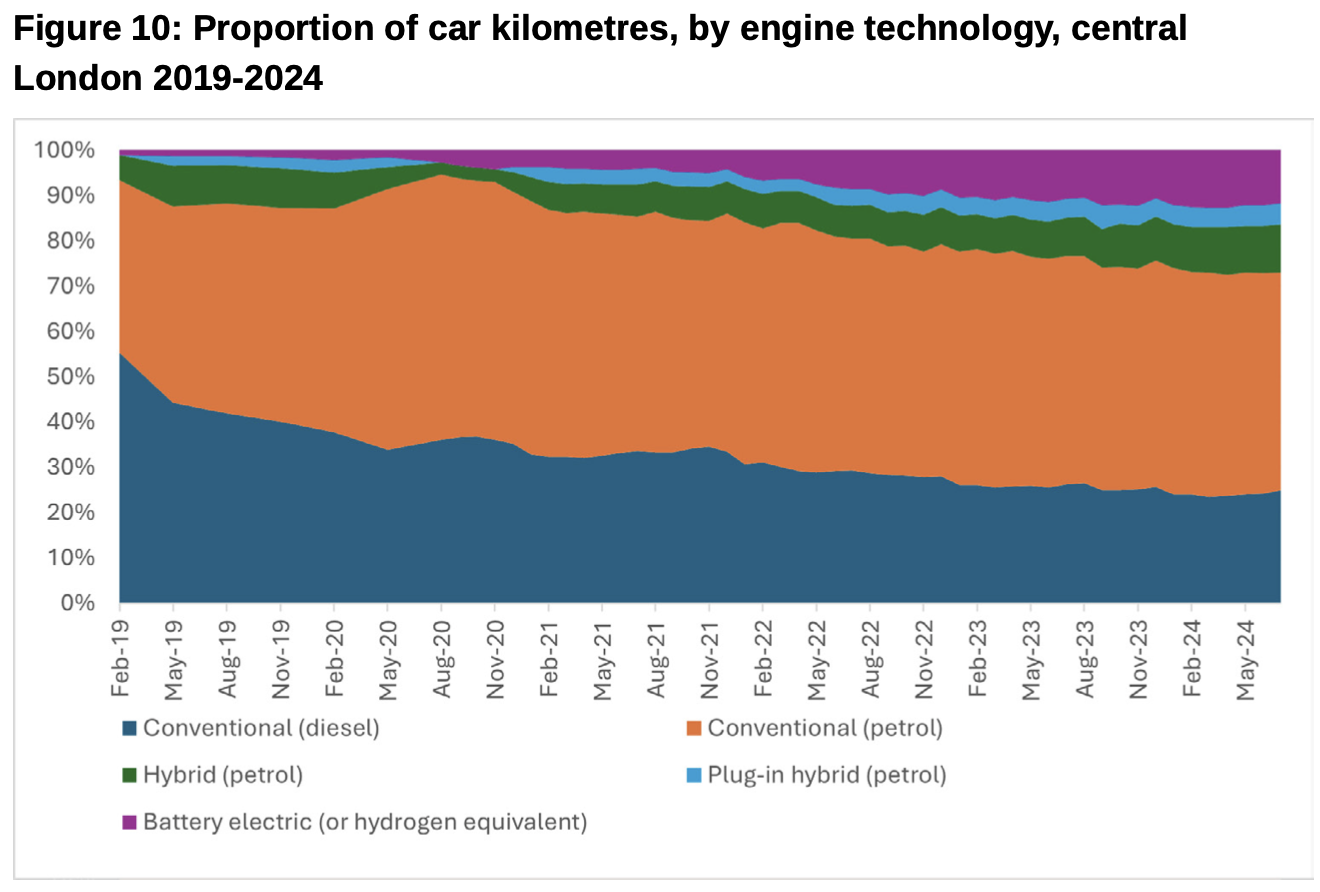
Source: https://tfl.gov.uk/corporate/publications-and-reports/travel-in-london-reports
Both reports highlight the changes we have seen in transport over the last few decades and the extent the pandemic has disrupted some previous long-term trends. There has been a decoupling of transport growth from economic and population growth – the economy is becoming less transport intensive. We have seen a steady growth in the use of more sustainable modes of transport, and significant reduction in transport’s negative environmental impacts. However, there remains a long way to go to decarbonise transport and restore some of the positive pre-pandemic trends in relation to sustainable travel, particularly the use of public transport.
References and Links
The data reviewed in this article and charts can be found at:
-
https://www.gov.uk/government/statistics/transport-statistics-great-britain-2024
-
https://tfl.gov.uk/corporate/publications-and-reports/travel-in-london-reports
John Siraut is director of economics at Jacobs.
This article was first published in LTT magazine, LTT908, 3 February 2025.
You are currently viewing this page as TAPAS Taster user.
To read and make comments on this article you need to register for free as TAPAS Select user and log in.
Log in