TAPAS.network | 20 February 2024 | Commentary | John Siraut
Parking revenues and Local Authorities – taking a closer look at the numbers. Westminster, Kensington & Chelsea and Brighton top the lists

Council parking charges hit the headlines from time to time, but what is the true story of the amounts of income the local authorities receive, and their contribution to local transport expenditures? has examined the latest figures and finds a few big income numbers, but that for many areas parking management and enforcement is a policy, rather than revenue activity.
A RECENT BBC news item on York City Council charging up to £20 for all day parking at some of its city centre car parks seemed to highlight the significance of parking revenues to some councils in these cash strapped times. As often, the underlying belief seems to be that charging for parking is a nice little earner for local authorities, but is that the rule, or the exception?
The latest Department for Levelling Up, Housing & Communities (DLUHC) local government finance returns (Revenue Outturn 2022-23: Highways and Transport Services (RO2) data) sheds some welcome light on the subject, and highlight the very limited number of councils for whom parking is a substantial source of revenue.
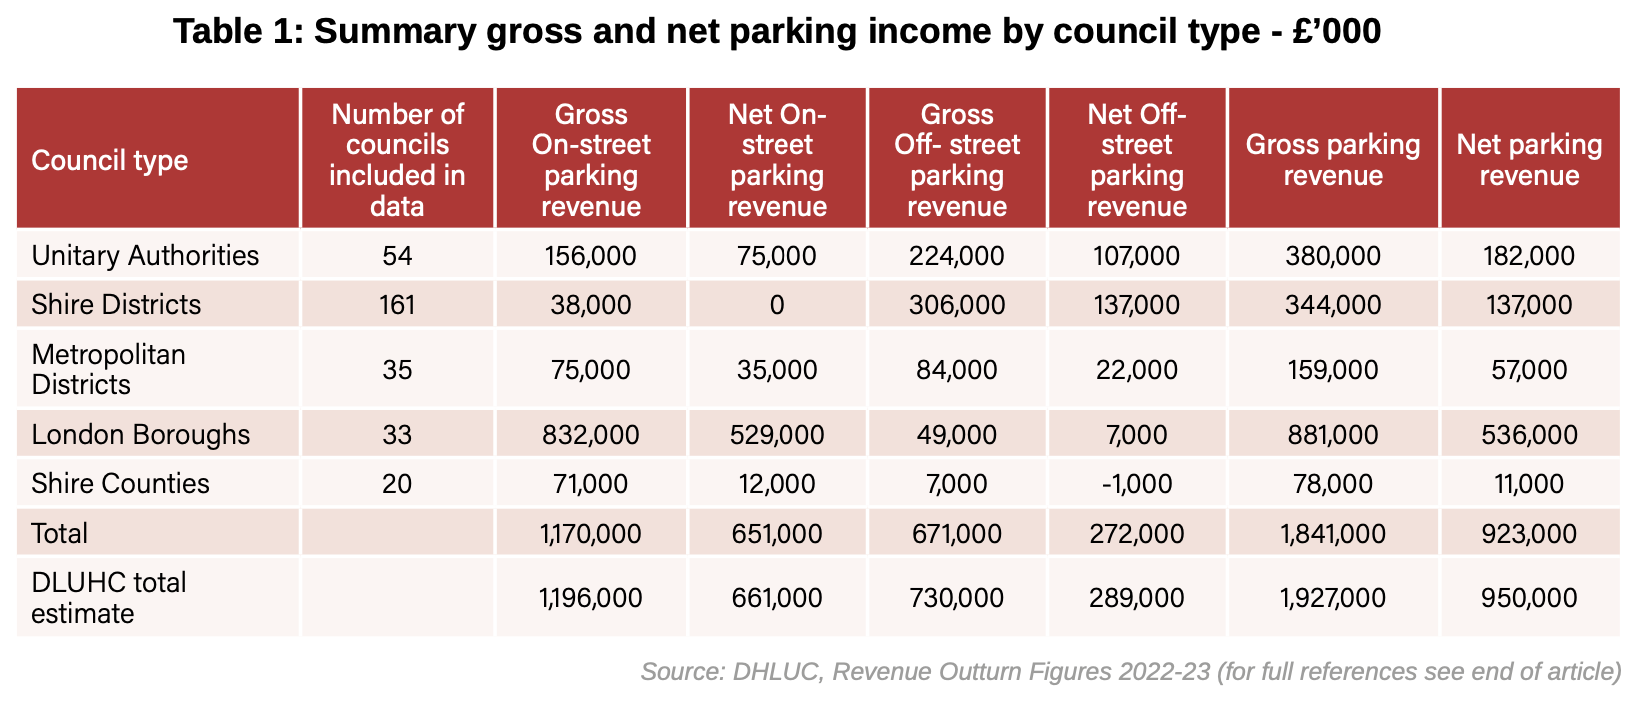
Table 1 provides a high-level summary of total gross and net income for on-street, off-street and total parking revenues by council type. The table shows the totals for those councils that we have such data for. DLUHC, in its totals, also estimates revenue from those councils for whom returns are not available and this is shown separately.
Looking at Kensington & Chelsea’s own annual parking report, it would seem that the reported parking revenue to DLUHC covers: parking charges, residents’ permits, parking suspension income, and Penalty Charge Notice (PCN) income.
Using the DHLUC figures shows that in total, councils achieved gross revenues of nearly £2bn from these sources, and net revenues of nearly £1bn after the costs of parking management and enforcement are taken into consideration. These figures do not, however, take account of capital expenditures or depreciation, so are arguably significant over estimates of the true state of net parking income. Alongside this, over half of that net income accrues to London Boroughs, and the average level of net income across the other council types comes to just over £3m for Unitary Authorities, and under £2m for Metropolitan Districts.
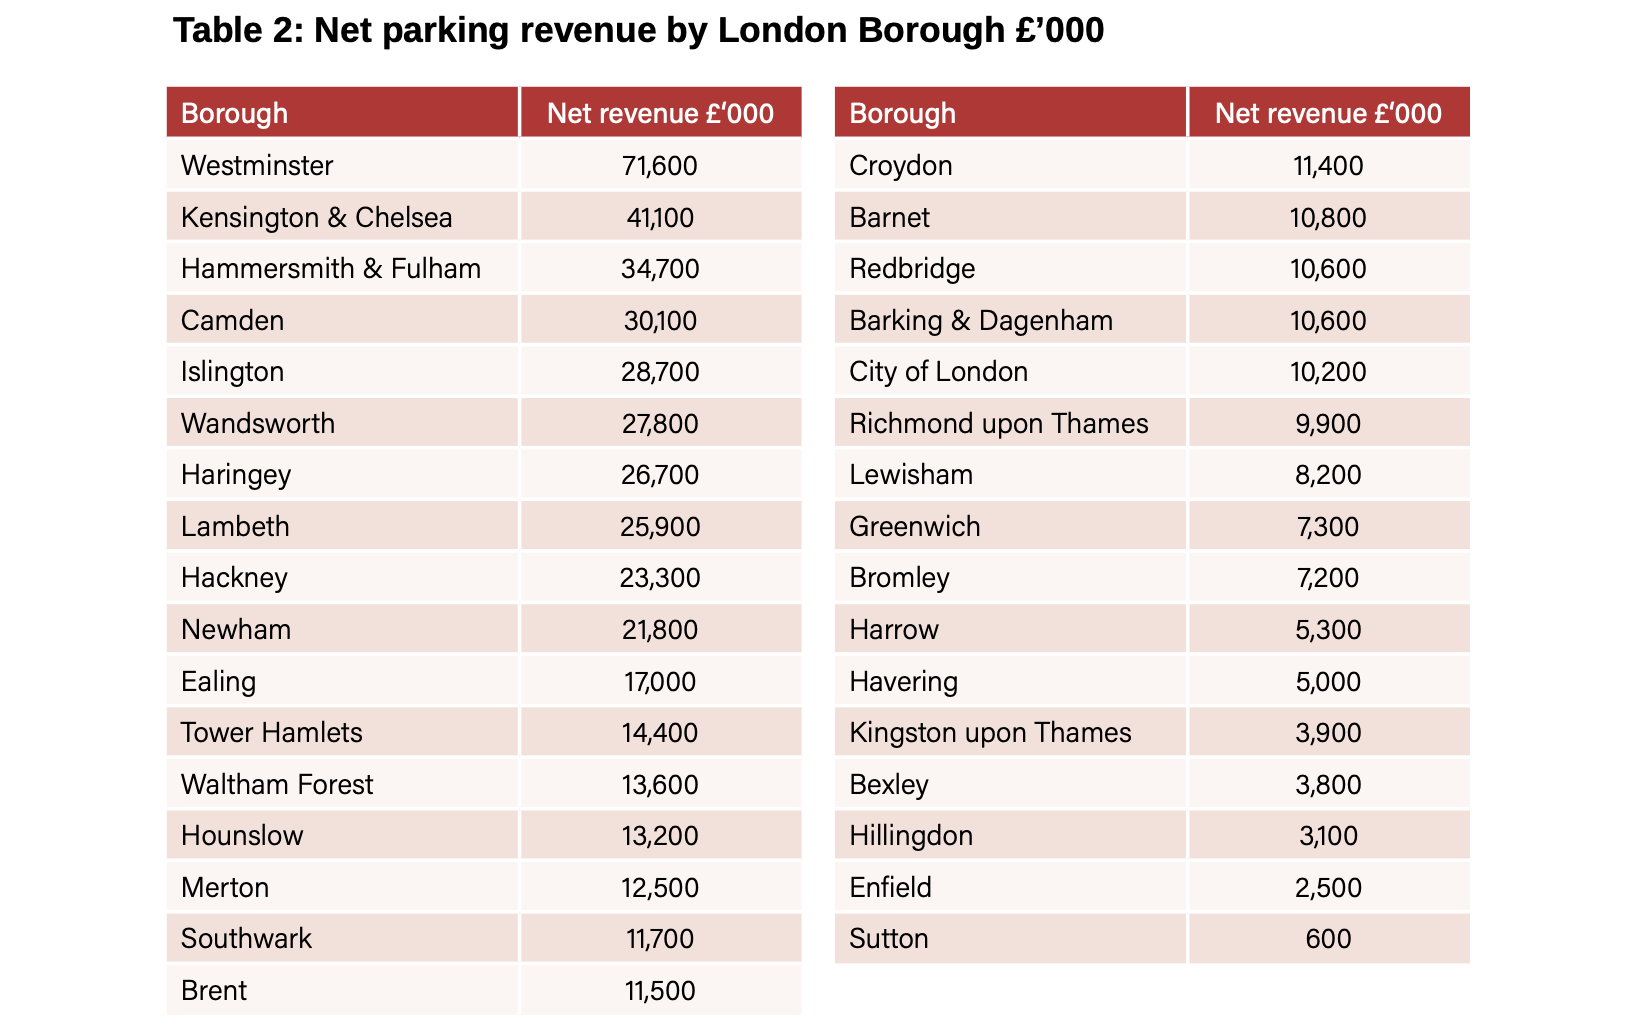
In London, Westminster City Council grosses over £100m from on-street parking - or nearly 10% of total on-street parking revenue for the whole of England. The next highest revenue earners; Kensington & Chelsea, Hammersmith & Fulham, and Lambeth, each bring in only half the Westminster amount, and eight London Boroughs gross less than £10m.
So, even in London there are large differences in revenues between councils. London is also unusual in that its on-street revenues are over 16 times off-street revenues. Table 2 shows net total on-street and off-street revenues by London Borough. Reinforcing its dominance, it’s worth noting that Westminster earned more than the 12 Boroughs at the bottom of the table all added together.
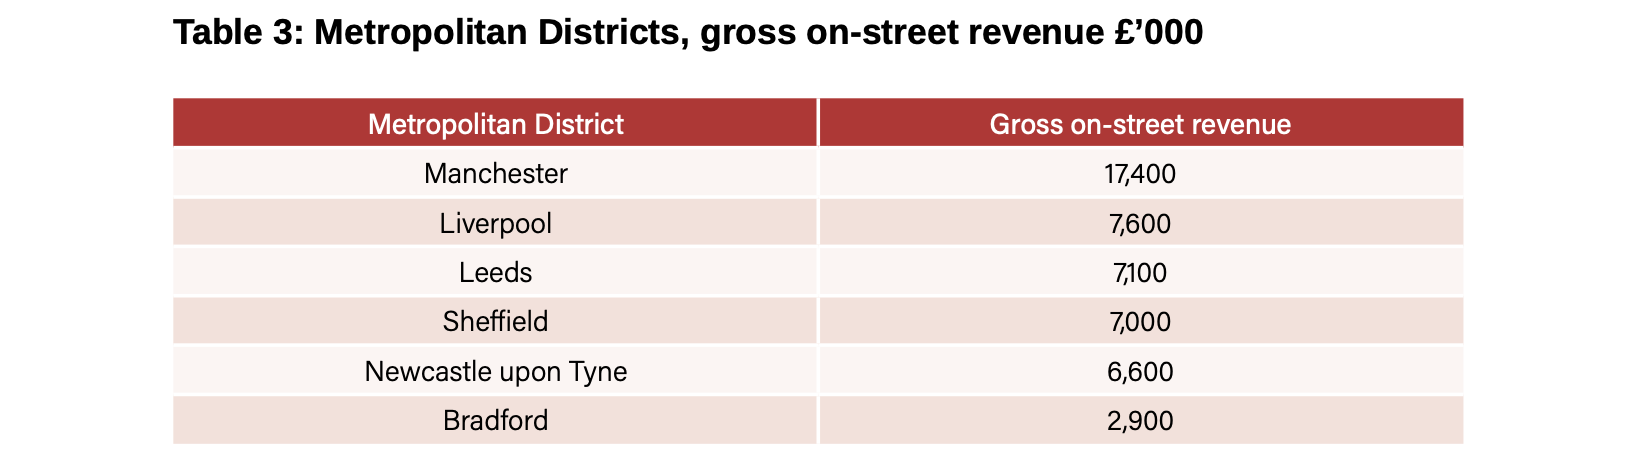
Outside London a very different picture emerges. Of the 35 Metropolitan districts we have data for, five appeared to have lost money on their parking operations. Sixteen netted less than £1m while Manchester, with net earnings of £13m and Newcastle with nearly £10m, are the only two major earners. Local authorities will usually have competition from private sector off-street operators, as it is only with on-street parking where they have a monopoly. Manchester’s gross on-street revenue is considerably higher than for Liverpool or Leeds suggesting a tighter supply of parking in the former, and / or perhaps a more vibrant economy that can support higher charges.
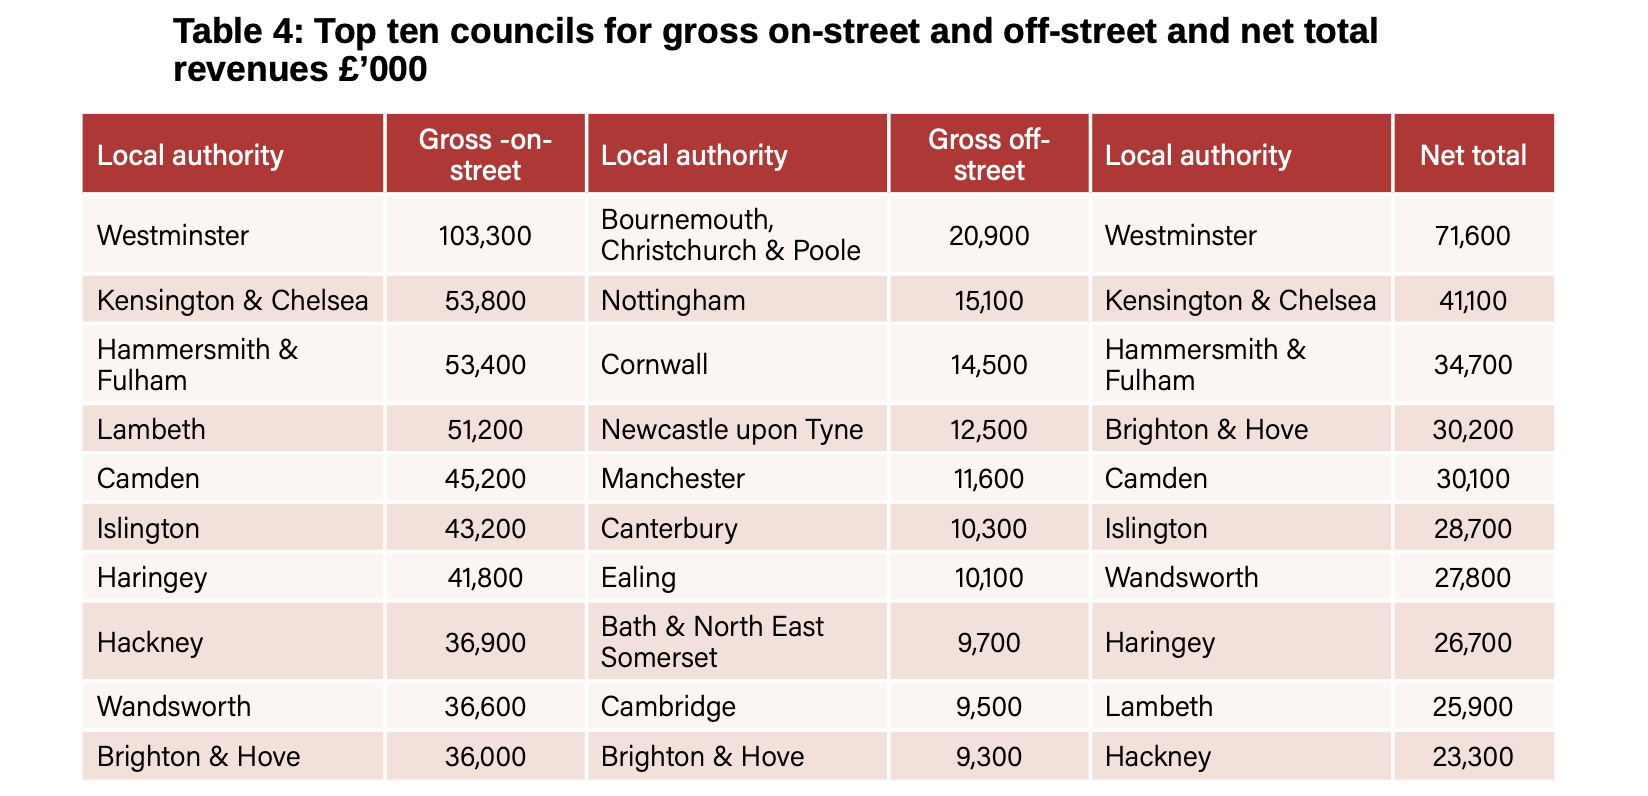
Amongst the high earning Unitary authorities, Brighton grosses a substantial £36m, which would put it third in the London Borough list, followed a long way behind by Bristol on £12m and Milton Keynes on £10m. Bournemouth, Christchurch & Poole (£21m), Nottingham (£15m) and Cornwall (£14m) were the biggest gross earning unitaries when it came to off-street parking. In terms of total net parking revenues, Brighton made £30m, Nottingham £15m, Bournemouth, Christchurch & Poole £13m and Bristol £11m. For the second tier Shire Districts where parking responsibility lies and there are figures reported, the big numbers were with, Canterbury, Cambridge and Exeter, who all netted over £5m. At the other end of the scale, of those we have data for, 29 councils reported a combined loss on their total parking operations of almost £4.4m.
Taking all the local authorities together, the on-street market is dominated by London Boroughs, with Brighton, the only outsider amongst the top ten gross revenue takers, (Table 4.) On the other hand, only one London Borough features amongst the top ten off-street revenue earners, which consist of a mixture of cities, counties and tourist destination areas. When it comes to net revenues, few councils earn more than £20m and Brighton again is the only non-London borough to feature in the top ten. As for York, the subject of that BBC story, parking revenue netted £7m in 2022-23.
Under the legislation that permits the charges, on-street parking net revenue has to be spent on other transport- related activities funded by the relevant council. This may include the provision of electric vehicle charging points and concessionary fares. It is not all positive financially, however, as it’s also worth noting that fifty councils lost nearly £12m in total on their parking operations. Those critics who claim that charges are just a cash cow might remember too that managing parking is not a guaranteed profit- maker for hard pressed councils. Setting charges meanwhile plays other important roles in transport policy too, often being a valuable tool to achieve wider policy objectives such as dealing with congestion, prioritising roadspace and kerbside allocation, managing the limited resource of parking in residential areas, cutting emissions and supporting the transition to net zero, whilst improving mobility overall and meeting placemaking and environmental goals.
Looking at it another way too, to put some of these parking revenue figures into context, the four largest UK airports grossed £570m in parking revenues according to their latest annual accounts, while National Car Parks, the largest private sector car park operator, with more than 200,000 parking spaces in over 800 sites, grossed over £170m. These days NCP is now a management company - its freeholds were sold off and its portfolio is mainly leases.
A final fact. For local authorities alone, the gross revenue parking figures equate to collecting average parking charges of around £60 a year for every car and van registered in England.
Reference
All data is from Department for Levelling Up, Housing & Communities, Revenue Outturn 2022-23: Highways and Transport Services (RO2).
John Siraut is director of economics at Jacobs.
This article was first published in LTTmagazine, LTT886, 20 February 2024.
You are currently viewing this page as TAPAS Taster user.
To read and make comments on this article you need to register for free as TAPAS Select user and log in.
Log in