TAPAS.network | 17 October 2022 | Commentary | Kris Beuret
Confronting Transport-Related Social Exclusion: refining the Methodology and addressing the Challenges

Poor quality transport links to vital services and facilities is seriously damaging people’s lives says . Yet the concept of Transport Related Social Exclusion is still poorly understood, she believes, both in terms of how that disadvantage is measured, and identifying where it occurs. A new piece of work that Beuret and colleagues have just completed for Transport for the North offers some important insights, but raises some difficult questions, as she argues here.
THE RELATIONSHIP between the availability of transport connectivity to individuals, and the extent of social deprivation they suffer, has only been explored relatively poorly – despite the real importance of the issue. It is therefore very pleasing that Transport for the North (TfN) was willing to recently commission research into Transport Related Social Exclusion (TRSE) in the North of England, a project undertaken by the author and colleagues.
The work involved a comprehensive study based on over 3,000 interviews, innovative geo-social data analysis, and in-depth qualitative research carried out by Social Research Associates (SRA) and partners Temple. It found that one in five people in the North experience major problems in their lives due to transport poverty. The response to the report resonates with a consensus that more funding is needed to reduce such exclusion. The situation is not straightforward, however, with a range of ingredients and complex cross-relationships between them occurring, and this article highlights just six of the many aspects which need continuing data and debate.
1 - How to measure TRSE
Social norms inevitably play a part in any assumptions about the assessment of levels of access to the wide range of facilities, services and opportunities that people require in their lives. Are some facilities more important than others? What is acceptable accessibility for different facilities – 15 minutes? 30? 45? What is the role of personal lifestyle and location choices – some of which are shaped and limited by property prices or social housing provision.
So the way we measure TRSE significantly affects the result. This issue reinforces the importance of three key features:
-
benchmarking and collecting consistent comparative data;
-
clarity on the data points used, how the measures are calculated and what assumptions have been made;
-
the use of qualitative ‘real life’ feedback to understand what TRSE actually means for individuals in different situations.
These are investigated further in the new TfN report which draws on a programme of evidence based mixed-methods research undertaken by SRA and Temple and built upon by TfN’s own analysis to develop a tool to measure the risk of TRSE. This tool measures accessibility to four key activities – employment, education, health, and basic services (bank, post office, pharmacy and a job centre) – and combines these with indices of deprivation (vulnerability score) to produce TRSE risk categories, ranked from 1 (low TRSE) to 5 (high TRSE). See Table 1, below.
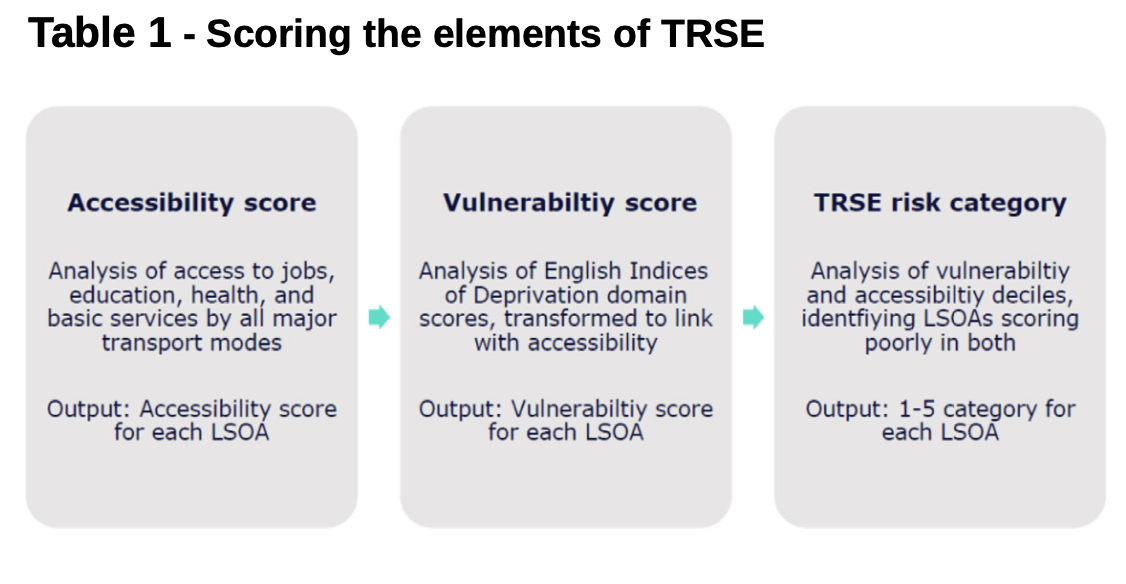
The ‘Accessibility Score’ used looks at DfT journey time statistics to examine the relative and absolute level of access to the four destination types, setting this alongside public transport and car ownership levels. The ‘Vulnerability Score’ measures the vulnerability of the population to social exclusion in this context, using the 2019 English Indices of Multiple Deprivation (IMD) including income, employment, education, health, crime and the available outdoors living environment.
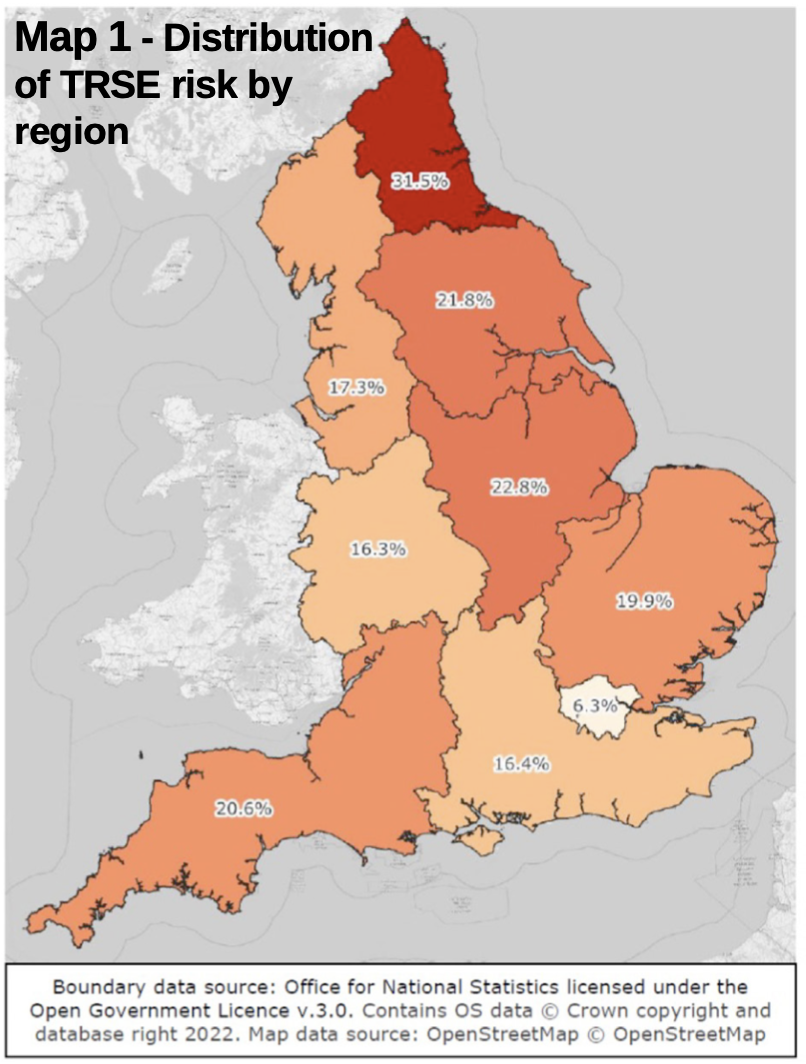
On this basis, 3.3 million people in the North (21.3%) live in areas in which there is a high risk of TRSE, and around 800,000 people in areas with the very highest risk of TRSE. In this distribution, the North East can be seen to be experiencing the most TRSE suffering in comparison with other regions in the North, and the rest of the country (see Map 1).
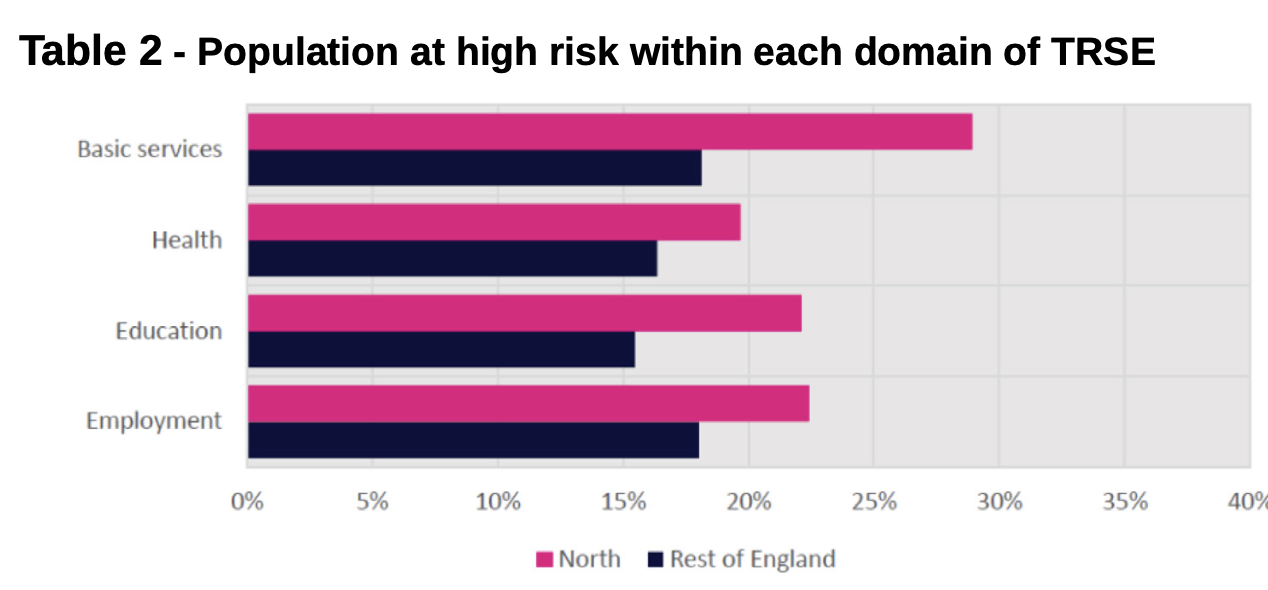
There are significant differences between the North and the rest of England in all the four domains of TRSE. For example, 28.9% of people in the North live in areas with a ‘Basic Services’ domain score of 3 or higher, compared with 18.1% in the rest of England, with significant differences too in the health, education, and employment domains (see Table 2).
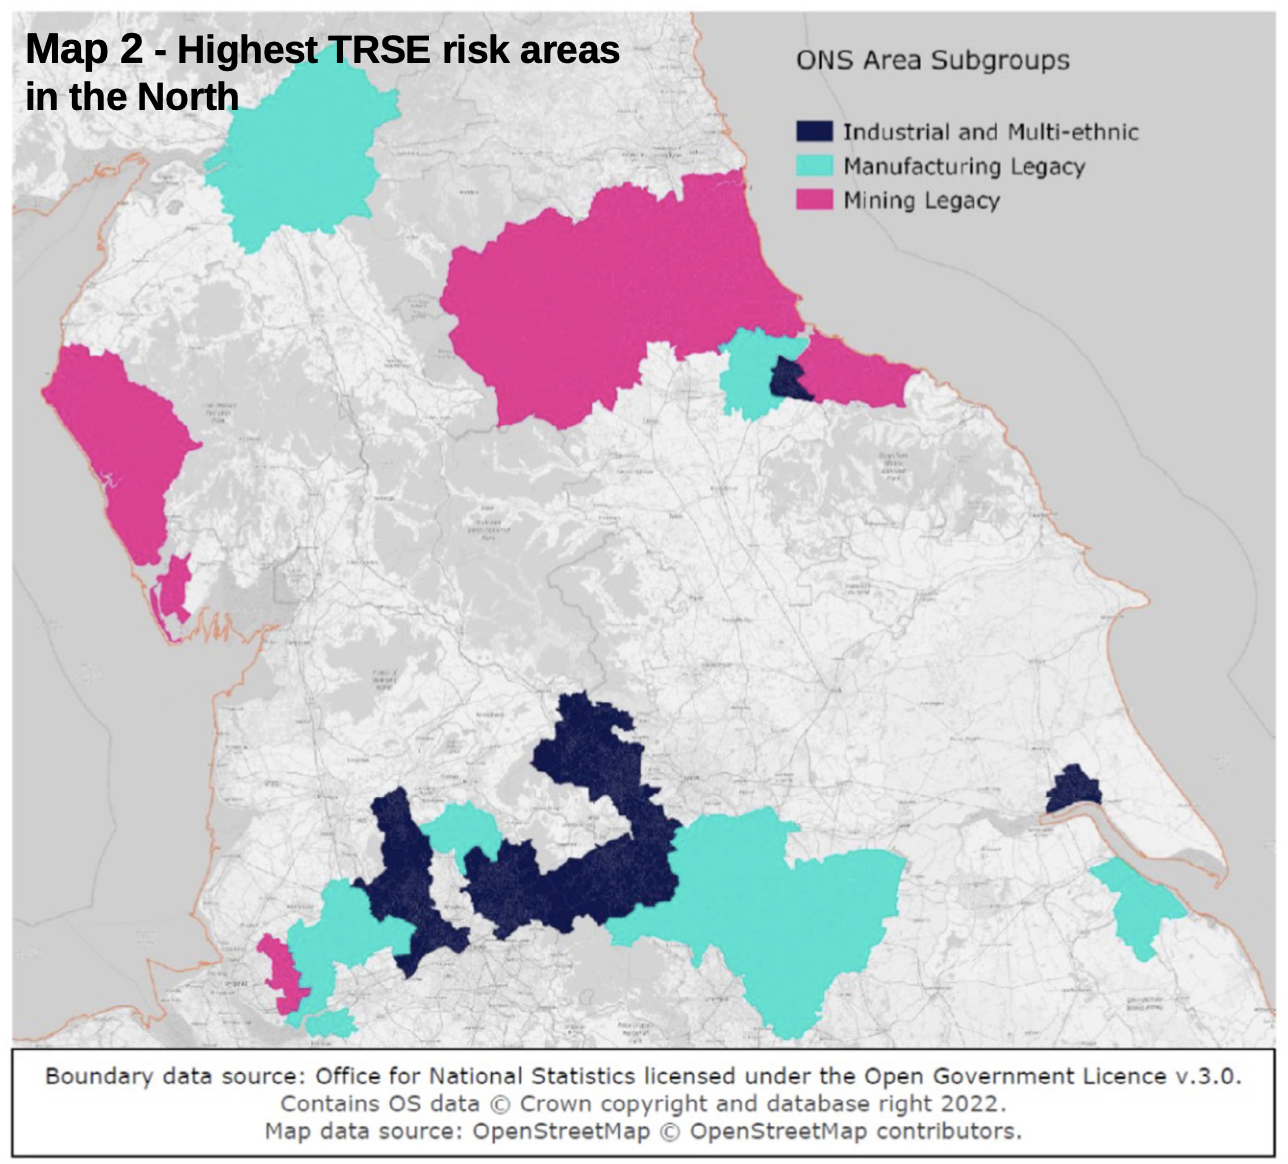
Our work highlights differences between rural and urban places and population contexts as defined using the ONS Area Subgroups. Three area categories – Manufacturing Legacy, Mining Legacy, and Industrial and Multi-Ethnic – contain 54% of the population of the North at a high risk of TRSE, including 58% of the population in the highest risk category (see Map 2).
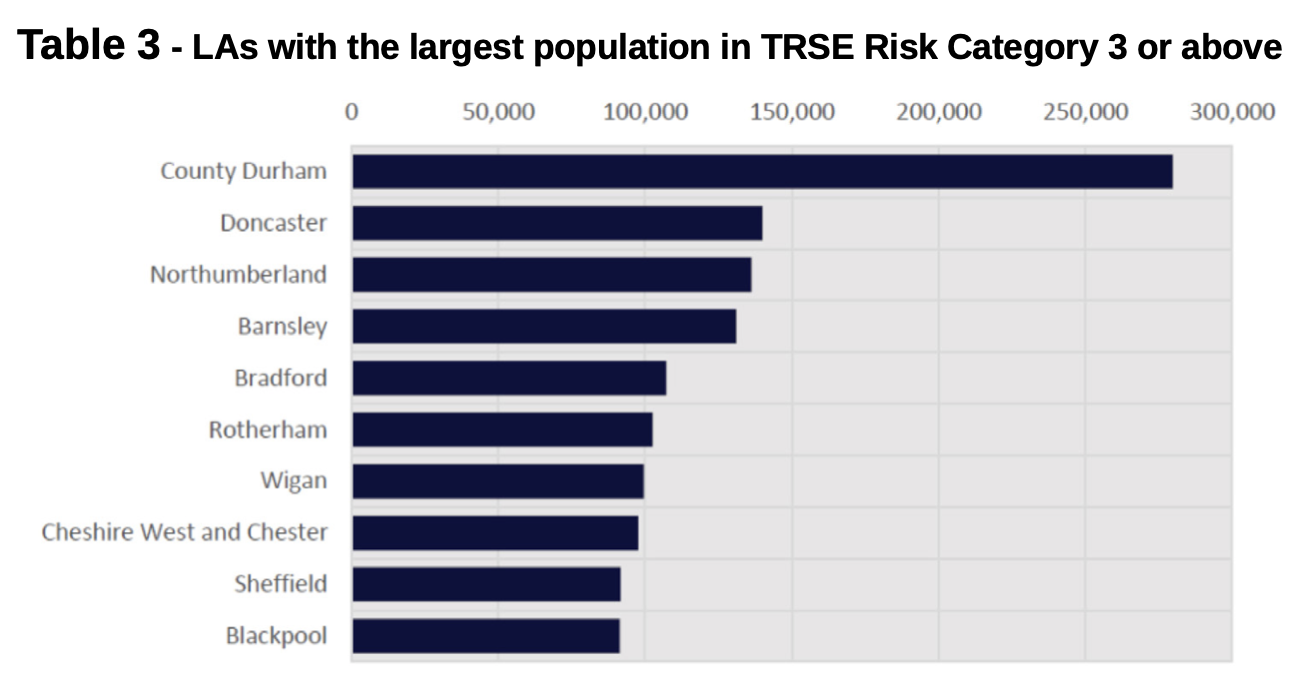
Ten Local Authorities collectively account for 39% of the population of the North in the highest risk categories. In County Durham, 280,000 live in areas with a high risk of TRSE – 8.5% of the total for the North (see Table 3).
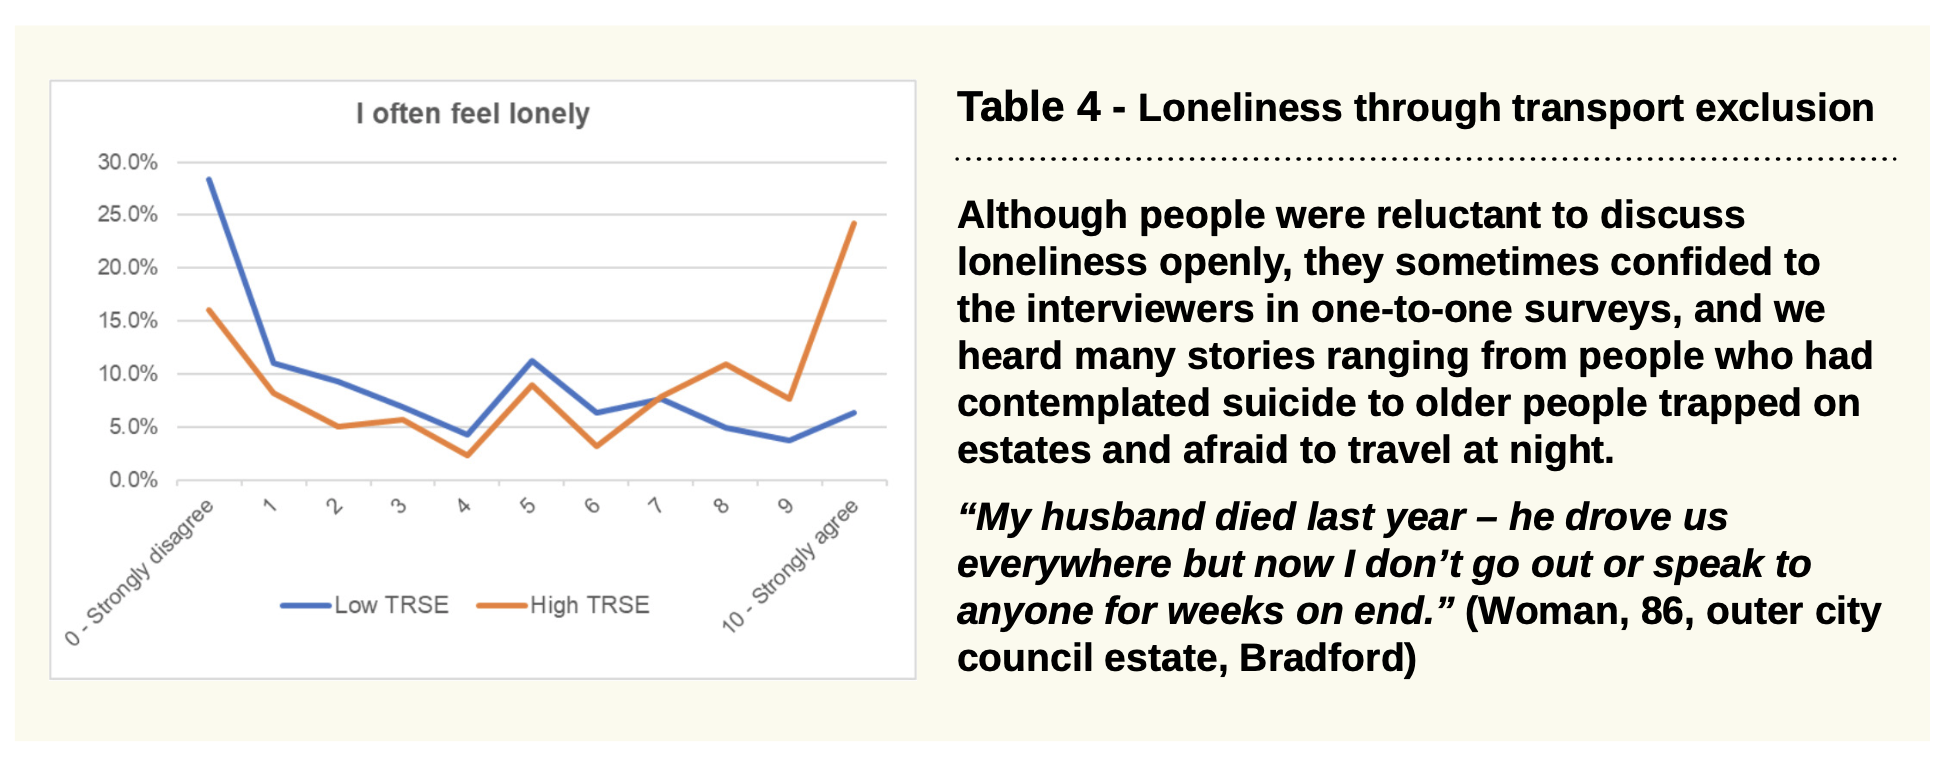
In order to understand the real-life experiences of TRSE we undertook a wide-ranging programme of research in areas identified at being of high risk of TRSE including in depth social research in communities pinpointed by the geo-social database. It became evident that TRSE costs the public sector and wider economy a lot of money in terms of lack of access to health care, restricted educational choice and jobs. The fact that the highest rates of both TRSE and life expectancy are in the North East cannot be a coincidence. Yet inability to reach employment is often unrecorded in impact assessments and modelling. If the stated Government objective of ‘Levelling Up’ is to be achieved, investment in human capital and reducing the burden on the exchequer of inter-generational deprivation surely needs to be built into cost-benefit analyses and business cases. The DfT investment appraisal tools in WebTAG provides a framework for modelling distributional impact and inclusion but the application seems low and far outweighed by calculations of time savings, in particular, the huge impact of TRSE on mental illness and loneliness is rarely included in assessments (see Table 4).
Clearly there is a need for further discussions about how transport professionals can build these complex and subtle measures of TRSE into policy and business cases.
2 - The detrimental link between carbon reduction policies and TRSE
Local authorities are being charged with producing new Local Transport Plans including measures to achieve carbon reduction targets. Table 5 illustrates a typical authority’s hierarchy of priorities being built into such strategies.

Engagement with local people around the message of this diagram too often elicits a response around their buying or planning to buy an electric car, an action seen as obviating the need for any major changes to lifestyle. Leaving aside that electric cars do impose environmental burdens, for TRSE groups in the North and elsewhere such access to electric cars is unlikely to be an option, given the costs, yet for many of these people continued car use is essential as an access enabler.
Our surveys meanwhile revealed that people often needed to access non-radial routes for employment, and it was also clear that this requirement constrained educational opportunities. For women reporting more primary caring responsibilities over children and elderly relatives, getting around the peripheries of urban areas poorly served by public transport was a keenly felt problem.
Access to cars is also not always structured as conventional surveys imply. We found that cars were often shared around amongst families or even neighbours. This led to prioritising car ownership instead of other costs including food and energy and, for some, levels of poverty triggered decisions to cut corners, in turn leading to prosecution for lack of insurance or MOT, and the consequent exacerbation of travel problems.
Here are some typical quotes:
“There were jobs going at the business park, but no bus for the early shift and the manager said it wasn’t up to him to deal with that. In the end, six of us got there in my mate’s old banger with me in the boot!” (Male, 42, Gateshead)
“My job is one way, and the school the other way, with no bus route to either. Before Covid my mum used to collect the kids, but now she doesn’t go out so after furlough I jacked my job in.” (Female, 35, Bradford)
“I lost my licence last year and I’m still driving in emergencies – can’t afford a taxi and there’s no bus I can get to the AA meeting.” (Male, Gateshead)
In this context we should consider whether some of the carbon reduction proposals, such as higher taxation, car parking costs and congestion and ULEZ charging, could have a disproportionately negative impact on many of the TRSE groups who rely on old cars, including reducing access to employment, education and better food shops. Yet TRSE groups often also suffer disproportionately from poor air quality, so the issue is complex and points to the need for more holistic policy making.
3 - Digital and banking exclusion and the transport implications
Digital exclusion is another important consideration that affects TRSE. Analysis of life-cycle factors highlighted both young and older people experiencing digital exclusion, along with many people with disabilities, as local ‘bricks and mortar’ facilities are increasingly withdrawn. People in rural areas, not surprisingly, also particularly suffer poor provision. Such TRSE is often compounded with other factors, such as low literacy and other skills, with low incomes a consequence, as well as a cause.
This concern was abundantly evident in the literature review we undertook in connection with our study, and something expressed repeatedly in the stakeholder interviews in relation to the increasing number of essential life services which are moving more online. These include banking, universal credit and job applications, with access to transport - especially public transport - following the same trend of expecting users to access the product online.
There also remains low awareness of the impact of digital exclusion among important stakeholders, with erroneous assumptions in thinking:
“We provide free access to Wi-Fi at all our stations and increasingly on our buses. People quickly realise the advantages of tapping in and getting real time information.” (Area Manager, Transport Operating Company)
In contrast, our interviewees made clear that, for them, lack of access to digital information was a huge problem, and there were clear impacts such as paying more for travel or being unable to access information about disruption.
“A one-year rail card costs more per year than a three year one, but you can only get that online.” (Female, 70, Stockport)
Even those who had smart phones often could not do more than use them to make phone calls. Some older people are afraid to use phones at a bus stop, as well as having more practical concerns:
“So I’ve my shopping, and my handbag, and I’ve to get my phone out and find my reading glasses, meanwhile holding my bus pass. I’ll miss the bloomin’ bus when it does come!” (Woman, 80s, Bolton)
People called for more real time information provision at bus stops, printed timetables, and for more staff presence.
Perhaps we need to more carefully consider if new transport developments, such as Demand Responsive Transport and Mobility as a Service, which rely on online connectivity and communication, will lead to further TRSE for some groups?
4 - How problems for travel on foot contribute to exclusion
That walking obstacles cause exclusion should not be surprising, since people in TRSE groups make more trips by walking and walk more often in their local area.
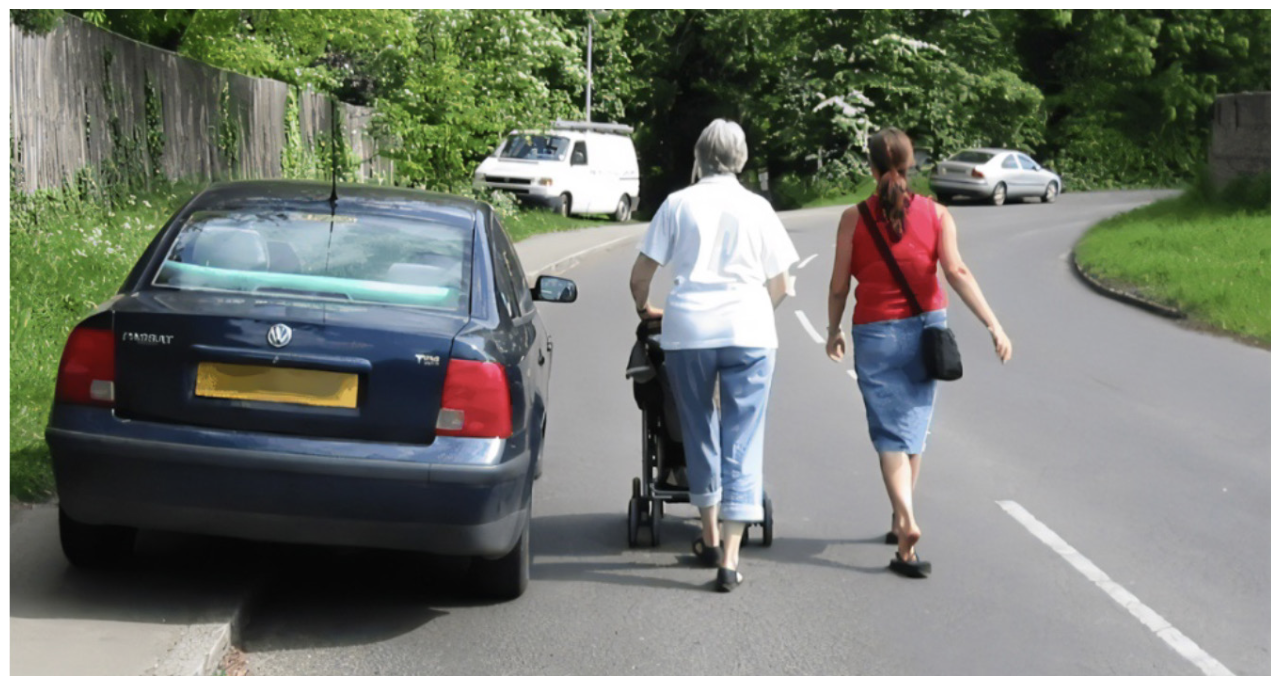
Problems included pavement parking, severance due to main roads, and poor crossing provision. This was a particular challenge for disabled people, for children, people with buggies and shoppers.
“I had to squeeze past a van on the pavement and the wheels of my buggy fell off the kerb with all the shopping and the baby falling over in the road” (Woman, 30, Bradford)
The impact of lack of crossings, not enough time at the crossing, and crossings being in the wrong place was also described, including difficulties in getting to bus stops and stations in time for the services.
“I often miss the bus trying to get across to the bus stop.” (Teenager, female, Bradford)
“I never go over to the shops on the other side – it’s too dangerous to cross the main road.” (Woman, 59, Stockport)
“Suddenly the path was blocked, and I was supposed to go in the road, and to add insult to injury they had a sign up saying they were considerate!” (Woman, 56, Northumberland)
Concern about security was also a deterrent to walking, especially in perimeter estates, and many people had a self-imposed curfew.
“We used to go to the Club on a Friday, but now there’s joy riders and gangs all over – some of the street lights are out and it’s not safe anymore.” (Couple, 60’s, Northumberland)
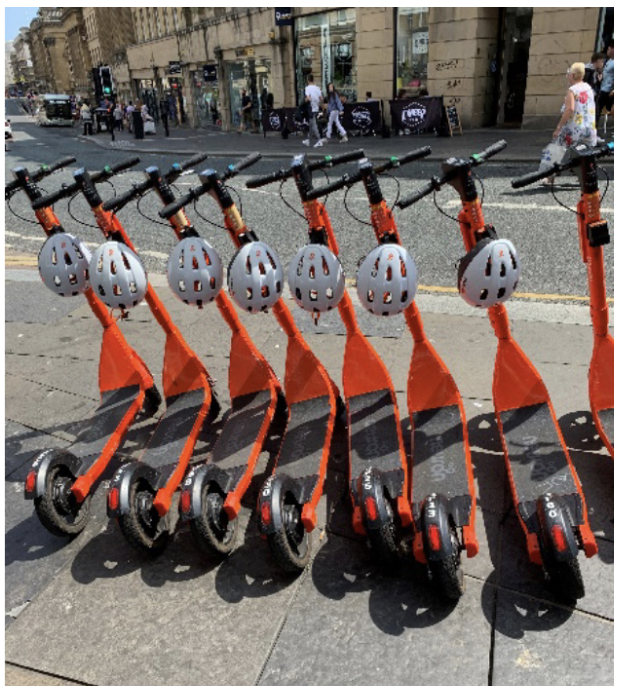
Another big issue related to the shared use of walking spaces with scooters and cyclists.
“With more and more of these electric scooters about, I’m terrified – they think I can hear them shouting out to move over.” (Male, 82, Bradford)
“The pavement used to be for pedestrians – no longer. You can’t go for a peaceful walk any more – old people don’t feel comfortable.” (Woman, 73, Sheffield)
“I always meet the children from school now – it’s too dangerous with all the cyclists and scooters – you can’t just say ‘stay on the pavement’ anymore.” (Woman, 38, Bradford)
“Abolish shared routes, including the new threat of electric scooters.” (Focus Group, Sheffield)
Given the significance to those at risk of TRSE, it would clearly be beneficial to them if we really put pedestrians at the foundation of transport policy, in the same way that walking is now being shown as the pinnacle of mode choice.
Those dependent on walking often lose out to inappropriate use of pavements by motorists, whereas new mobility options are less likely to be available in areas suffering from social exclusion
5 - Young and old are especially susceptible to TRSE
The demographics of those affected by Transport Related Social Exclusion differ from what are often seen as the traditional ‘equality groups’ in need of support. For example, among those most affected by TRSE are middle-aged unemployed men. However, age is also a factor in the higher levels of TRSE experienced for both younger and older groups.
Young people self-reported a high level of perceived TRSE, with under 19-year-olds giving the highest of all ratings.
Reasons for TRSE in this age group are high transport costs and the poor availability of public transport, which hits young people disproportionately, especially because they are less likely to be able to drive. A particular difficulty arises in their ability to afford public transport at the transition from school age to employment or higher education post 16- 18, when fares increase to adult levels and concessions, where available, vary between different areas and bus companies.
These situations can bring adverse effects on access to education and training options, constrain the ability to participate in out of hours activities, impact on physical activity and mental wellbeing, and undermine independence and self-worth. They can also bring loneliness, restrict the ability and willingness to use transport options, and inhibit access to employment opportunities, stress, fatigue and low self-esteem were also all consequences described by interviewees.
“I can’t stay on for the after-school clubs because I have to catch the school bus home.
It’s really affected my ability to get into university because they want to know all about these types of outside activities at your interview.” (Teenager, female, Cheshire)
“I wanted to go to a different school which was actually nearer, though over the county boundary, but I could only get school transport paid for from my own county.” (Teenager, male, Gateshead)
Driving licence requirements also limited young people’s ability to apply for jobs or apprenticeships, with restricted access to the means and resources required to obtain a licence a notable barrier.
“My brother could drive a lorry when he was 19, because he was trained by the army, but I can’t until I’m 21 even though I could get a job because they need drivers.” (Male, 20, Blyth)
“I’ve failed my theory test three times ...can’t afford it again.” (Male, 21, Cramlington)
For older people, a reduced capacity to drive with advancing years is a real problem, particularly for those in rural areas. Many admitted they found driving difficult but were terrified of the exclusion not driving would lead to. Many of this age group were more affluent, so could afford to drive, but some of their comments were nonetheless worrying.
“There aren’t any buses serving the village and it’s impossible to get a taxi – they’re all on school runs, so I carry on driving, but I know my eyesight isn’t good. Otherwise, we’d have to move and my whole life is here.” (Male 79, Northumberland)
“Thank goodness it’s not like some countries where you have driving tests over 70 – but I know the way to town, and I just about manage it with my wife telling me if the lights are red.”
Others were more conscientiously law abiding but found alternatives difficult especially in rural areas.
“We’re an elderly population here – only two people don’t drive – but we did try to set up an alternative – namely a new off-road footpath to the town, but unfortunately the landowner who owns the freehold on all houses in the village refused planning permission.” (Parish councillor)
Such comments perhaps raise the issue of whether there is a case for compulsory driver testing for older people, as well as of extending the work of the Mobility Advisory Centres, and measures to offer better alternatives.
What role for Transport Planning in addressing TRSE?
Transport professionals have long advocated ‘joined up thinking’ between planning and transport, but the practical record is poor. We are still building homes, and retail and employment centres, in places public transport cannot serve economically. The infrastructure we have ended up with is certainly a major factor in causing TRSE. So many of our interviewees, and the data analysis results, highlighted the problem of isolated low-income perimeter housing estates. Some developments were planned with bus services, but these were infrequent and often had not survived. As we look forward to a better designed built environment, and greater social equality, we must surely become more cognisant of the importance of understanding and avoiding transport-induced social exclusion. As I hope this article has demonstrated, it is a challenge to define and often easy to overlook. But I also hope that I have shown its existence is real, and consequences highly impactful for those it affects. Let’s make it a core part of our thinking as transport planners and perhaps plot a route to Transport Related Social Inclusion.
Kris Beuret is Director of Social Research Associates (SRA, www.sraltd.co.uk) which has recently merged with Temple (www.templegroup.co.uk). Kris specialises in public engagement in the context of transport, planning, environmental and engineering policy. She has advised the House of Commons Transport Committee, Government and DfT, and served on the Disabled Persons Transport Advisory Committee. She is a Commissioner for the Independent Transport Commission, Chairs the ITSUK Mobility and Inclusion Forum and is a member of National Highways Research and Innovation Advisory Board. Kris was co-editor of the recent ITC publication Why Travel? Understanding our Need to Move and How it Shapes our Lives (Bristol University Press, available here: https://bristoluniversitypress.co.uk/why-travel) and is currently working on a multi-disciplinary strategy of the needs of the Aging Society and a TV documentary on the social history of walking.
This article was first published in LTT magazine, LTT855, 17 October 2022.
You are currently viewing this page as TAPAS Taster user.
To read and make comments on this article you need to register for free as TAPAS Select user and log in.
Log in