TAPAS.network | 10 January 2023 | Commentary | Phil Goodwin
The 2022 DfT National Road Traffic Projections: unanswered questions and required conversations

Just before Christmas the Department for Transport published its National Road Traffic Projections 2022(1). Here explores what they comprise, and how they were arrived at, and whether they provide a sound basis for planning and investing in our future transport system. He finds some positive enhancements over previous versions, but some concerning weaknesses in how the range of future scenarios was defined, and two major omissions in considering the likely real trajectory for road transport in the years ahead.
THE MUCH-ANTICIPATED DfT National Road Traffic Projections 2022(2) comprise an 88-page report with many tables and figures. ‘National’ here means England and Wales. It replaces the Road Traffic Forecasts 2018(3) and earlier versions were published in 2015, 2013, 2011 and previously in various formats back to the 1950s. The current projections come at a time of fundamental re-examination of transport policy and in a period of great uncertainty. The experience of many of those earlier reports (then known as forecasts) has been that publication triggered some significant conversations and reassessments, often extending over many months or even years, that questioned both the assumptions behind, and proper application of, the figures. In some cases even leading to conclusions which were the opposite of those at the time of publication, for example in relation to the 1989 Forecasts in respect of the impossibility of matching road provision to the expected very high growth in traffic, and hence giving more policy support to demand management as an alternative strategy.
Some innovations in the preparation of and re-positioning of the purposes of the new NRTP seem set to open up further such professional discussions, notably on the question of uncertainty, and the associated use of a range of scenarios to accommodate alternative views of the future context of transport activity.
There has always been some recognition of uncertainty in the forecasts, initially often expressed by a most probable or central forecast, with some sensitivity tests to consider, for example, the implication of higher or lower vehicle costs, incomes or population growth. Practical experience has been that these sensitivity tests have tended to be given little weight, with most attention given to the variously titled ‘central’, ‘reference’ or ‘base’ cases, treated in practice by promoters as being the most probable and certainly the most important.
The main change made in 2015, and confirmed in 2018, was that instead of the idea of an explicit ‘most probable’ ‘official’ forecast, which dominated appraisal and policy development, there was recognition of a range of different plausible futures, or scenarios, which should all be given due attention in analysis and policy.
After the 2018 forecasts the Department developed a set of ‘common analytical scenarios’(4) and these have been used as the base for the different scenarios now included in the 2022 projections. One of these is called the ‘core’ projection, in the sense that it is used as a starting point to define the others as more or less extreme departures from it, but this should not be interpreted as the ‘most likely future’ or used as a short cut to avoid formal consideration of the other futures. All the futures are deemed formally credible and important - at least in theory, if not always in practice where the ‘core’ or ‘base’ or ‘reference’ scenario is often treated as a most probable future with only cursory attention to the other possibilities.
The DfT report is clearly written, has a lucid Executive Summary, and is in most cases self-explanatory. The point of my article is not to provide a short cut to avoid reading the original, but to draw attention to some patterns and issues which I think will present particular challenges in implementation, and should be part of wide professional discussion about what it all means.
There are eight scenarios listed, each with a short definition:
Scenario 1: Technology - mainly focussed on a rapid growth of autonomous vehicles which generate a very substantial increase in the attractiveness and cheapness of car use. I don’t have a lot to say about this scenario as – for what it’s worth - I think we have yet seriously grappled with the practical, moral, legal, planning and technical issues of autonomous vehicles, which are fundamental and far-reaching, and challenge a century of town planning and practice, especially for active modes. I don’t think we are actually ready to convert it into statistics which can be compared with the other scenarios.
Scenario 2: Vehicle-led decarbonisation – This assumes a high and fast uptake of Zero-emission vehicles, also including autonomous vehicles, but in a less prominent position. There has been much attention in academic and professional literature to issues of measurement about limitations of the idea of ‘zero’ emission vehicles(5), and in the reports of the Committee on Climate Change. An essential issue here is the calculation of carbon consequences of a complete scrapping programme (which involves a big increase in the production of new vehicles) compared with a slower replacement as fossil fuel vehicles reach the end of their use. The regime for decommissioning replaced vehicles, or allowing them to reappear in other formal or informal markets elsewhere, makes a big difference to emissions at the global level, as indeed do trends in vehicle size and weight which are offsetting carbon reductions. These complications are not resolved. Meanwhile, the carbon figures reported only relate to tail-pipe emissions.
Scenario 3: Regional – there is a scenario in which employment and population in the ‘Wider South East’ or England is capped, enabling assumptions of higher employment and population growth in other areas. There is some impression that the scenario might have been added as an afterthought, which is why sometimes seven scenarios are mentioned in the document, and sometimes eight. For avoidance of confusion (I hope) I refer to all 8.
Scenarios 4 & 5: Low Economy and High Economy. These are rather conventional descriptions of – low income and employment, subdued inward migration, as compared with richer real incomes, high inward migration and population growth. These two cases roughly correspond to ‘optimistic’ and ‘pessimistic’ economic outlook, treated as inputs to traffic growth rather than implying any particular impact of transport policy or projects on growth. The descriptions are rather muted compared with the great attentions to economic prospects in the period of successive appointment of Prime Ministers in the last two years, and, in an endnote the report suggests that current economic discussions at Government level are not really captured in the range of conditions discussed, or levels of doubt about their impact. It might be that the discussion and definition of the scenarios has been somewhat influenced by the need to avoid the appearance of challenge to the rather complex presentations of what Government at a higher level needs to balance issues of optimism and stringency.
Scenario 6: Core Scenario. This is based on the latest government projections of the main drivers of road traffic demand, for example population, GDP, employment, households, fuel prices and fuel efficiency. A net reduction of 5% in car vehicle miles has been applied for Covid (i.e. ‘compared with a projection without covid’). There are also included the effects of ‘firm and funded’ government policy, for example, where ambitions are supported by published plans or funded policies. These are not explicitly listed, though presumably there is a log somewhere of all such ‘firm and funded policies’, which would be useful to list, as over a period of 40 years or more into the future, it is not self-evident what is included. The report mentions that projects(6) for 1400 lane miles of added road capacity by 2035 are included as committed and funded (applied, I think, in all scenarios, though with no discussion of the implications that not all have necessarily published their detailed appraisal, been submitted to public examination or been approved). It seems not to include the policy initiatives listed in the Government’s Decarbonising Transport policy document (2021), even though these have a higher ostensible commitment of any policy, being derived from legal commitment to Climate Change targets. There is no sign in the projections of the effects on carbon and traffic that would follow from the many detailed policies committed in that strategy, on which more below. There is no mention of whether – for example – the very positive and public Government supported commitments in setting up Active Travel England would count as ‘firm and funded’ policy over the whole period, or to only the first three years of funding already announced, or at all.
One remarkable result is that the 2022 overall traffic projection is almost identical, over the whole period, to what was the 2018 traffic forecast, as shown in the figure below (Figure 49 in the report).

Note here that there are two lines on this graph, not one. The identity arises because the increase of commercial vehicle forecasts is estimated almost exactly to offset the reduction in the car traffic forecasts. Given the changing view of economic prospects for the economy as a whole (Brexit, public expenditure, real incomes, employment etc) I suspect that keeping a fairly close monitoring of outcomes on this is likely to be important. Meanwhile the apparent identity of the 2018 ‘reference’ case and 2022 ‘core’ may lead to suggestions that the ‘the new situation’ is not very different from the old one. However, a quite different picture emerges when considering the other – equally credible – scenarios.
Scenario 7: ‘The Mode-balanced Decarbonisation Scenario’. This is a new scenario not corresponding with any in previous projections, and a very important one. The description in the text is as follows.
‘(This) represents a world where the assumed increase in EVs does not result in a decline in public transport use. There are many policy options that could deliver this outcome and, consequently, several ways to model it. For the purposes of modelling simplicity, we have taken the straightforward approach to equalise the perceived costs of EVs with those of petrol and diesel. This removes the cost advantage of EVs and creates a slight cost disadvantage compared to current conditions making the usage of public transport, walking and cycling more attractive.” (Para 3.42)
This performance of the new scenario 7, ‘mode-balanced decarbonisation’ is the first time – I think – that the impacts of a specific policy instrument is included among the road traffic scenarios, though alternative assumptions about general energy prices have been explored over the years. It reflects the remarkable power of being able to simultaneously apply even quite modest pricing initiatives to pursue both efficiency and carbon objectives.
Scenario 8: Behavioural Change Scenario. This is not based on estimates of the effects on behaviour of any enhanced policy, but on a different modelling interpretation of accelerated trends actually observed before covid, including increased flexible working, on-line shopping, and less car-oriented travel choices by young people. This appears to notably reflect what I consider to be an important report by Chatterjee and colleagues at UWE and Oxford University, carried out for the Department for Transport in the period before Covid(7). It may more sensibly be considered as an alternative modelling approach, a ‘model in waiting’, than a different scenario. Its analytical approach could be applied to each of the other scenarios, and would make different forecasts of their effects.
An Overview of the Scenario Results for Traffic and Carbon
The structure of the document explores separate results for traffic, congestion, carbon and other emissions separately for each of the scenarios. Here I focus on two. These are the calculated effects at face value on (a) Traffic Growth, and (b) Carbon emissions, for each of the scenarios. These are shown in the following two diagrams, copied from the report. They illustrate in stark form the main dilemma of future pathways. There is a divergence of traffic and carbon considerations.
What these show is two groups of scenarios, with profoundly different effects. Four scenarios - the technology, vehicle-led decarbonisation, regional and high economy scenarios - all show high traffic growth (and corresponding increases in congestion, as one would expect), and varying reductions in carbon emissions.
By contrast, the two scenarios showing the least traffic growth are Mode-balanced decarbonisation and Behavioural change. To some extent the ‘low economy’ scenario also shows low traffic growth and low carbon effects, though the policy implications of this are complex since, in general, it is not a scenario which is championed as a choice, more often being treated as simply an unfortunate failure. Even so, it provides a period in which the growth of traffic congestion and carbon emissions are less extreme than unmoderated extrapolation of trends.
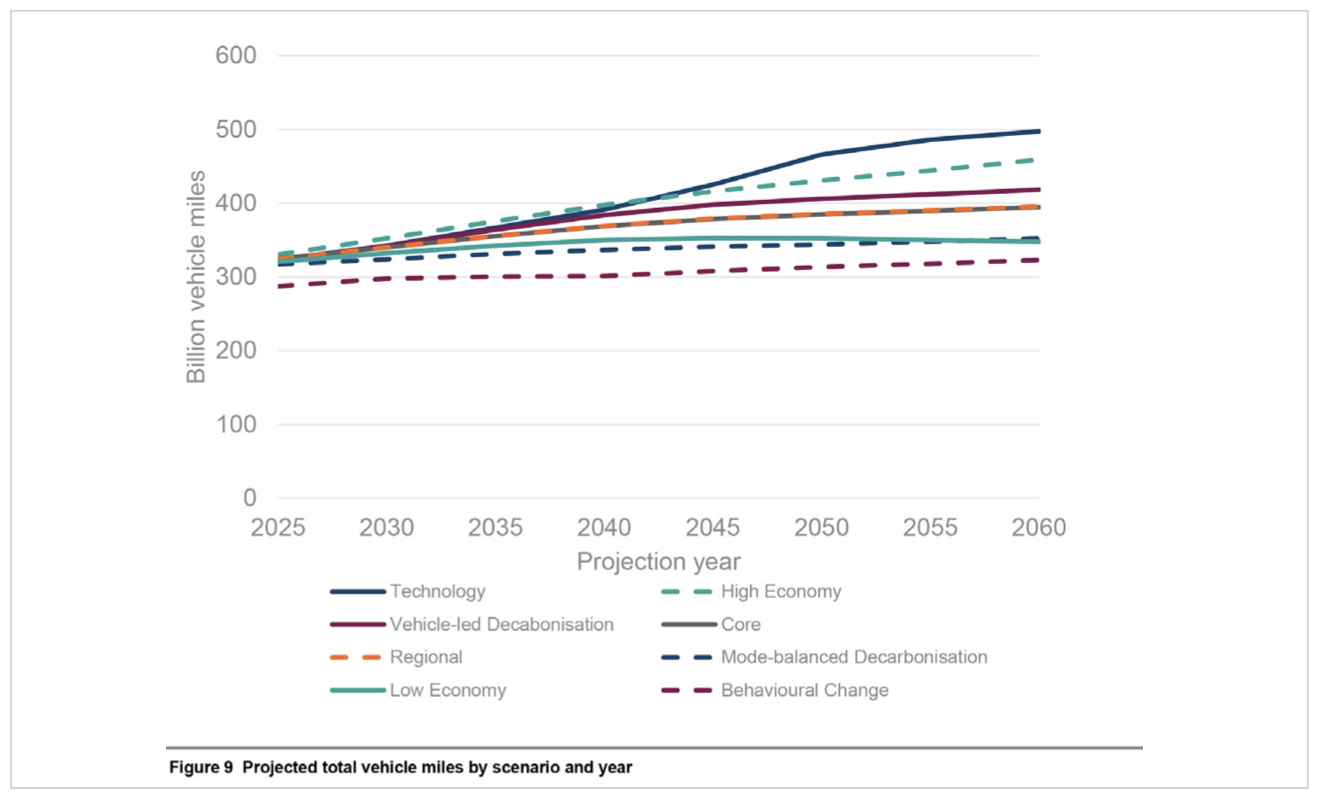
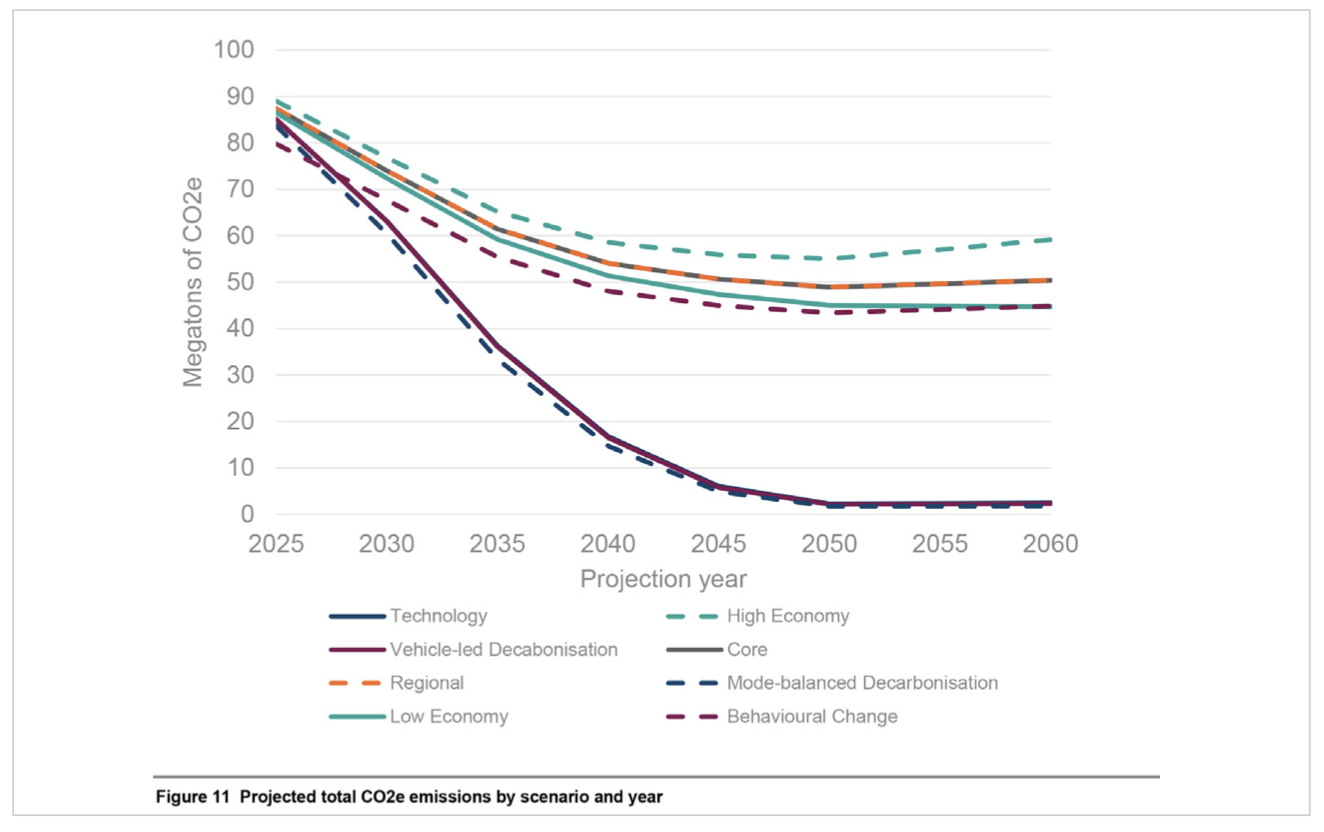
Relative conflict exposed by the various scenarios between traffic growth and carbon objectives is not surprising, but there are some new insights in the results. (Note the first version of this column as published was erroneous due to misreading the colours of the broken and unbroken lines in the published graphs. This was my error and I apologise for it. The following text is amended and I hope correct). There are two routes which, on the assumptions made, offer very similar and substantial carbon reductions. These are those of vehicle led decarbonisation, which is associated with a larger increase in traffic volume, and hence increasing congestion, and the mode-balanced decarbonisation scenario, which offers a similar carbon advantage but less traffic growth and hence congestion. This is the scenario which is similar in some ways to the policy lines discussed in Decarbonising Transport, though less ambitious due to relaying only on a pricing assumption and not including the wider transport policy changes discussed in the next section.
The wider conversation - Climate Change
I would argue that the two most important, highly probable, future developments are not captured anywhere in the eight scenarios at all. Their explicit inclusion should be, I think, absolutely central to the transport policy implications of traffic forecasts, and indeed crucial to the projections themselves.
The first is climate change. We are accustomed now, of course, to the need to build calculation of carbon and other Greenhouse Gas impacts into all major policies and projects. This is half the story. But alongside this we are utterly unpracticed in considering how significant climate change will itself affect the conditions of travel, for example through impacts on physical and economic geography, ranging from local issues of flooding and run-off and droughts, the resources needed for emergency relief, and the design of systems to cope with unexpected conditions.
The Climate Change Committee sees one of its important roles not only to mitigate climate change by suitable policy, but also to identify how to adapt our structures to cope with whatever degree of climate change we (in the UK and globally) fail to prevent. DEFRA has recommended that all project and policy appraisal ought to consider two different climate change scenarios, related to 2°C or 4°C increase in average global temperature(8). Such possibilities are not even mentioned in the Common Analytic Scenarios, or any of the projections. In effect, the common analytic scenarios all assume futures with no significant climate change, and no impacts of it, on ‘business as usual’. This seems to me to be a very serious omission, and a serious limitation on the usefulness of insights from even the most careful systematic review of the different effects of the eight scenarios included.
To allow ourselves to model and consider trajectories where carbon reductions fail to meet our policy objectives, while assuming that this has no effect on the climate, fails to introduce any discipline for success, and against failure. In effect, it says that we (the UK, or the UK transport sector) can assume we will be ‘saved’ by action outside our control in other sectors, or indeed other countries. There is no feedback to ensure that the worse we do on carbon, the more pressure we must be under to cope with climate change.
The second missing part of the equation is that the futures for transport in general all the scenarios considered (except for the muted inclusion of price changes in ‘mode-balanced decarbonization’) do not include the impact of new policy initiatives. –
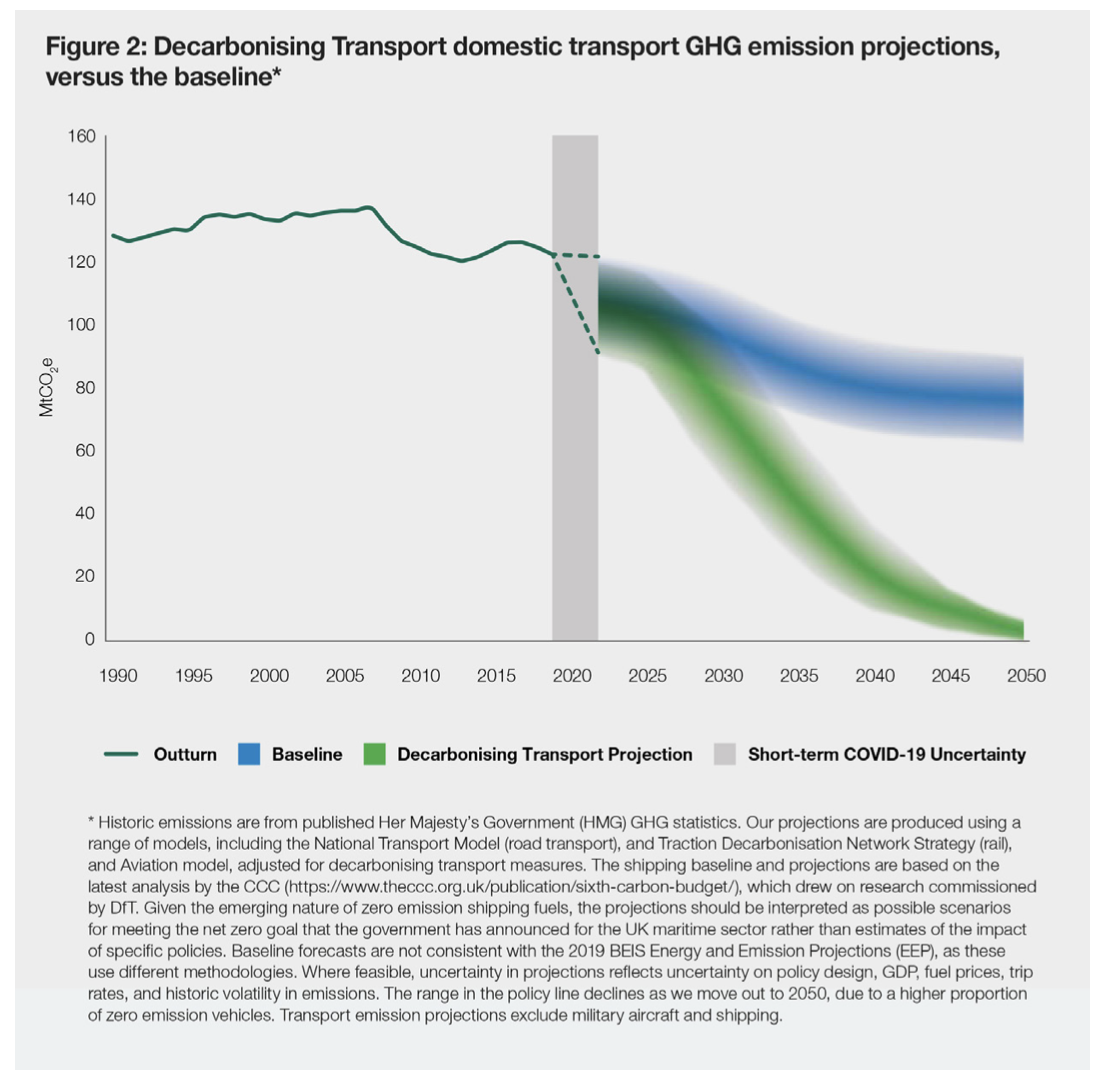
In the same period that the DfT were working up the new projections, the policy initiatives listed in the Government’s own Decarbonising Transport policy in 2021 were also, very properly, being assessed in relation to their implications for traffic growth and carbon.
Professor Greg Marsden of Leeds University sent a Freedom of Information request on 7th March 2022 asking for the traffic analyses which had been calculated by DfT in 2021(9) to produce its diagram of two trajectories for carbon reduction up to 2050, one being the ‘current’ trajectory not compatible with carbon objectives, and the other the possibilities of successful achievement of carbon targets enabled by implementation of the policies in ‘Decarbonising Transport(10) which had been calculated by modelling analyses carried out in 2021.
The Information Commissioner supported this request in November 2022 and instructed the DfT to provide the information. DfT initially proposed to appeal but then decided to realise additional information, which is discussed separately on [page number or link]. This includes figures showing that an accelerated rate of uptake of EVs, or EVs and AVs, is expected itself to produce a big increase in traffic, thought to be greater than reductions due to traffic-reducing measures related to targets for walking, cycling and public transport. It should be noted that wider carbon effects in electricity supply, expanded production of vehicles, and trends in size and weight are not included here as they are allocated to other appropriate sectors of the economy, though these will still need to be taken into account in appraisal of the overall carbon impacts of decisions in the transport sector. The consequences for carbon arising from road construction, and any changes in this due to increase or reduction in the volume of traffic would normally be included in transport appraisal, but this has not yet been included in the additional information. .
At present this means that we have to discuss the implications of many different scenarios of traffic and carbon impact, but excluding the scenarios of most importance. These are those that show what happens if we fail to meet carbon objectives, at a global scale, and the scenarios representing what happens if we succeed, at a national scale. Either would have far bigger effects on traffic conditions than the interesting scenarios reported in detail in the NRTP, and surely their inclusion will be a necessary condition for big policy decisions on infrastructure, services and policy.
It is clear that the differences in traffic levels, congestion, and other impacts of the various traffic projections means that both high and low traffic scenarios will need to be appraised for specific road proposals. But the consequences of, and for, strategic policy and projects cannot be easily handled by adding further variants for two or more policy directions for every one of the already quite large number of different traffic projections. It would give 20 or more different options to compare, and it is difficult to think how this would be managed in policy discussion and public engagement. Next time I’ll propose what I see as a more manageable and more insightful approach to the necessary discussion. For this, we will need to ensure that the pathways showing the outcomes of carbon success, and carbon failure, are surely both essential parts of the policy discussion of the future of traffic volume and its effects on carbon, congestion, and economic and social conditions. And the precautionary principle would imply that we need at all times to aim at the lower boundary of the green carbon compliant strategy.
References:
-
3. https://www.gov.uk/government/publications/road-traffic-forecasts-2018
-
4. https://www.gov.uk/government/publications/tag-uncertainty-toolkit
-
5. Anable J, Brand C. 2019. Energy, pollution and climate change. In: Transport Matters: Why transport
matters and how we can make it better. -
6. Para 3.24
-
7. https://www.gov.uk/government/publications/young-peoples-travel-whats-changed-and-why
-
8. https://www.gov.uk/government/publications/green-book-supplementary-guidance-environment
This article first appeared in LTT magazine LTT860, 10 January 2023. The original publication contained an error and was subsequently corrected by Professor Goodwin in this revised text on 23 January 2023.
Phil Goodwin is Emeritus Professor of Transport Policy at UCL and UWE, and Senior Fellow of the Foundation for Integrated Transport.
This article was first published in LTT magazine, LTT860, 10 January 2023.
You are currently viewing this page as TAPAS Taster user.
To read and make comments on this article you need to register for free as TAPAS Select user and log in.
Log in