TAPAS.network | 9 April 2024 | Commentary | John Siraut
UK Goods movement and freight traffic flows – a key transport activity deserving greater understanding

The significance of freight movement on Britain’s road system is generally given rather less attention than it should, says . The patterns of lorries and vans on both long-hauls and local deliveries are hard to monitor in detail - let alone the nature of the goods on board. He takes a look at the latest available official data.
GOODS VEHICLES are often overlooked as an important element of road traffic, and even seen as an unwelcome nuisance, especially in urban areas, though today’s society is heavily dependent on them. From bringing food to the shops – both supermarkets and high street shops and corner stores - to delivering the burgeoning number of on-line ordered parcels to our homes, much freight being carried around is almost invisible within the vast number of trucks and vans on the road. There are now some 540 thousand HGVs registered in the UK, up 8% over the last decade and 4.7m LGVs up 31%. To put that into context, there has been a 9% increase in the number of cars registered over the same period.
In this article I have sought to pull together information from a number of official data sets recently released, including vehicle licensing, Road freight: domestic and international statistics and Daily transport usage of road vehicles.
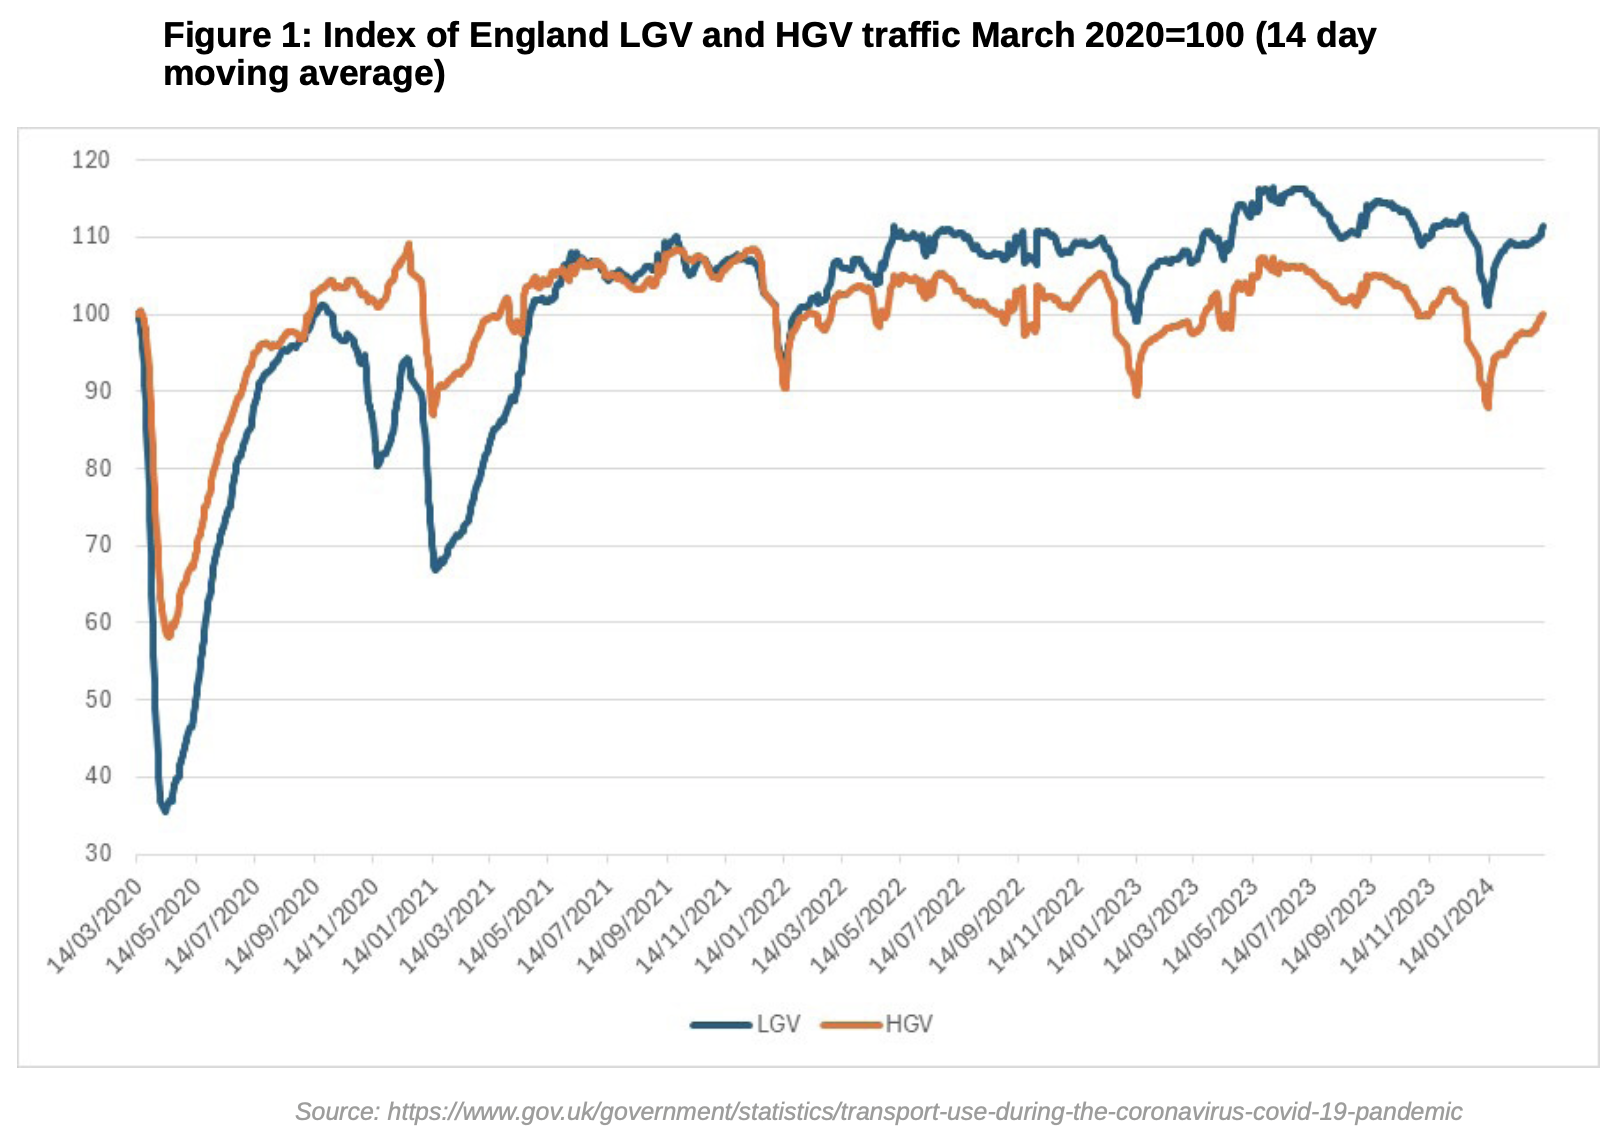
Given the dependence on them for modern life, unlike other forms of transport conveying passengers goods vehicle movements truck movements were least impacted by the pandemic and its accompanying lockdowns as can be seen in figure 1. The initial lockdown did see a 40% fall in Heavy Goods Vehicle (HGV) traffic, but it soon recovered, while subsequent lockdowns had relatively little impact. Since then HGV traffic levels have stayed relatively constant at around pre-pandemic levels. Light Goods Vehicle (LGV) traffic was impacted to a much greater extent by the lockdowns. While notionally all regarded as ‘goods vehicles’ (the official cut off weight between an HGV and LGV is 3.5 tonnes) light van activity comprises a wide range of purposes, not limited to obvious movements of freight and including all number of ‘white van’ uses by domestic service suppliers, builders, plumbers equipment installers and maintenance trades whose activities were all badly hit the pandemic restrictions.
As Professor Phil Goodwin noted in his recent contribution in LTT and on TAPAS about the Lower Thames Crossing project appraisal, in which freight traffic plays a significant part,the DfT report ‘Final van statistics April 2019-March 2020’, issued in 2021, provided a detailed analysis of van statistics, which are the largest category of Light Goods Vehicles. This showed that their largest function (54%) is to carry equipment, tools and materials, for example by builders, plumbers, electricians and other tradespeople, Other important activities are ‘delivery’ (16%), and Private domestic non-business use (also 16%) and recreation, leisure and holidays (11%). All of these, in different ways, are likely to respond to changing traffic and economic conditions by carrying out more or less activities, in different ways to the more obvious freight- carrying HGVs.
While LGV home deliveries may have increased dramatically during the pandemic, the negative impact on other sectors of the economy meant overall LGV traffic levels remained below pre-COVID 19 levels until around May 2021. Since then LGV traffic has grown fairly steadily, hitting a peak around June 2023 before drifting slightly downwards reflecting the general downturn in the economy.
This pattern of varied light van movement by a diverse set of private sector commercial enterprises – many of them individual or small businesses – makes data hard to compile in detail compared with car or bus and coach trips. Neither the roadside traffic count observations can reveal much about what freight movements are going on, nor is there any in depth sample survey like the National Travel Survey taking place to even paint a general picture of in terms of Origin and Destination information, let alone journey purpose or the volume or nature of what is being conveyed in all those van movements.
For those arguing that more freight should go by rail, it is notable that the vast majority of road freight is very local, even for HGV traffic. As figure 2 shows, over 60% of freight moved by HGVs travels less than 100km with just 15% moving more than 200km. Rail freight generally requires very large volumes or long distances to be competitive i.e. around 200km plus. The government’s target to increase rail freight by 75% by 2050, if it was all mode shift from road would reduce road freight by around 7%. Van traffic would meanwhile seem almost wholly unsuitable to switch to rail.
At the short distance very local level the environmentally- friendly alternative is increasingly seen to be bicycle powered ‘last mile’ goods deliveries, with the Second National Cargo Bike Summit event organised by Landor Links with LTT just coming up next month and dedicated to helping build a suitable ecosystem to take cargo bikes mainstream.
These local pick ups and drops are of course very fine-grained, and not much suited to the sophisticated consolidation and computerised scheduling, which has been the driving purpose of the mainstream Logistics sector over the past half-century or so, and to which no doubt AI is currently adding new dimensions.
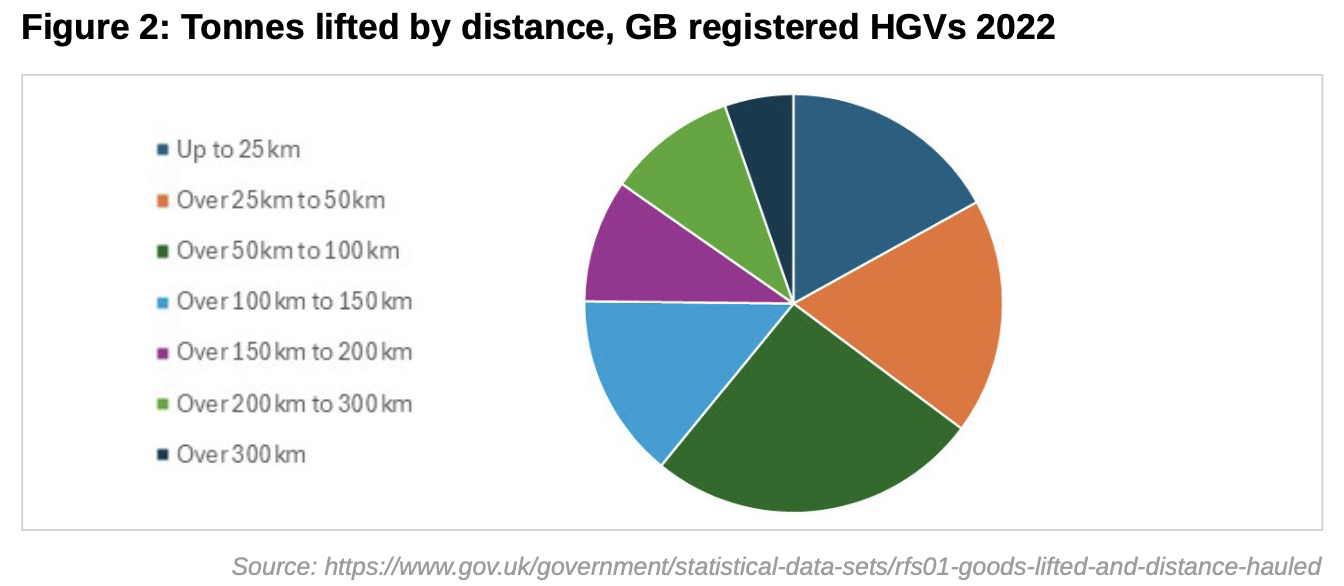
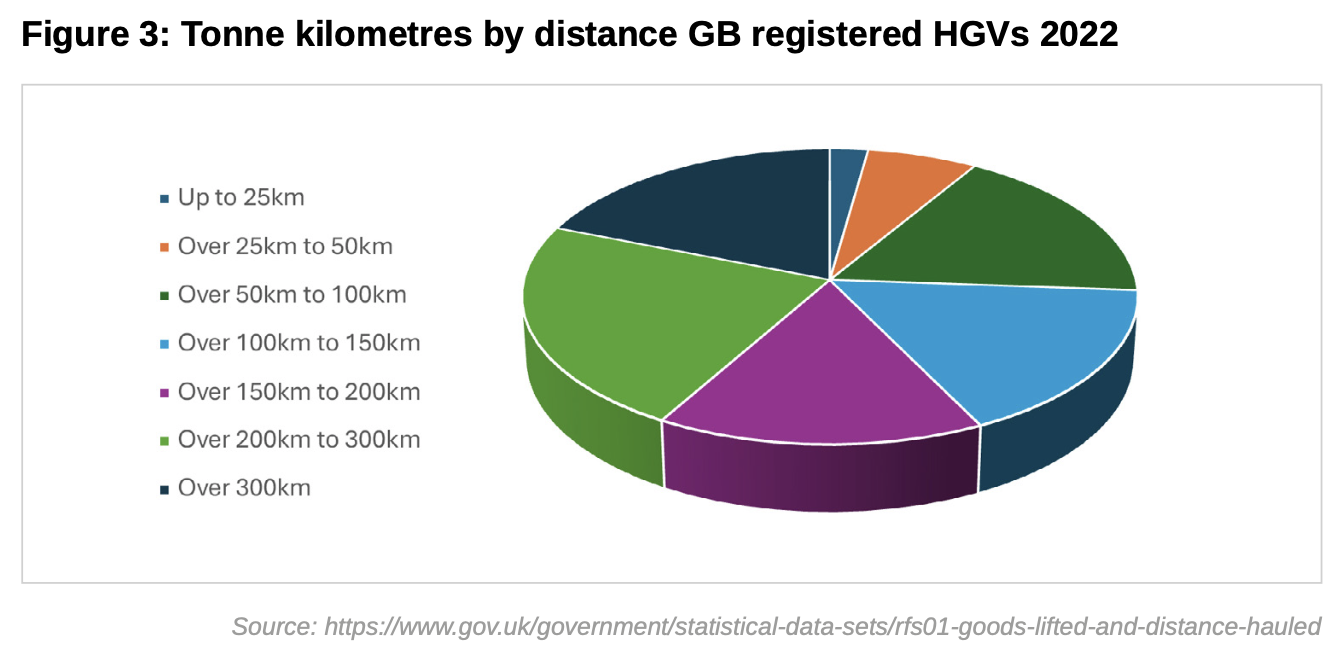
The range of goods trip types picked up in official data is indicated in figures 2 and 3. The first of these shows a fairly broad spread when distance travelled is taken into account. But a rather different picture emerges when it is tonne kilometres being measured as shown in figure 3. While short haul trips account for over 60% of tonnes lifted, they account for only a quarter of tonne kilometres. Trips in excess of 200km account for 42% of tonne kilometres.
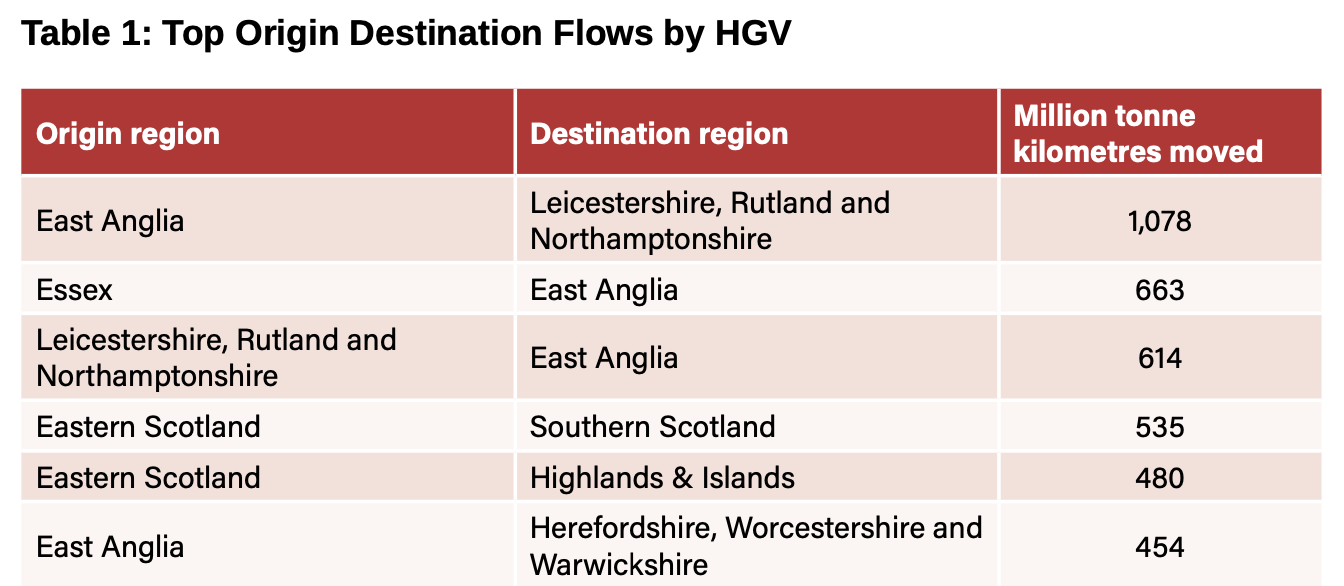
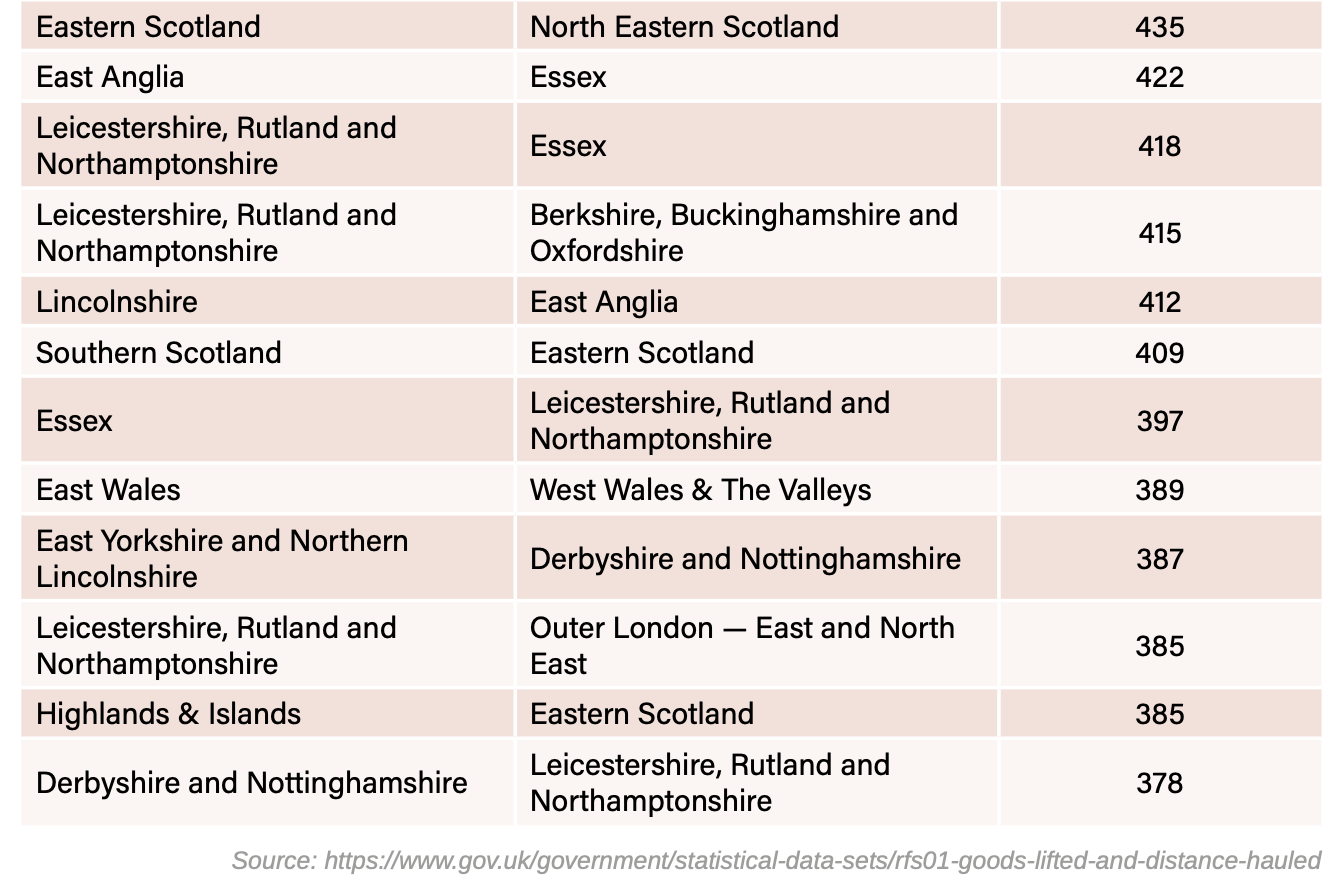
However, perhaps unsurprisingly, considering the significance of the dominant Grocery distribution patterns once trucks leave the Regional Distribution centres to go to individual stores, most long distance flows are very dispersed in terms of both origins and, most particularly, destinations. The largest area to area flows by million tonne kilometres are set out in table 1. It highlights the large flows into and out of the distribution centres of the East Midlands especially in relation to traffic from the ports in East Anglia and Essex. However, most of the flows highlighted in the table are between adjoining areas.
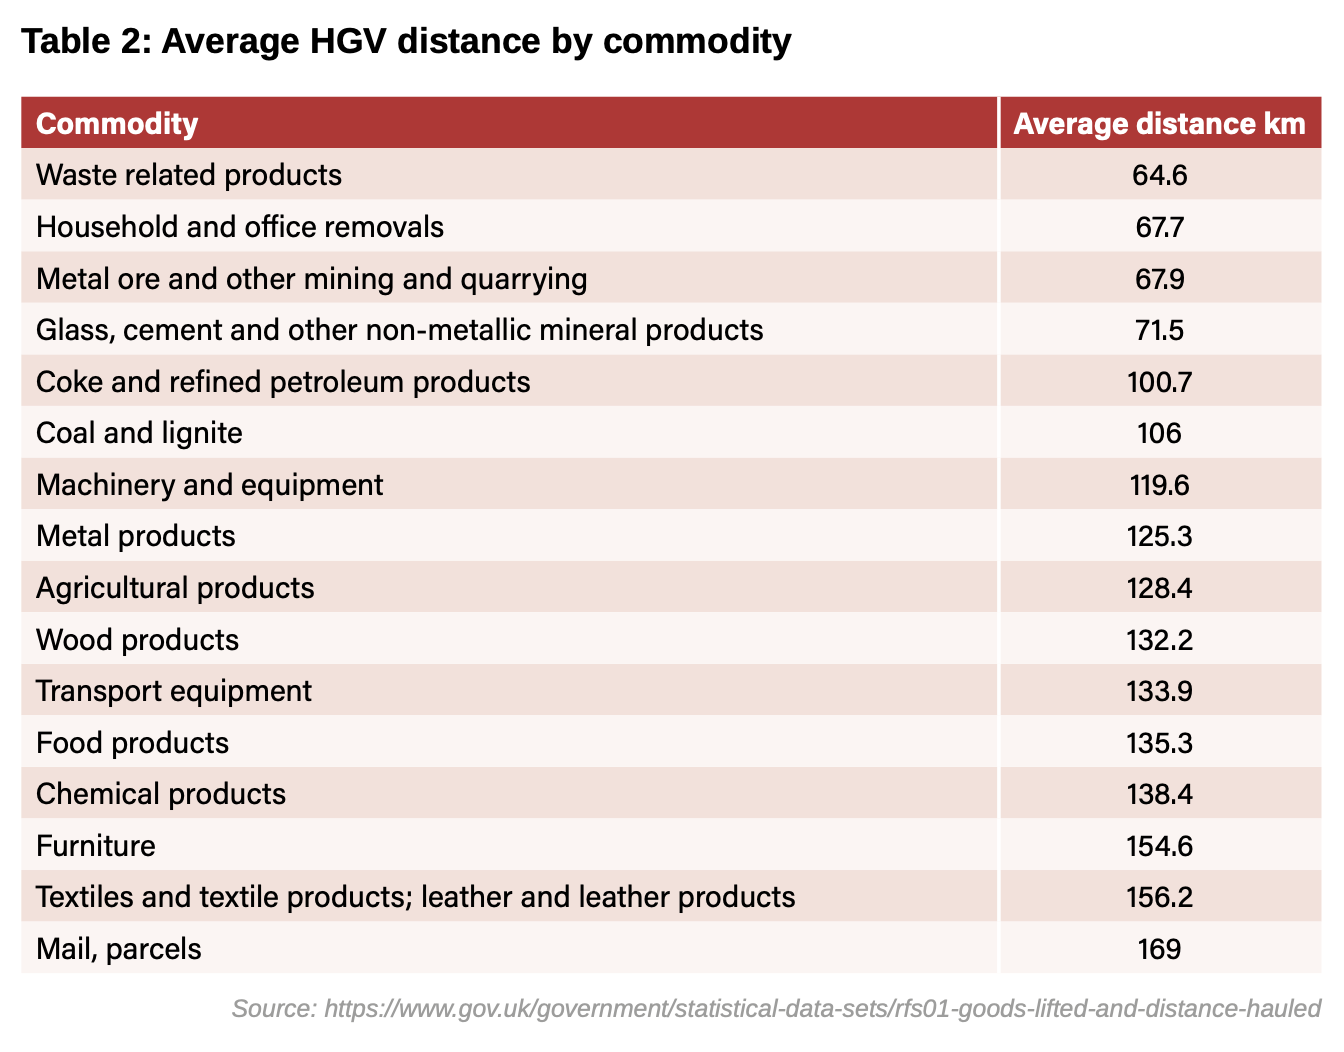
This is reinforced by the average distance for HGV loads by commodity as shown in table 2. It ranges from 65km for waste products up to 169km for mail and parcels. HGVs, of course, are not often used for home deliveries, so this part of the mail/parcels movements is most likely to be between ports and distribution centres before the local drops are made. It might be noted here that the high level of transhipment within the freight supply and distribution chain is probably not that widely understood outside the sector itself – and of course will generate a further level of mystery within whatever data on ‘anonymised’ goods vehicle traffic patterns is collected. The goods vehicle activity around the main freight hubs on the trunk road network is certainly a major factor in traffic engineering and control.
An interesting question, as well as understanding both the movements of individual goods vehicles and overall flows of different types of goods, is who owns and operates the vehicles, and the changing commercial structure of the logistics and distribution sector itself.
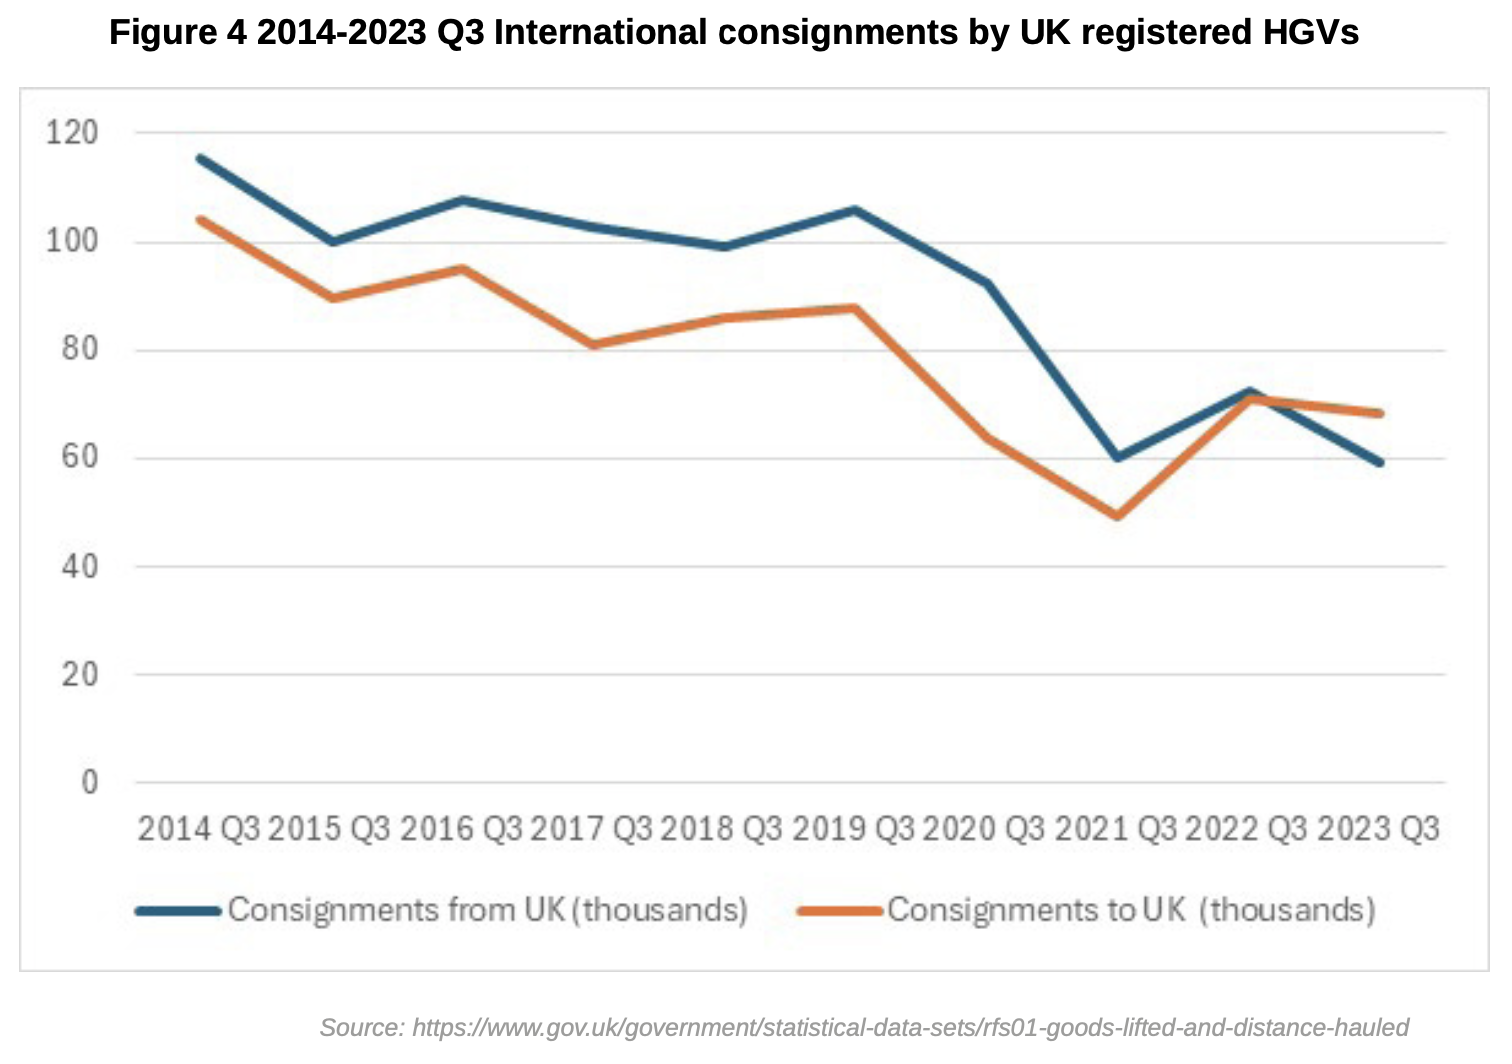
One area that has seen a major change in recent years is the declining volume of UK HGV registered consignments to international destinations compared with goods carried by foreign vehicles.
Figure 4 takes Q3 numbers for each year over the last decade for both inbound and outbound consignments (excluding internal traffic on the island of Ireland) by UK HGVs. There has been a steady decline over the last ten years so that consignments from the UK in 2023 Q3 are at the same level as during the pandemic while consignments to the UK are well down on a decade ago.
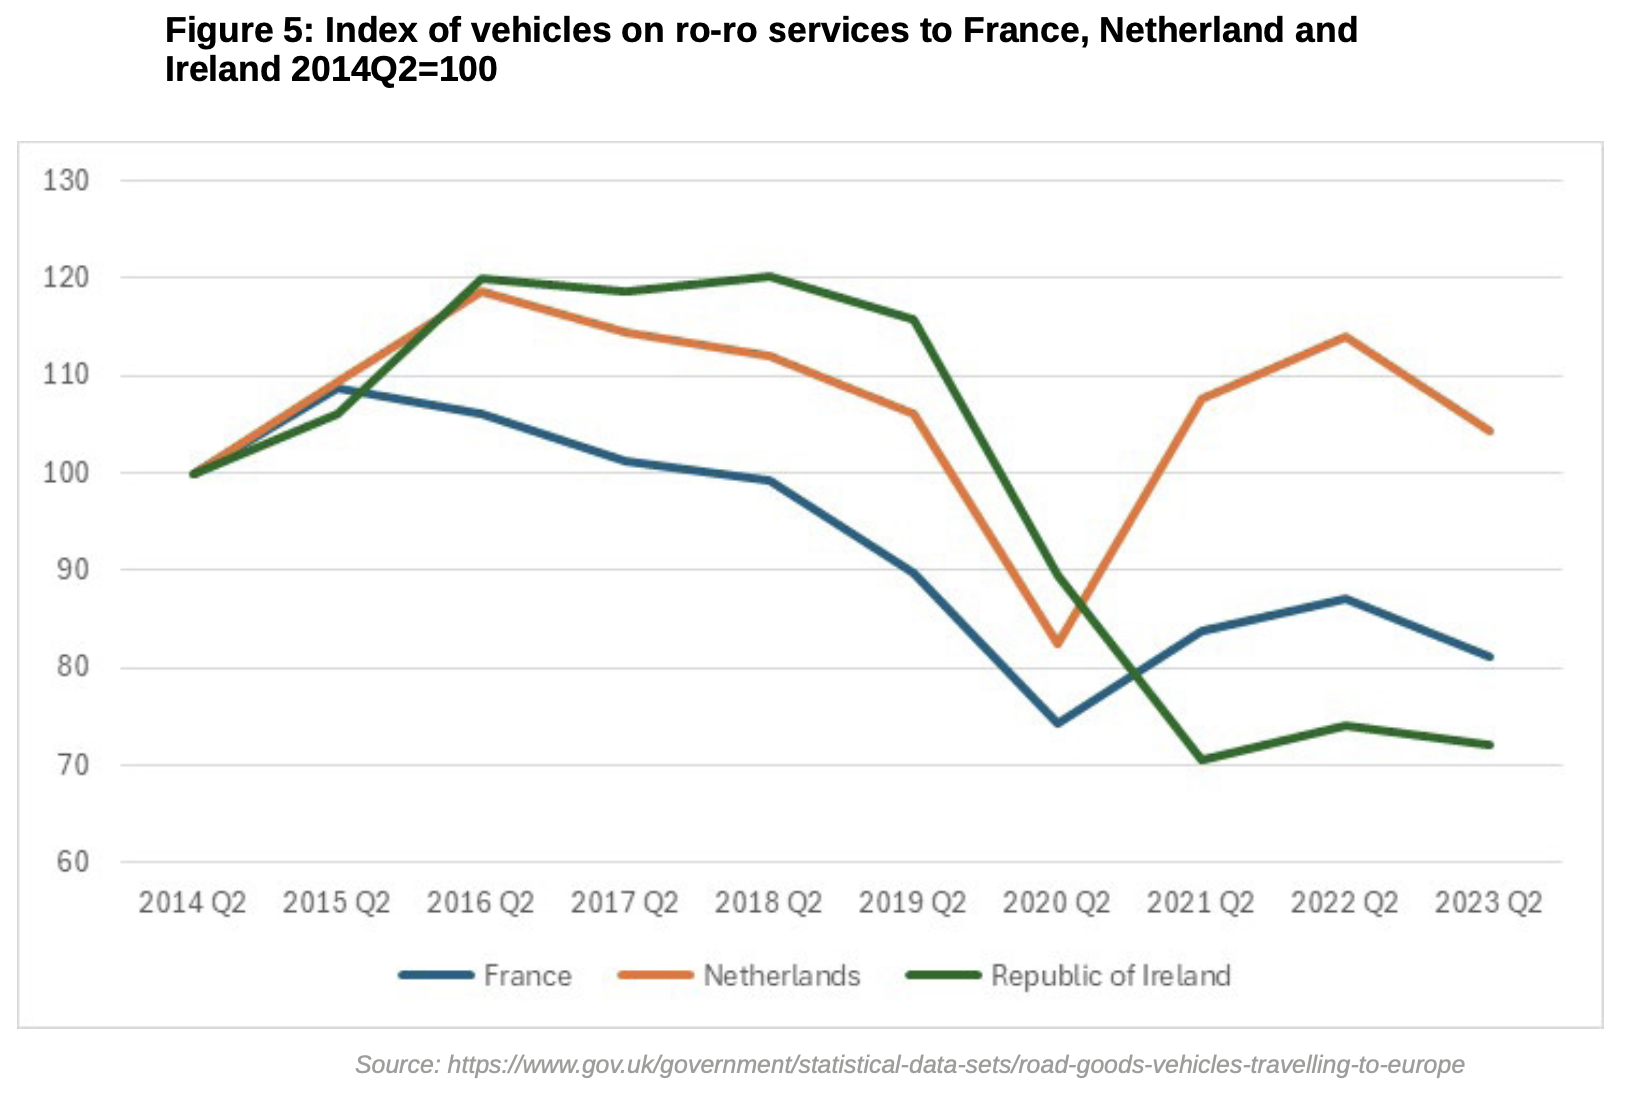
Part of the reduction in UK registered HGV consignments is the greater prevalence of foreign owned vehicles, so it is interesting to look at what is shown figure 5, from another data set, which considers the volume of all roll-on roll-off (ro-ro) traffic from the UK. That is, regardless of country of registration of the vehicle, with the data including both ferry and Channel Tunnel traffic. As release dates for domestic HGV and ro-ro traffic are different, this figure uses data for Q2 for each year from 2014 to 2023.
As can be seen traffic to France, which is by far the largest flow, started to decline from 2015, recovered slightly after the pandemic but fell again in 2023. Traffic to the Netherlands declined from 2016, but recovered strongly after the pandemic but again fell in 2023. While traffic to Ireland shows a different pattern again. It stayed high until the pandemic, then almost halved and has not recovered. In part this is due to a big increase in direct ferry services from Ireland to the continent avoiding the UK.
In summary, I hope this article has helped shed some light on the pattern of both vehicle movements and goods within the freight sector, including a number of interesting, and changing elements. These are likely to be significant considerations for anyone seeking to understand the impact on the highways system in future years.
HGV traffic overall has remained relatively static for a number of years. A high proportion is relatively short distance with the main longer distance flow being between East Midlands distribution centres and the East Anglia ports. Overseas flows have declined in recent years both in total and particularly for UK registered vehicles. Meanwhile the LGV sector is more complex, and harder to reduce to a few key trends, though the mysteries of what really constitutes the White Van sector remain to be further explored, whilst the emerging Cargo Bike era might be an important new element in the urban goods mix.
One final thought on the road freight sector, not explored here, must be its pathway to decarbonisation. That poses a number of issues quite distinct from those affecting passenger transport, which I might in due course explore in a future article.
References and Links
-
https://www.gov.uk/government/statistics/transport-use-during-the-coronavirus-covid-19-pandemic
-
https://www.gov.uk/government/statistical-data-sets/rfs01-goods-lifted-and-distance-hauled
-
https://www.gov.uk/government/statistical-data-sets/road-goods-vehicles-travelling-to-europe
-
https://www.gov.uk/government/statistical-data-sets/vehicle-licensing-statistics-data-tables
John Siraut is director of economics at Jacobs.
This article was first published in LTTmagazine, LTT889, 9 April 2024.
You are currently viewing this page as TAPAS Taster user.
To read and make comments on this article you need to register for free as TAPAS Select user and log in.
Log in