TAPAS.network | 31 October 2022 | Commentary | John Siraut
Who drives, and how well? A look at the numbers and their variation by gender and age

There are some interesting contrasts in the data for mens’ and womens’ driving activities, and the variations between different age groups. takes a look at licence-holding, driving tests, insurance costs and claims levels, and at who gets the most penalty points
CONSIDERABLE CHANGES have occurred in the patterns of driving activity by men and women in the latter decades of the 20th century, and the first part of the new Millennium. I thought it useful to take an in-depth look at where things are now in that regard, and to perhaps highlight some interesting emerging new trends.
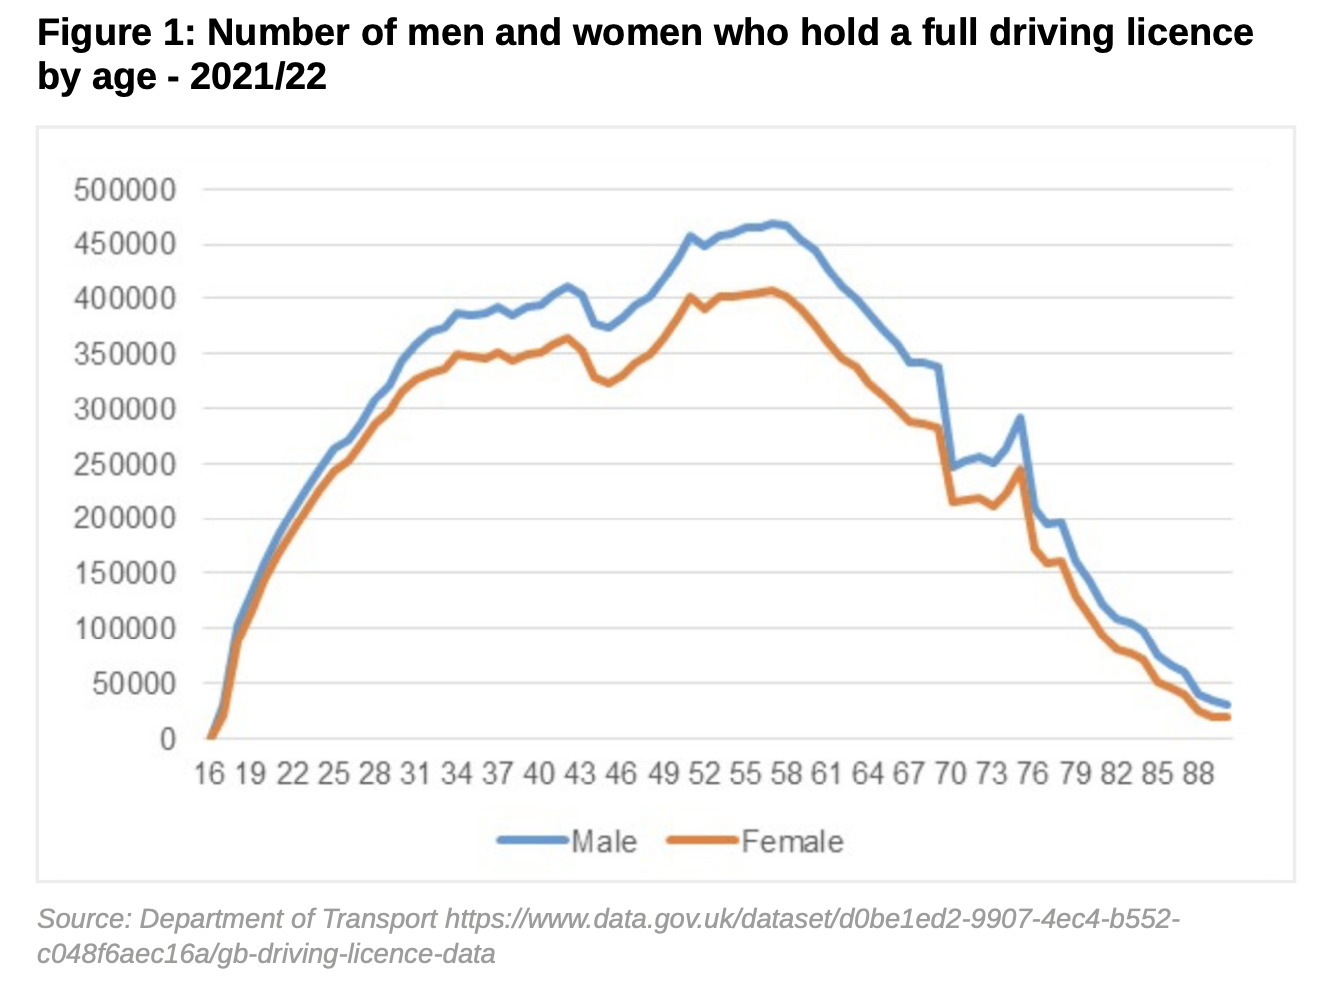
Of the over 41 million full driving licences held by Great Britain residents, 22m are by men and 19m by women. As figure 1 shows more men than women hold a licence for all ages, although the percentage gap between the two is not that great, men generally accounting for around 52-53% of the total number of licences for each age band.
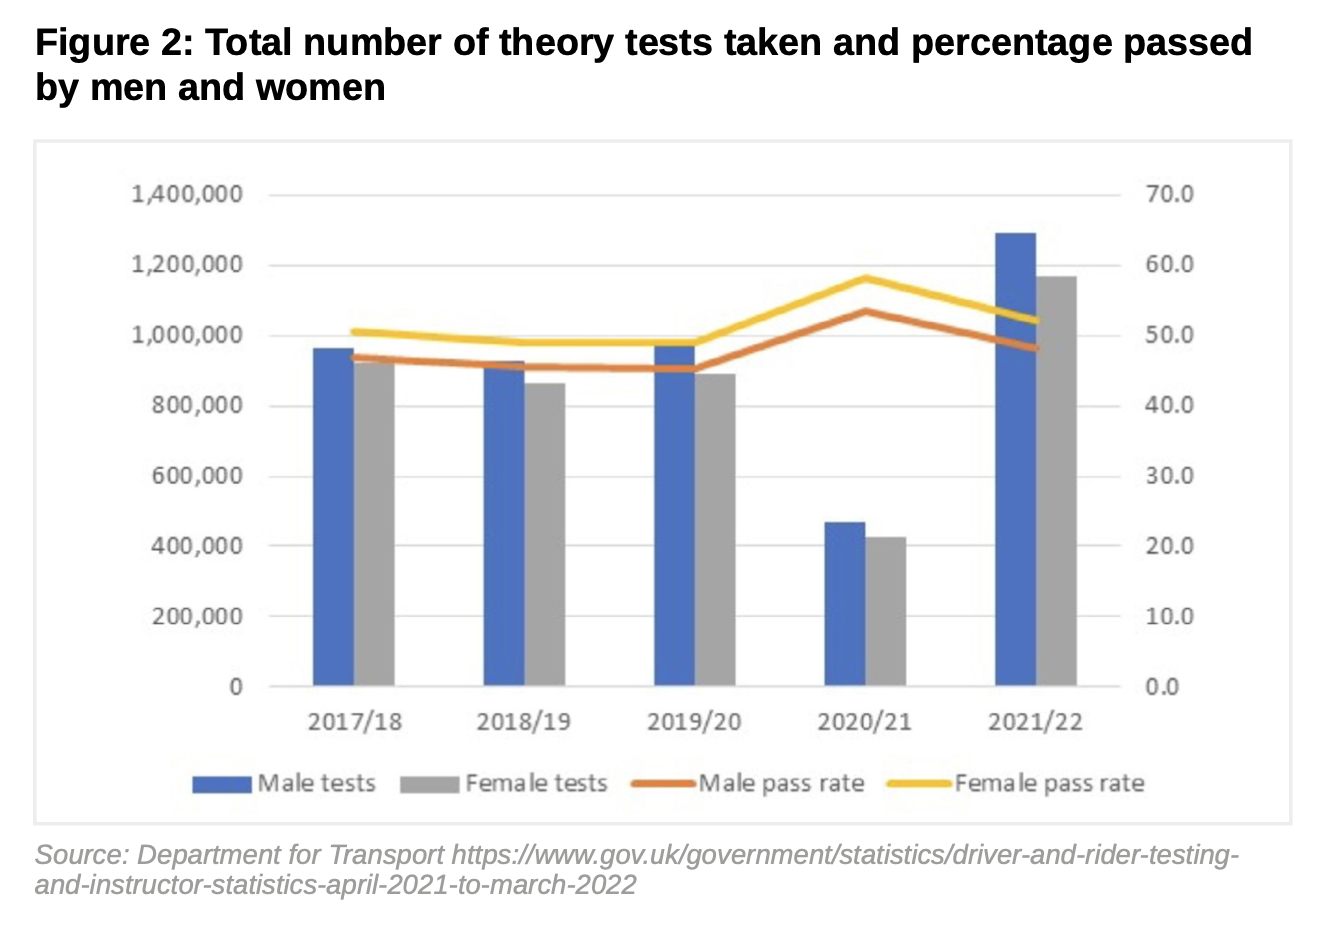
To get a full driving licence you need to pass both theory and practical driving tests. The annual number of driving theory tests taken has averaged around 1.8m in recent years but, 2021/22 saw a large surge to 2.5m due to the impacts of Covid the previous year. The overall pass rate tends to be around 50%. As figure 2 shows, slightly more males than females took the theory test, but the pass rate for women was on average four percentage points higher.
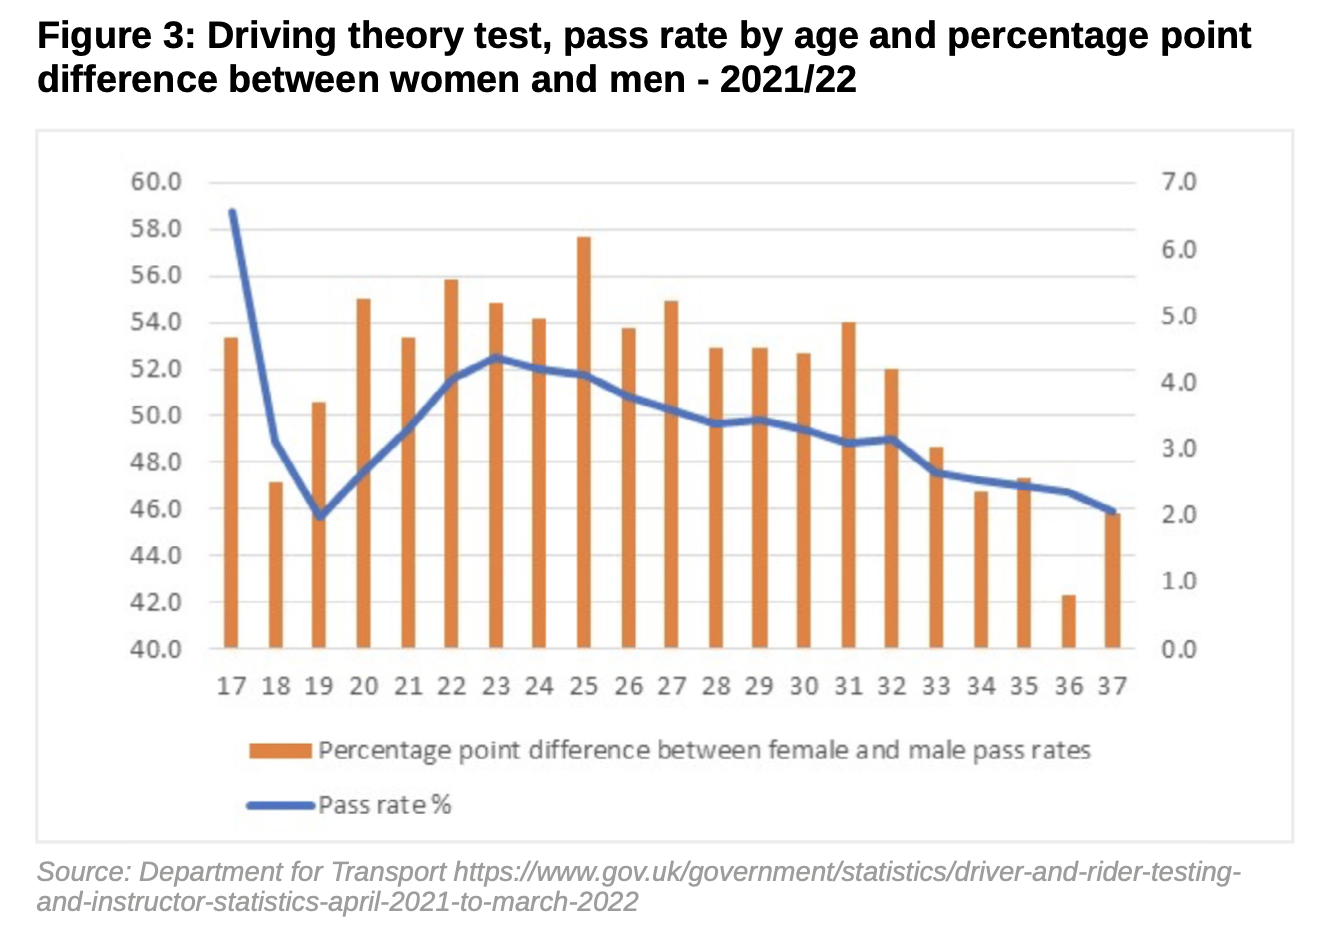
At each age, women have a higher theory test pass rate than men, although the margin declines with age, figure 3..
The overall theory pass rate by age follows an interesting pattern, its nearly 60% for 17-year-olds, rapidly falling to 46% for 19 year olds, then rising again for the early 20s before steadily declining with age.
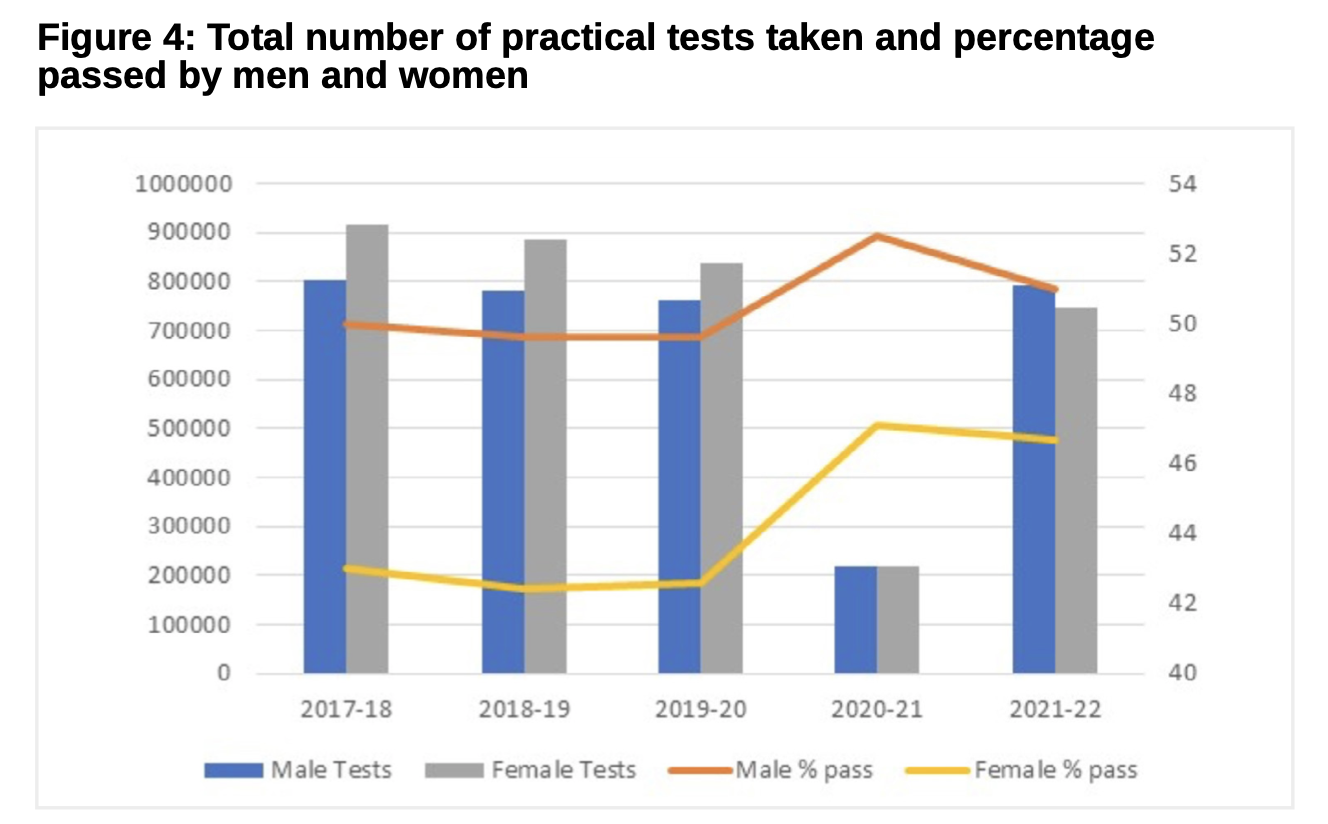
Having passed the theory test, would be drivers can then move on to the practical driving test. The number of these taken is now almost back to the levels pre-Covid, running at around 1.5m a year as shown in figure 4. However, there has been a reversal between men and women, in that before Covid more tests were taken by women than men, but which was not the case in 2021-22.
The proportion of people who pass their practical driving test remains similar to the theory results, at around only 50%, but there is a marked difference in the pass rates between men and women compared with the theory test. Pre-Covid, men had a pass rate at least five percentage points higher than women, and while this gap has declined slightly recently, it remains notable.
As shown in figure 5, the percentage pass rate of the practical test declines with age, so while 60% of those aged 17 or under pass their test, this falls rapidly to under 50% by 19 and down to 40% by your late 30s. The difference between men and women’s pass rates meanwhile increases from just two percentage points for teenagers, to over seven percentage points by the mid-30s.
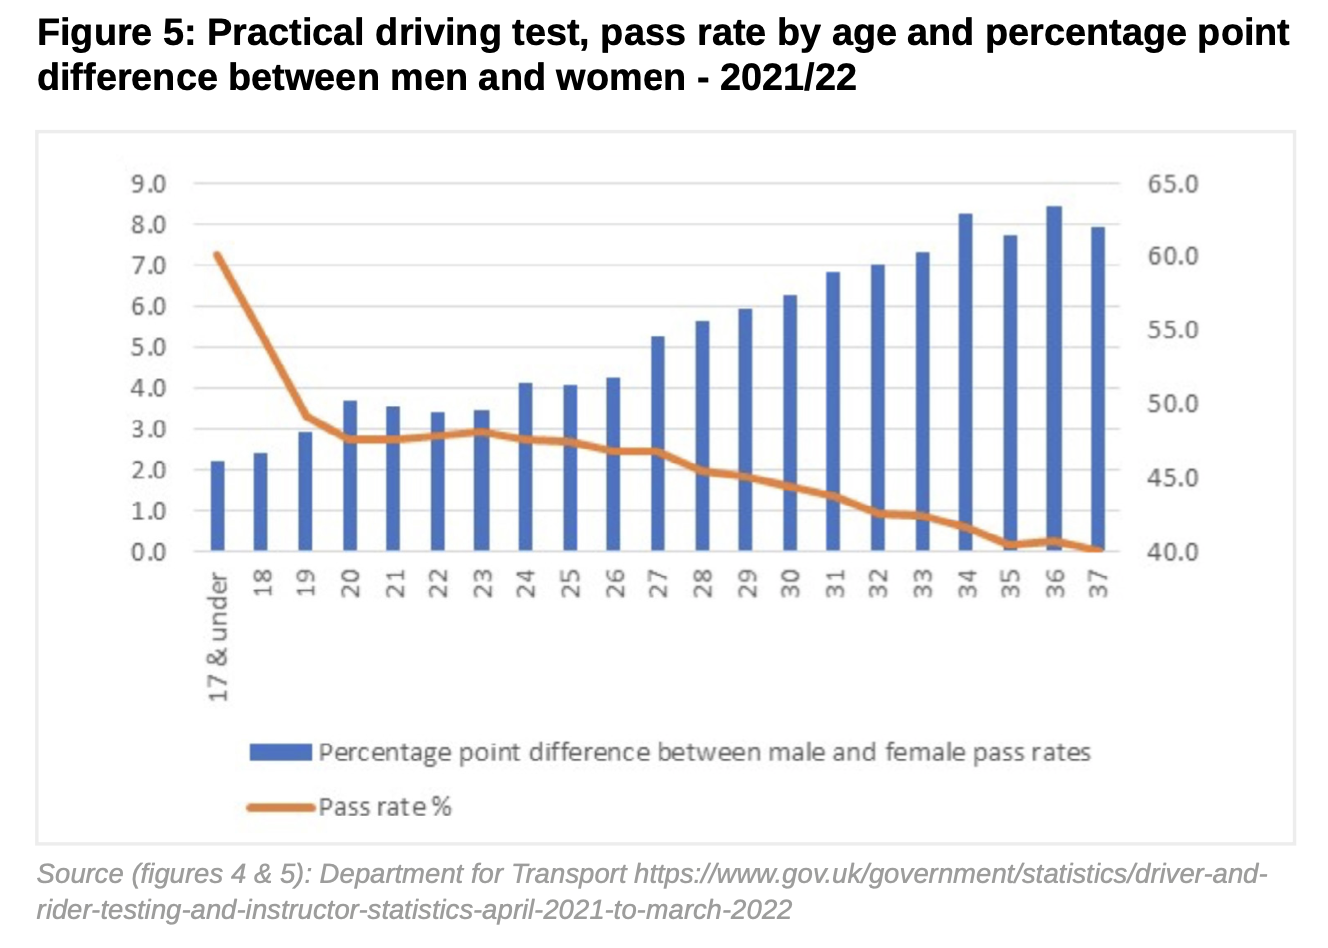
These statistics raise some intriguing questions. The pass rate for younger people is higher than for those who are older, and for the practical driving test it is higher for men than women.
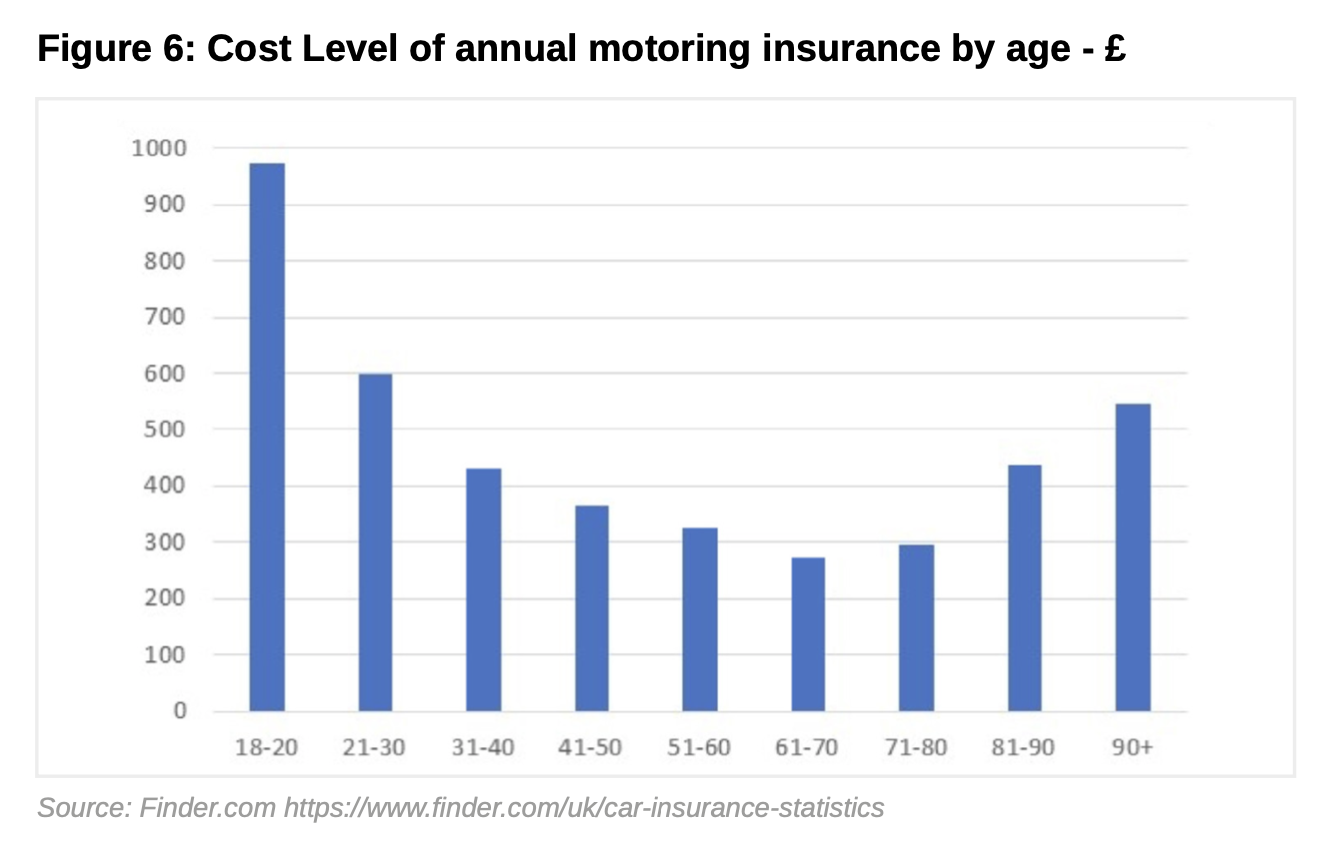
Yet young people have far higher insurance premiums than older drivers - up to three times higher as seen in figure 6. The reason being that the risk of insuring them is higher, as they are more likely to be involved in a motoring collision. So a greater success rate in the test result does not seem a direct match for safer driving in practice.
When it comes to the cost of insurance and claims under it, pre-Covid data from Confused.com reports that over 1.4 million car insurance claims were made in 2018, of which two-thirds were made by men and only one-third by women. To compound this imbalance, not only were men more likely to have a claim, but the associated costs were higher, the average pay-out being £5,557 for claims made by men and £5,150 for women.
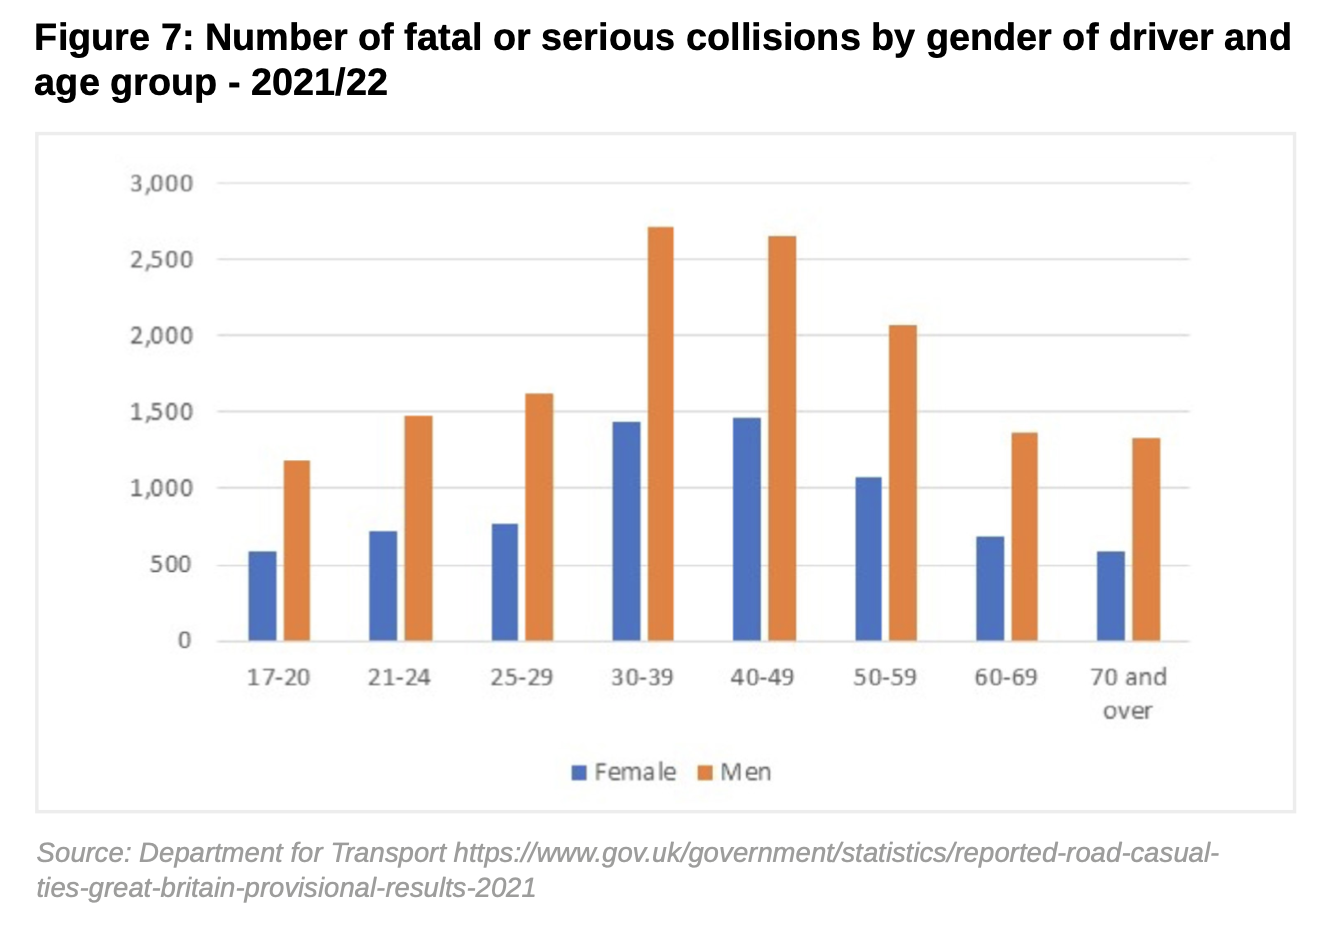
Figure 7 shows the number of fatal and serious collisions involving male and female drivers by age group. For all age groups male drivers are more than twice as likely as women to be involved in a fatal or serious road traffic collision.
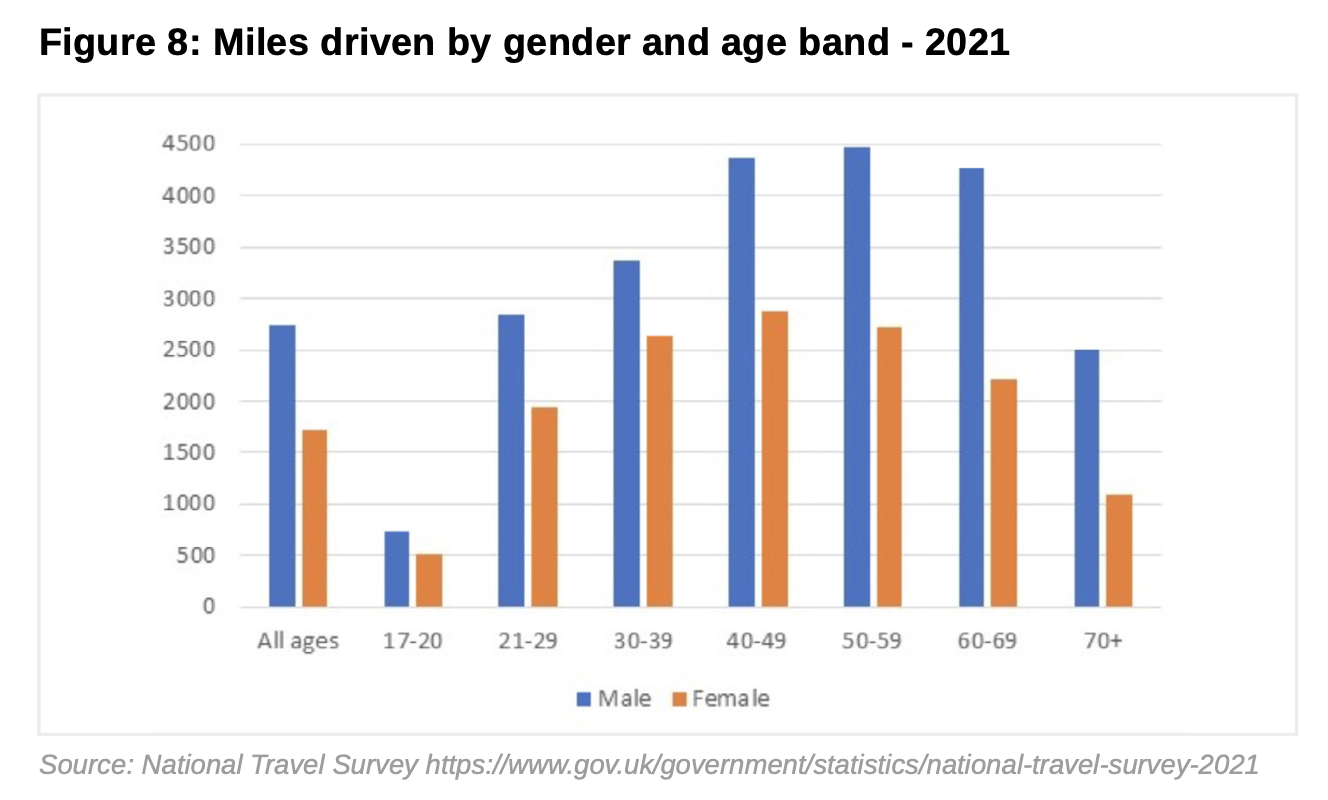
There are a number of reasons for some of the differences outlined above. One is that men do drive more than women - around 60% more miles on average, although this is skewed by the over 50s where the differences are far higher, as shown in figure 8. It is notable that pre-Covid, men and women under 30 drove broadly the same distances.
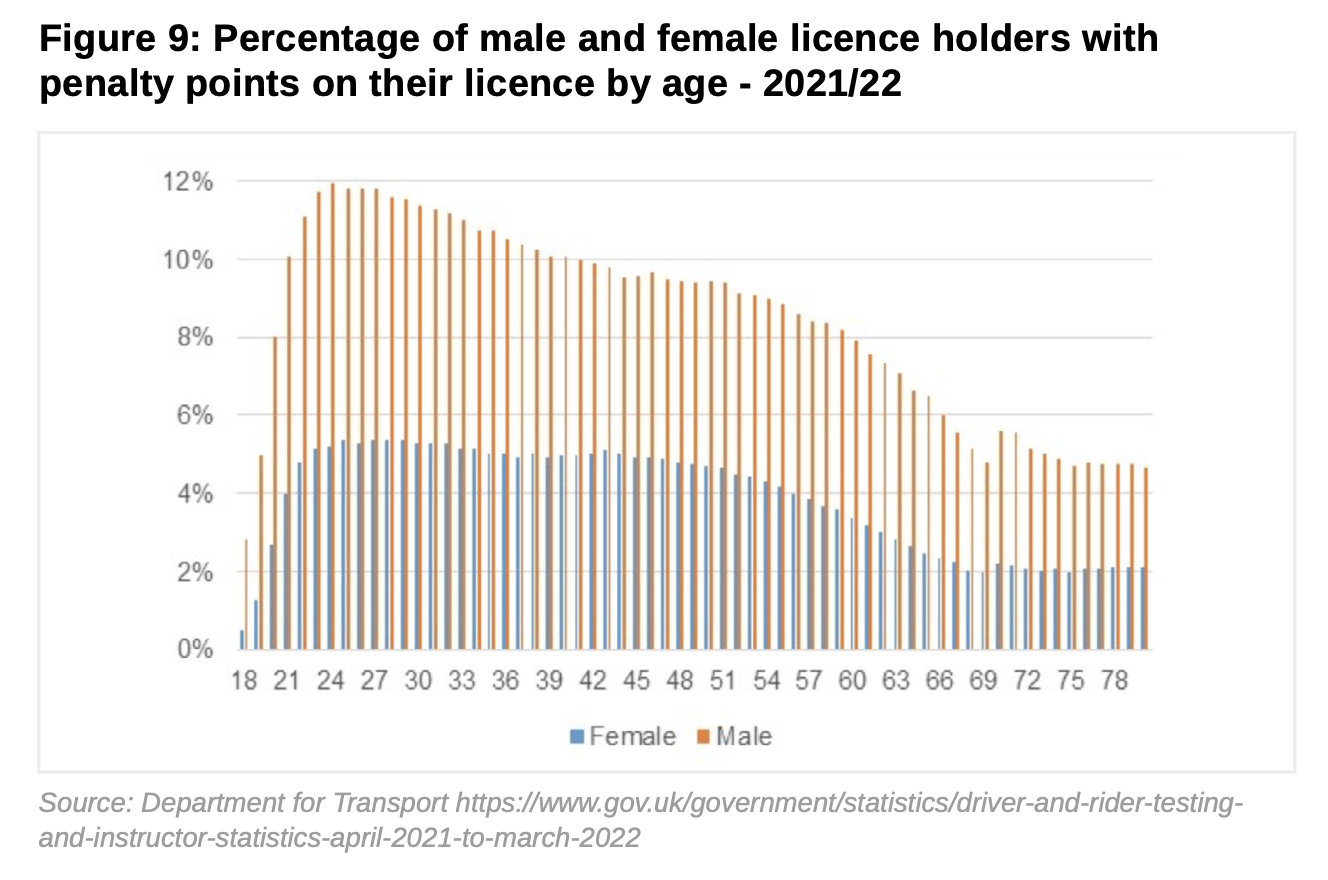
However, this extra mileage does not fully account for the difference in collision rates between men and women. The data reveals that the other major reason is down to men’s worse driving behaviours as revealed by the incidence of them breaking the law. As shown in figure 9, men are twice as likely to have penalty points on their driving licence than women for all ages, with a pronounced peak when in their 20s.
So what can we maybe takeaway from these figures?
It’s fair to say that men have a higher practical driving test past rate than women, but have more collisions, and break the law more often. While younger people also have far more collisions than older drivers, they too have a better pass rate when it comes to the driving test. This might suggest that the present driving test could need some refinement to fulfil its requirement of ensuring only safe drivers are allowed onto the road network. There clearly would seem to be some flawed driving characteristics that the tests don’t fully pick up.
John Siraut is director of economics at Jacobs.
This article was first published in LTT magazine, LTT856, 31 October 2022.
You are currently viewing this page as TAPAS Taster user.
To read and make comments on this article you need to register for free as TAPAS Select user and log in.
Log in