TAPAS.network | 3 April 2023 | Commentary | John Siraut
Elizabeth Line lifts rail passenger numbers back over pre-Pandemic levels – and makes TfL one of Britain’s biggest rail operators

The success of the Elizabeth Line has taken total UK rail use beyond the passenger numbers experienced before the Pandemic struck. It also highlights the dominance of London and the South East for rail travel, and the major role now being played as a train operator by Transport for London – both with the Elizabeth Line and London Overground. looks at this phenomenon, and also explores where the new passengers are coming from
ON A FEW DAYS in late February and early March this year, daily passenger usage of the national rail network exceeded pre-pandemic levels for the first time. While this was cause for celebration across the rail sector, a key reason for this increase in usage was not a national pattern of growth, but a local one due to opening of London’s new Elizabeth Line.
It is sometimes difficult to comprehend the scale of a new rail link, but the map below (Figure 1) created by Director of Automatic Knowledge, Alasdair Rae, helps bring it to life – showing that if built in the North of England, the link originally known as Cross Rail, would stretch from Sheffield to Liverpool. Admittedly, only the central section is completely newly built, but even that is 42km long, which would get you most of the way from Manchester to Liverpool.
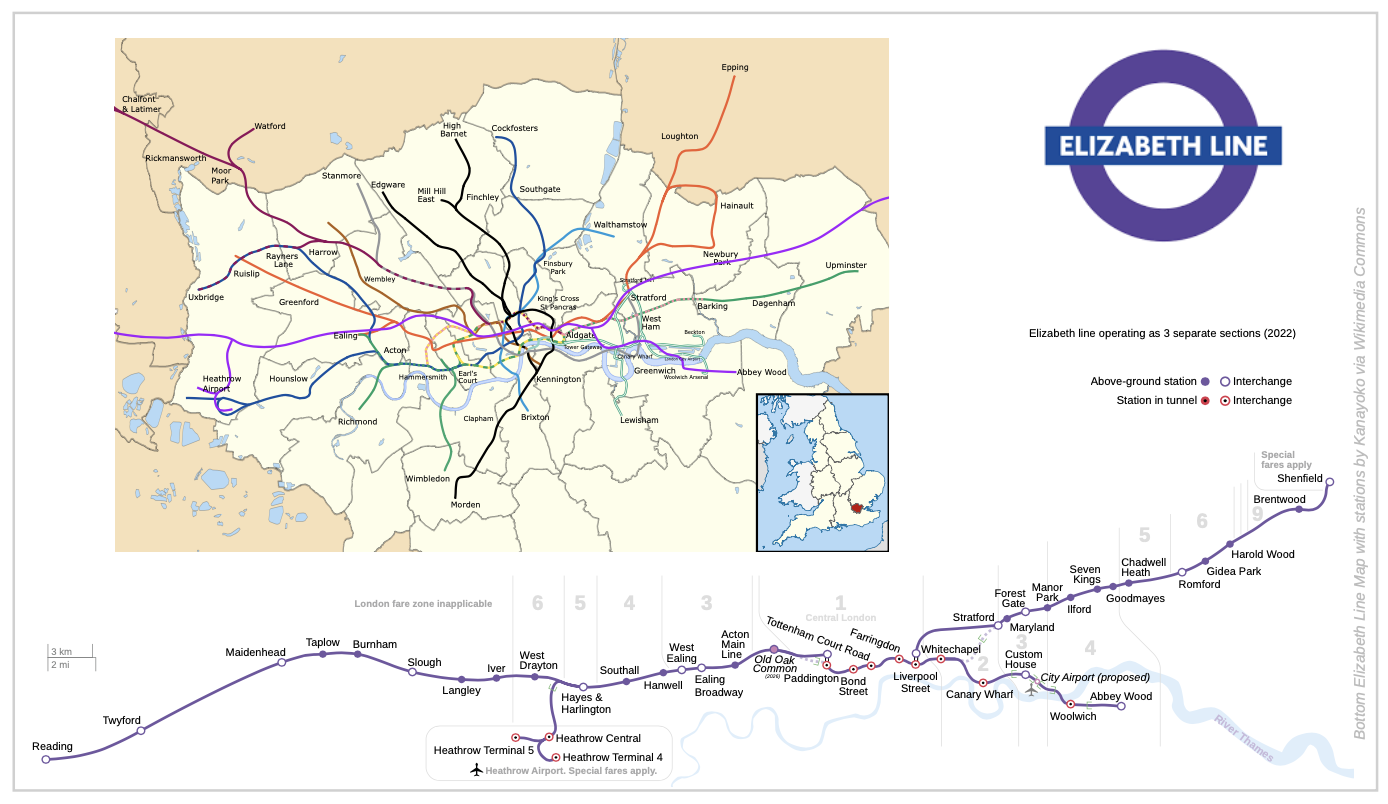
With the actual Elizabeth Line endpoints incorporating erstwhile suburban services extending to Reading in the West, and Abbey Wood and Shenfield in the East, the new line carried more than 100 million passengers in its first eight months since opening last May, many of them transfers from London Underground, but a significant number new to the rail network.

The latest rail usage data from the Office for Rail and Road covers the period October-December 2022. This shows, as can be seen in Figure 2, that the Elizabeth Line is now the second busiest route in the national network in terms of passengers carried, with over 62 million passengers for the period. London Overground was the third largest, with nearly 40 million passengers – which means Transport for London (TfL) is now responsible for carrying over a quarter of all national rail passengers. The five largest London-focused train operating companies (TOCs), including the dominant cross-London ThamesLink network, meanwhile account for over 60% of all passengers.

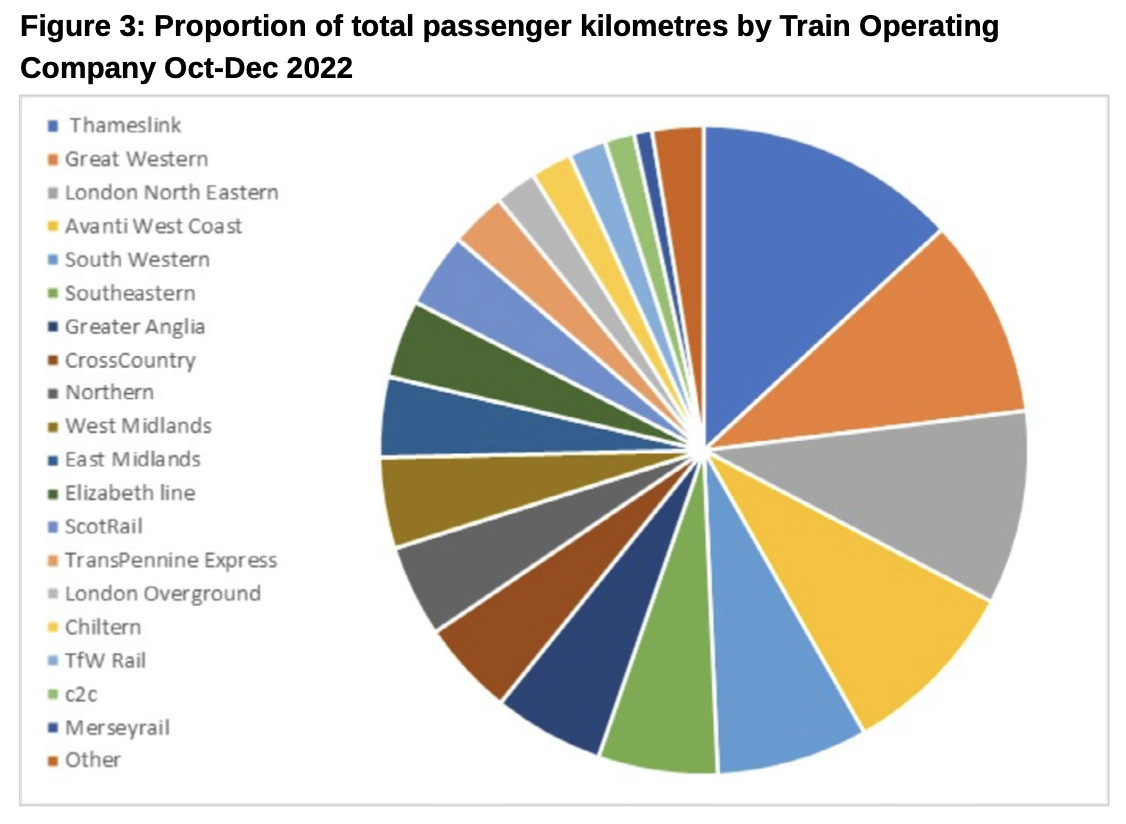
A slightly different picture emerges when comparing passenger kilometres, that is, distance travelled (Figure 3). Thameslink is still the largest TOC, but it is then followed by the long distance operators. While TfL then accounts for just 6% of passenger kilometres.
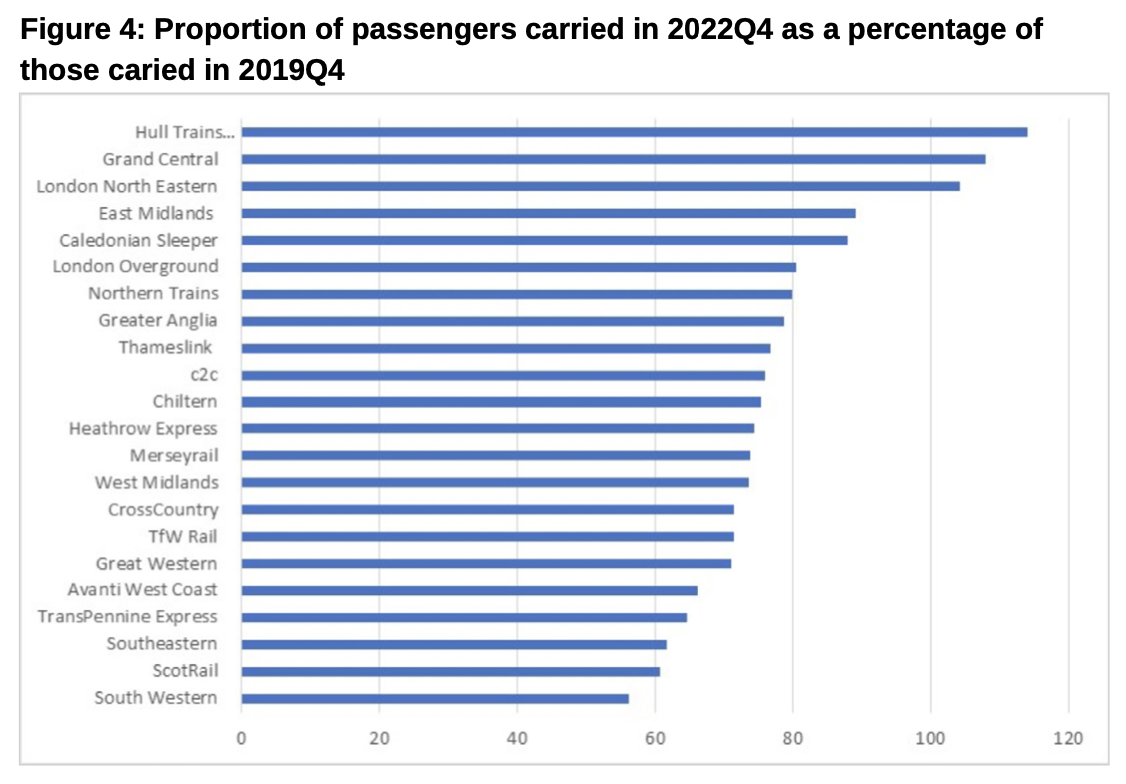
In terms of the rate of recovery of rail passengers since the Pandemic, this varies considerably by TOC. Levels on the East Coast Main Line are now all above pre-pandemic levels, despite – or perhaps because of – another new entrant competing on the route. Both Hull Trains and Grand Central, and London North Eastern have passed their pre-Covid levels. At the other end of the scale are mainly the London commuter TOCs, significantly impacted by the decline in the previous levels of ‘five weekdays’ commuting, and Avanti West Coast and TransPennine, both of which were dogged by high levels of cancellations and reliability issues over the fourth quarter 2022 period.
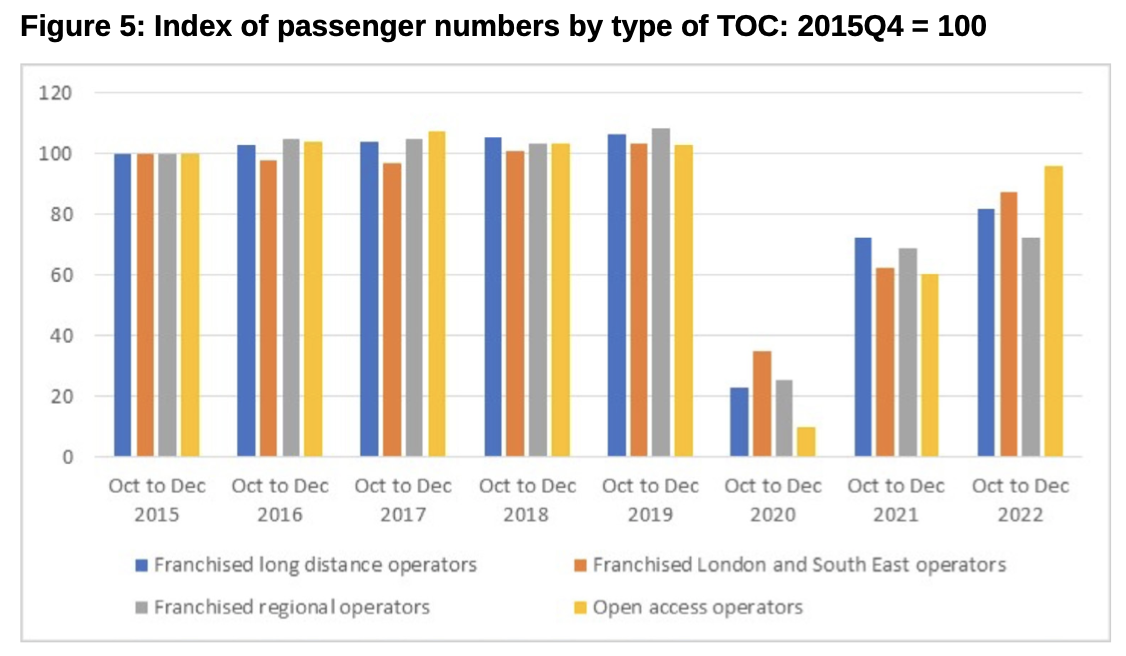
The changing nature of the rail market and the impact of the Elizabeth Line can be further seen in Figure 5. This shows how passenger numbers have changed by type of operator for each fourth quarter since 2015. Between 2015 and 2019, it was the regional TOCs that saw the highest growth followed by the long-distance operators – London and the South East – and finally the open access operators. Coming out of the pandemic, the situation has reversed with the open access operators performing best and regional operators the slowest to recover. However, the opening of the Elizabeth Line saw passenger numbers in the London and South East increase significantly between Quarter 4 2021 and the same period in 2022.
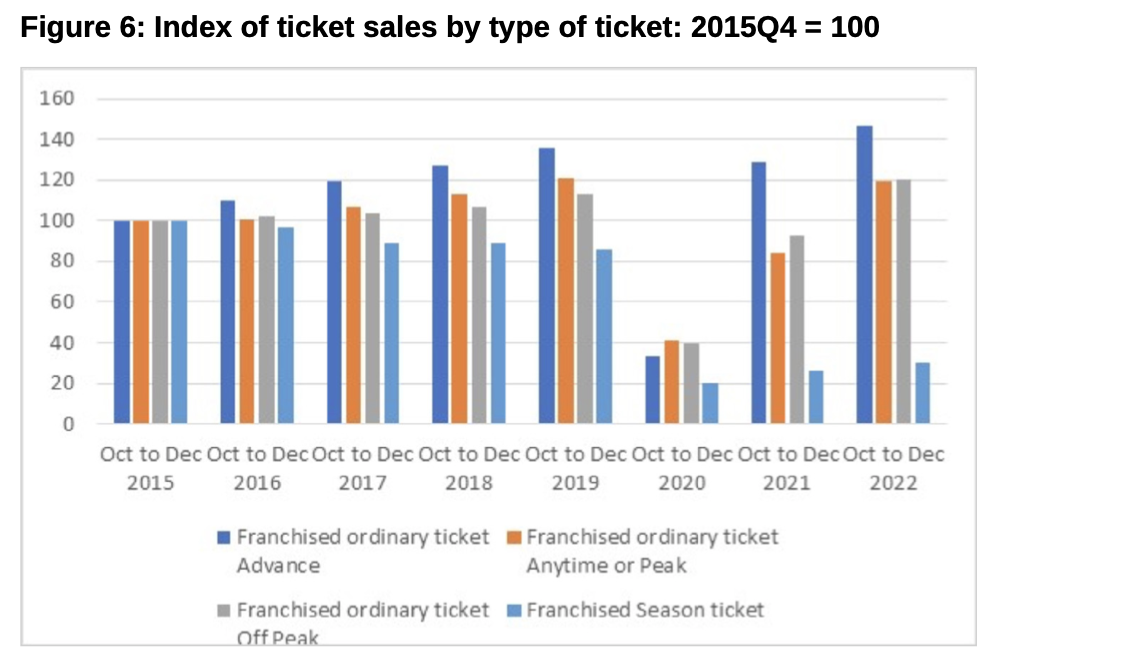
The changing use of the network has meanwhile impacted the type of ticket passengers are using. Use of Advance tickets was growing rapidly pre-pandemic, and has now more than recovered beyond that position, with usage now at record levels. Full fare and off-peak fare ticket sales have also returned to pre-pandemic levels, and are 20% higher than they were back in 2015. Use of season tickets was gradually declining even before the pandemic. In 2019 Q4 they were a further 15% down on the level in 2015 Q4. They are now at a third of pre-pandemic levels, reflecting the massive change in working habits and increased home/office hybrid working, which means planning travel purchasing against five day a week usage is no longer attractive, and thus season ticket buying much reduced.
If regular commuting has changed – particularly into London – the high usage levels of the Elizabeth Line demonstrate that ‘urban rail’ still has a major role to play.
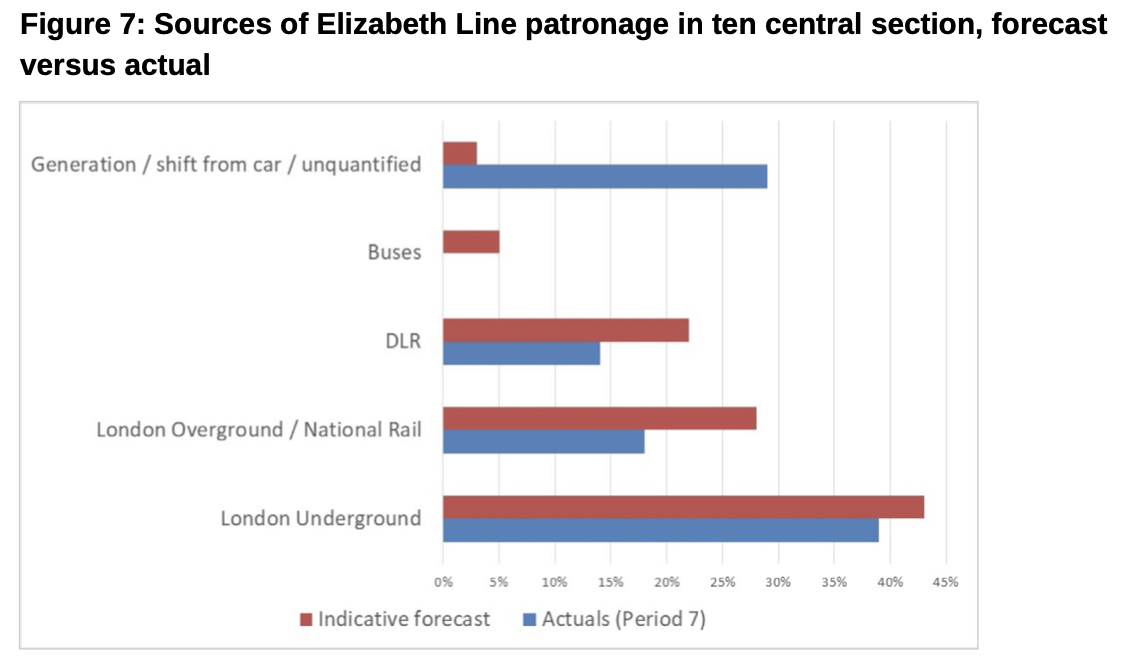
The original modelling for the Elizabeth Line predicted virtually all of its users in central London would transfer from other modes of public transport. It was after all designed to relieve heavily congested parts of London’s public transport network. The reality has been slightly different as can be seen in Figure 7. This shows where demand was forecast to come from and where it did actually materialise. Transfers from London Underground are broadly in line with expectations, but those from National Rail and the Docklands Light Railway are significantly less. Transfers from buses have been cancelled out by more passengers using them to access Elizabeth Line stations especially at Woolwich and Abbey Wood. Instead there has been a significant generation of new trips as the new service makes accessing central London significantly easier from east and west.
The long-delayed opening of the Elizabeth Line has given a big boost to rail use at a time of considerable disruption due to industrial relations and reliability issues elsewhere. It has also made TfL one of the biggest national rail operators, albeit with some switching from the Underground, though if you add that rail system in, TfL is genuinely now Britain’s dominant train service provider and passenger carrier.
References and Links
-
The data reviewed in this article and the charts about rail use can be found from this link
-
The data in figure 7 concerning Elizabeth Line users comes from Travel in London report 15
-
The transformational Elizabeth line clocks more than one hundred million passenger journeys
-
Alasdair Rae kindly provided permision to reproduce his superimposed map of the Elizabeth Line in the North West of England. His spatial data, analysis and training company is at: https://automaticknowledge.co.uk/
John Siraut is director of economics at Jacobs.
This article was first published in LTT magazine, LTT866, 3 April 2023.
You are currently viewing this page as TAPAS Taster user.
To read and make comments on this article you need to register for free as TAPAS Select user and log in.
Log in