TAPAS.network | 8 May 2024 | Commentary | Phil Goodwin
The deep flaws in how we model freight

The treatment of freight movements is an area of serious weakness in transport planning, writes Professor . The assumptions being made are not underpinned by adequate understanding, suffer from a lack of suitable data analysis, and embed misrepresentation of commercial and economic realities. All this seems highly likely to be leading to inappropriate decision-making. An in-depth review is needed, he argues.
I AM WRITING this time about the treatment of freight in transport planning , as I believe there is an urgent need to improve the understanding and forecasting of freight traffic, and the appraisal of measures that impact it. The current widely applied methods- possibly the weakest area of current modelling practice- are inconsistent with accumulated theoretical and empirical evidence, and unhelpful for supporting policy priorities on social, economic and environmental costs and benefits. The possibilities of success in making the much needed improvements are high, because most, perhaps all, of the necessary data and understanding are already available, or can be readily provided.
Current practice
I am sure I am not alone in thinking this way. John Siraut, in Local Transport Today LTT889, also available on TAPAS 9 April 2024[1], recently provided an overview of available data. He pointed out that
“Goods vehicles are often overlooked as an important element of road traffic, especially in urban areas, and even seen as an unwelcome nuisance, though today’s society is heavily dependent on them”.
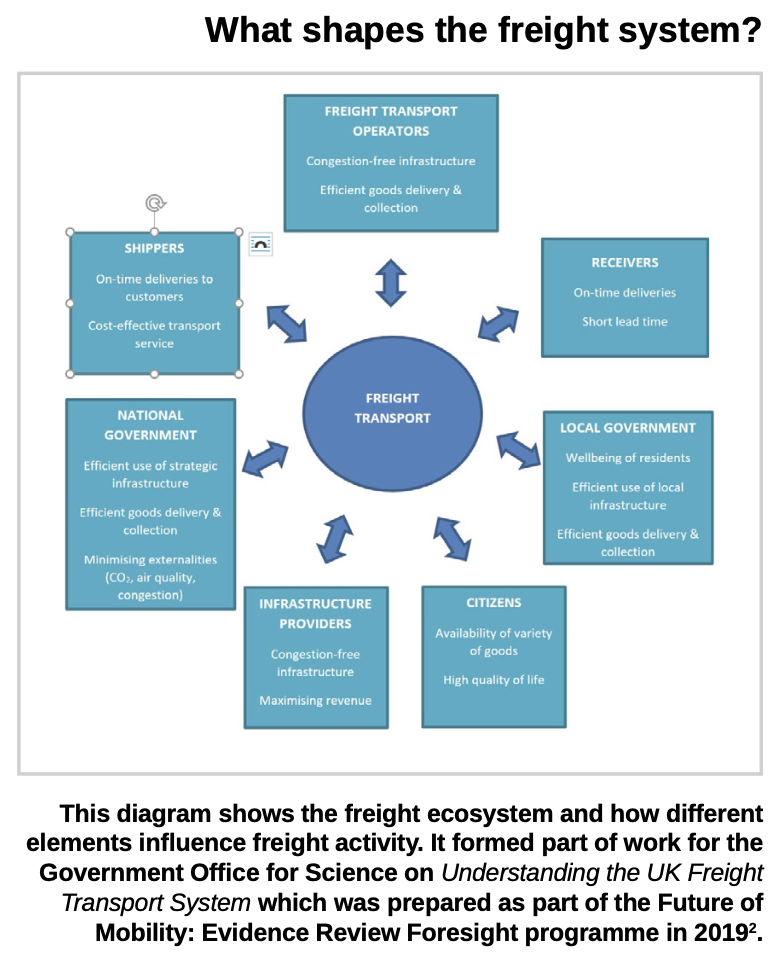
Also, not too long ago, in 2019, the Government Office for Science itself commissioned work specifically on Understanding the UK Freight Transport System which was prepared as part of the Future of Mobility: Evidence Review Foresight programme.
They were right to do so as freight and logistics are highly dynamic sectors of our modern economy, and yet, most surprisingly, are not treated as such in transport planning analysis.
Moreover, at present, there is a profound difference in the analytical approaches most commonly used for forecasting car and freight traffic on the road network. Car traffic is (quite rightly) usually forecast by use of a ‘variable demand’ model which takes into account at least some of the wide range of different choices that travellers can make in response to changes in the speeds or costs resulting from changes in infrastructure, management or transport policies. This advice is formalised in DfT Transport Appraisal Guidance notes, and while implementation is not universal (and the range of sources of variation in demand is far from complete) it is professionally accepted as best practice.
The result is that appraisal of projects and policies can take account of a degree of ‘induced traffic’ stimulated by the provision of additional road capacity or reduction in travel costs, and conversely, a degree of reduction in road traffic produced by a reduction in road capacity, high costs, or the provision of better or cheaper alternatives. There is scope for considering how the costs and benefits of car traffic can shift geographically and socially, but as I will shortly explain, these factors are almost wholly overlooked in the case of freight traffic.
But first, perhaps it is worth reviewing how we shape our thinking on non-freight traffic within our established planning and modelling framework.
This responsiveness of road passenger traffic to changes in infrastructure, costs, speeds and other features of transport provision had been recognised intermittently by research and experience since the 1930s, but practice had often assumed that the only behavioural response to capacity was to change the route of travel[3]. Three decades ago the Department for Transport asked its advisory committee SACTRA to review this, and their report in 1994[4] was the decisive study which persuaded DfT to accept the existence and importance of induced traffic. It defined induced traffic broadly, and established a very wide range of different sources of behavioural change which allowed it to exist.
The study relied on several different strands of empirical, qualitative and qualitative evidence and a large part of its methodology was to consider the consistency of these different strands, each of which showed just part of the evidence. The strands were:
-
Before and after traffic counts on both the improved road and on alternative routes which the improvement had been expected to relieve, both in the short run (typically one year) and long run (often either taken to be five years, or open-ended);
-
Comparison of outcomes with forecasts, both on parts of the network having improvements, and comparable parts which had not been improved;
-
Inferences from studies of the effects of changes in fuel price, in combination with studies of the money value of time savings (or the time value of money savings) making use of theoretical techniques which enabled logical derivation of induced traffic from demand elasticities and time values;
-
Inferences of time use studies looking at the degree of stability of travel time budgets and the implications of this for the use made of travel time savings;
-
Observations of differential growth of traffic levels on different parts, road types and geographical location over time;
-
Interviews of drivers and others about their own perceptions of their responses and preferences for changes in travel conditions;
-
Interviews of professionals about their experience and judgements of the results of forecasts and models of travel choices; and
-
Inferences of separate studies of public transport demand especially focused on choice between car use and public transport use.
Some of the empirical evidence related to personal traffic only, or to total traffic measured in total traffic or PCU counts, and therefore did not distinguish between cars and freight responses. Since then, most reviews of evidence focused on identifying induced traffic have not adopted this multiple source approach, but have focused on before and after traffic counts. This is especially true of National Highways’ Post Opening Project Evaluation (POPE) studies of major schemes, which have mostly used before and after counts for all traffic, not distinguishing goods vehicles.
However, there is a far cruder, unhelpful, and potentially misleading, common assumption in traffic forecasting models about how to model freight traffic. The axiom is that the quantity of freight traffic is fixed in origin, destination, and mode, sensitive in volume to economic conditions but not to transport conditions, and unaffected by infrastructure schemes.
Thus the practice of National Highways in the appraisal of road schemes is that
“There is no change in the number of LGV and HGV trips as these matrices are fixed and so are not included in the variable demand model”.[5]
The premise of the discussion I would like to promote for very necessary new research is that this assumption can no longer be justified, as a closer examination of the evidence – especially that from DfT itself - leads to a different and more soundly evidence-based acceptance of the reality of variable demand responses by HGVs and LGVs. The objective should therefore be to develop a better, measurable, understanding of the nature of these variable demand responses, adapt modelling tools to cope with them, and thereby improve the economic, social and environmental appraisal of changes in infrastructure projects and policy.
The absence in necessary thoughtful adjustment to existing thinking is all the more surprising given the revolution in methodology and practice of supply-chain analysis and the associated planning of distribution patterns that has taken place in recent years.
Developments in theory and practice of logistics have produced detailed, elaborate, evidence-led models of the distribution of goods based on a single supply chain from sources of materials, location and methods of production, warehousing, inventory control, and distribution to the final customer – every aspect of which can be optimised separately and in total. One symptom of that was the merger of the Chartered Institute of Transport with the Institute of Logistics in 1999, to form the Chartered Institute of Logistics and Transport.
Some rather obvious examples of the response of the freight and logistics sector are surely most instructive in this regard. When warehousing is expensive compared with travel (for example when distribution does not have to carry the full social, maintenance and investment cost of road use), there will be an incentive to locate warehouse facilities at greater distances, so we have seen a consolidation of very large distribution hubs each covering a wider catchment area. This is particularly marked for very large distribution companies, using their own facilities, for example Amazon, which employs large teams of highly paid data scientists seeking to optimise every link of the logistic chain, with very elaborate modelling and information systems.
Such companies are noted for the use of highly significant (and speedy) optimisation methods for determining the sequence of drops, and routes between them, which can achieve the maximum number of deliveries at the minimum cost – the modern example of the classic ‘travelling salesman’ problem. This exists in different forms according to circumstances. A large, efficient company delivering an identical product to a standard set of addresses (eg from a baked bean processing and canning factory to a well established set of shops and supermarkets), will be keenly aware of variation by day of the week or season, and seeks the optimisation of the use of its fleet of lorries, sensitive to longer terms trends and even day to day variation in traffic conditions.
This is different in the case where a distribution hub is collecting and delivering a different set of products and to different addresses every day, or where the deliveries are booked in advance: eg the activities of the likes of Amazon, Ocado, and the home delivery services of specific supermarkets eg Tesco, Sainsburys, Waitrose or Asda. All of these have national and generic coverage; or for cases of a local distribution network of local services and products, such as fresh vegetables or organic meat, or local coffee roasters, or national coverage of specialised niche products, such as Pasta Evangelists, or local activities such as Just Eat and Deliveroo, now joined by Uber which is using its network of cars to distribute local restaurant food to local home addresses; and the new growth of bicycle based deliveries from local fast food outlets to surrounding streets. Since every day will have a different set of addresses, in a different order, the decisions have to be taken in real time, with a mixture of modelled algorithms for the big players, and intuitive ad hoc methods using many delivery vehicles responding to calls, in a quasi-perfect competition of small operators.
The key point is that there is now a rich jungle of operations, such that the market for distribution services is very swift, fleet of foot, and able to fill any new niche – or new traffic conditions – with speed and a tendency towards optimisation. But that appears in two quite different ways – explicit models using scientific optimisation for big companies in imperfect competition, and intense competition by many small local suppliers, where the ‘optimisation’ process is business success and failure. Together, it is absolutely normal for every change in the traffic conditions, due to road works, charging, or infrastructure provision, to trigger changes in practice aimed at maximising the advantages to suppliers. There is therefore also an inevitable tendency to cause social costs in all cases where they are not charged for, and on occasion, to deliver social benefits even where they are not rewarded.
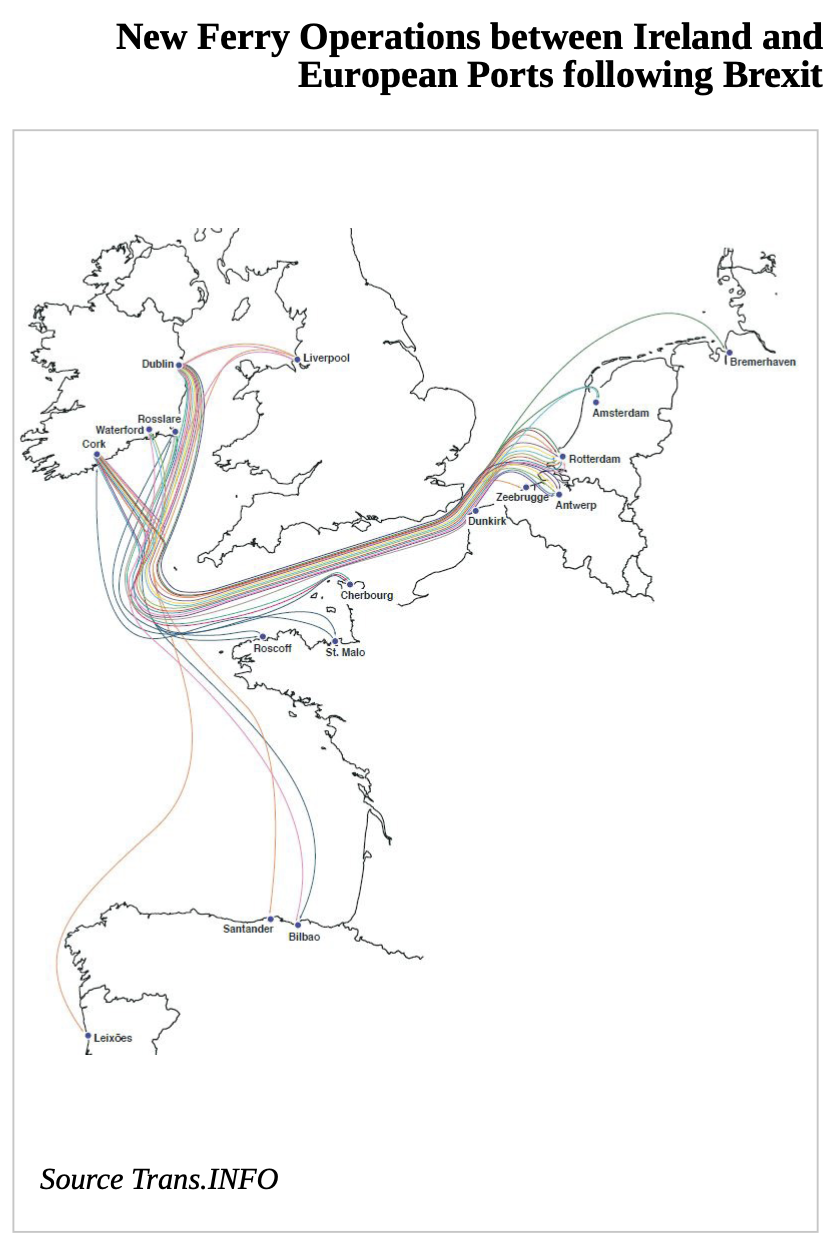
Taking a longer term view, there are predictable (but often ignored) developments in response to environmental, economic or political changes which re-educate us about the inevitability of trends. One example of this is the very swift post-Brexit development of ferry services providing links between Ireland and the rest of Europe to replace the ‘land-bridge’ across Wales and middle England as a route for roll-on roll-off or container lorries – a direct response to changing the administrative, taxation and other costs of travel[6] (see map).
Another example is the prospective disappearance, with the switch from fossil fuels to electric power, of a single particularly important category of hazardous freight transport, namely the shipping of petrol and diesel from port to filling-stations, or in pipeline, and its replacement by a combination of power distributed by grid from power stations and from rooftops or gardens by solar, air-to-air, air-to-water or water-to-water on-site conversion.
On the interface between freight and personal transport, nearly 20 years ago, Sally Cairns (2005)[7] wrote
“Car travel for food and other household items represents about 40% of all UK shopping trips by car, and about 5% of all car use. In the past 10 years, there has been an extremely rapid growth, albeit from a very small base, of home delivery services for such shopping… The evidence suggests that with realistic levels of take-up, a direct substitution of car trips by van trips could reduce vehicle-km by 70% or more. More complex shopper behavioural responses will occur, but, according to available empirical evidence, overall traffic reductions are still probable. Meanwhile, the benefits of services could be maximized by use of appropriate cost structures, new types of delivery location, less polluting vehicles, greater cooperation or out-sourcing by retailers, and measures to encourage greater consumption of local produce.”
Some of this has already happened. The previously assumed ‘norm’ was large lorries filling the supermarket shelves, with the final distribution to homes being carried out by the privately owned cars of individual shoppers.
Now, an increasing proportion of the total vehicle miles may be those generated by a fleet of medium size or large delivery vans, many of which never actually go near a retail store at all, but collect their order-picked loads direct from the warehouse, and deliver them to homes on optimised routes as described above. And we can add in to this changing mix the shoppers by bus, bicycle or on foot, who may be making more frequent local trips with smaller packs of shopping, and the home delivery flows by Deliveroo, Just eat and Uber Eats. Plus a small but growing ‘cargo bike’ sector which manages to take very heavy loads by a human (and increasingly electric) - powered bicycle mode, for reasons of poverty or adventure, with employment practices suitable for one-person, one vehicle, operation, though increasingly becoming an ‘industry’ in its own right.
Now the point of all these, taken together, is to render completely unrealistic the aforementioned National Highways proposition that “There is no change in the number of LGV and HGV trips as these matrices are fixed and so are not included in the variable demand model”. Rather, we have tangible evidence of features of variable demand analogous to that of cars - shifts in modes used, geographical location, routes, and miles travelled. In fact this is probably more explicitly organised for freight transport, where cost optimisation rules the day, than it is for personal travel where motivations are more complex.
‘Freight’ is not well described by ‘LGVs and HGVs’
At the same time, the presumption that standardised, easily-recognised, light goods (LGVs) and heavy goods (HGVs) together define ‘freight’, is also inconsistent with some of DfT’s own evidence from analysis three years ago on what the much more substantial parc of LGVs – ie vans - are actually used for, as shown in the following figure.
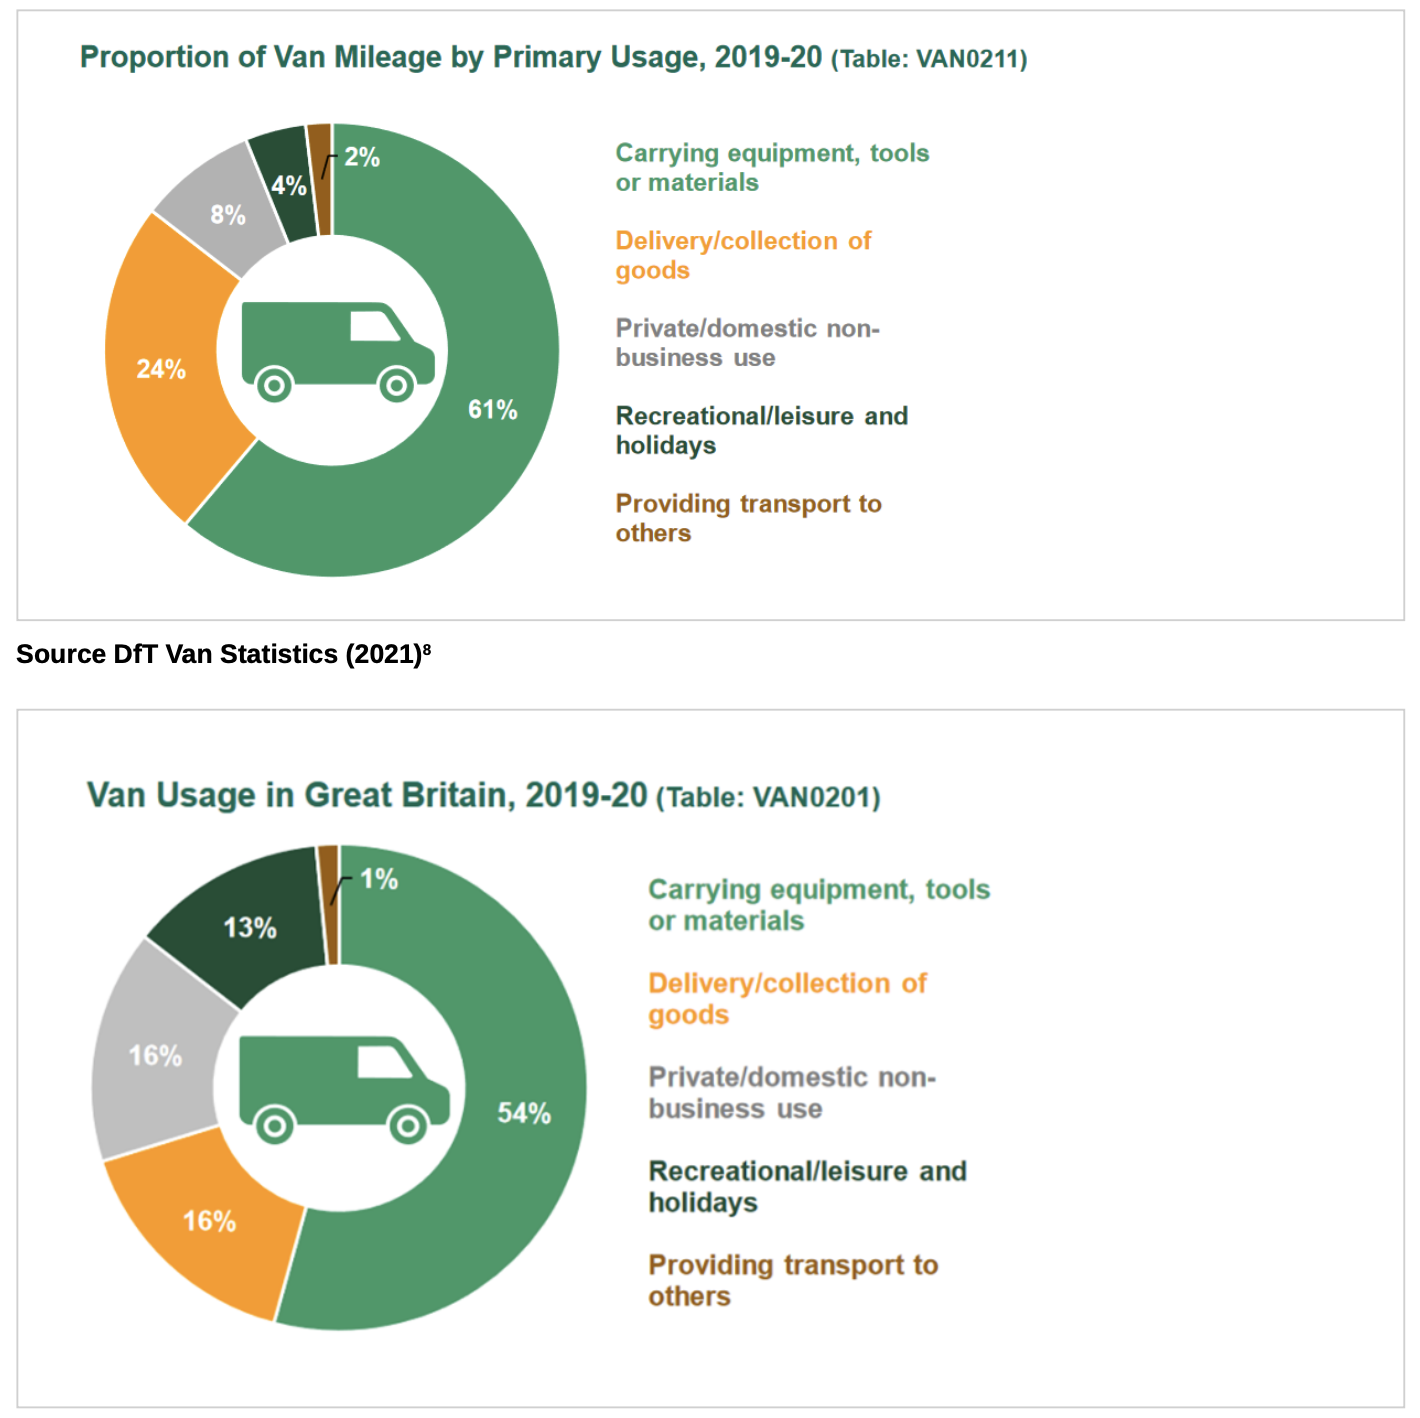
If we compare this split by mileage with the corresponding split by numbers of LGVs owned, we see that not only is the ‘carrying equipment, tools or materials the largest, but it also travels proportionately a greater share of the mileage.
In order to embrace this complexity, we quite certainly need to find ways of modelling variable matrices of ‘LGV and HGV’ trips, but also acknowledge that the pattern of those responses will be different between heavy lorries and vans - and within both categories too. As an interim measure, it looks, from the variety of uses, that vans would be better treated in the same way as cars,- particularly cars used for ‘employers business’ purposes. Overall, we will need models which are specifically directed towards the phenomena described above, of a multiplicity of different ways in which LGVs are used, partly driven by formal optimisation procedures focussed on commercial gain.
The most important question then is: what evidence is there on how large such effects might be?
Evidence of Freight Elasticity of Demand
There is a long tradition of econometric work on the response of goods traffic to changes in money cost, especially fuel price. An overview of the results of such reviews was published ten years ago by the DfT in a report on Road Traffic Demand Elasticities[9]. Its overall conclusion was that
“the elasticity estimates are reasonably consistent, in the range 0.1 to -0.2 for the fuel price elasticity of demand in tonne-km and in the range -0.25 to -0.4 for the fuel price elasticity of demand in vehicle-km.”
The authors comment that these figures for the sensitivity of goods traffic to price are broadly similar to those found for the sensitivity of passenger demand to price.
The significance of this finding for transport modelling and appraisal is that the dominant forms of demand model deployed by the DfT use a framework of generalised costs such that responses to money costs and time costs are connected by the value of time, so
If the volume of freight traffic is sensitive to fuel price, the conclusion can be firmly drawn that it must also be proportionately sensitive to journey times.
To reject such a relationship would undermine a central feature of the economic appraisal and would cast doubt on all the values of time savings.
There is meanwhile a difference between short-run and long-run elasticities, reported by SACTRA (1994)[10] and in subsequent econometric analyses by Dargay) that the long-run induced traffic is about twice the size of the short-run. This would be consistent with the idea that distribution companies can make use of their time savings to develop new markets, but it takes time for the adjustment to develop. An interesting hypothesis would be that distribution companies are able to shorten the time scale of adaptation from ‘short run’ to ‘long run’, because of the clarity of their objectives.
One of the sources used by the elasticities review cited above was a larger scale annotated review of over 70 empirical studies in European countries by De Jong et al (2010)[11], which suggested an overall conclusion of average elasticities as shown in the table below.
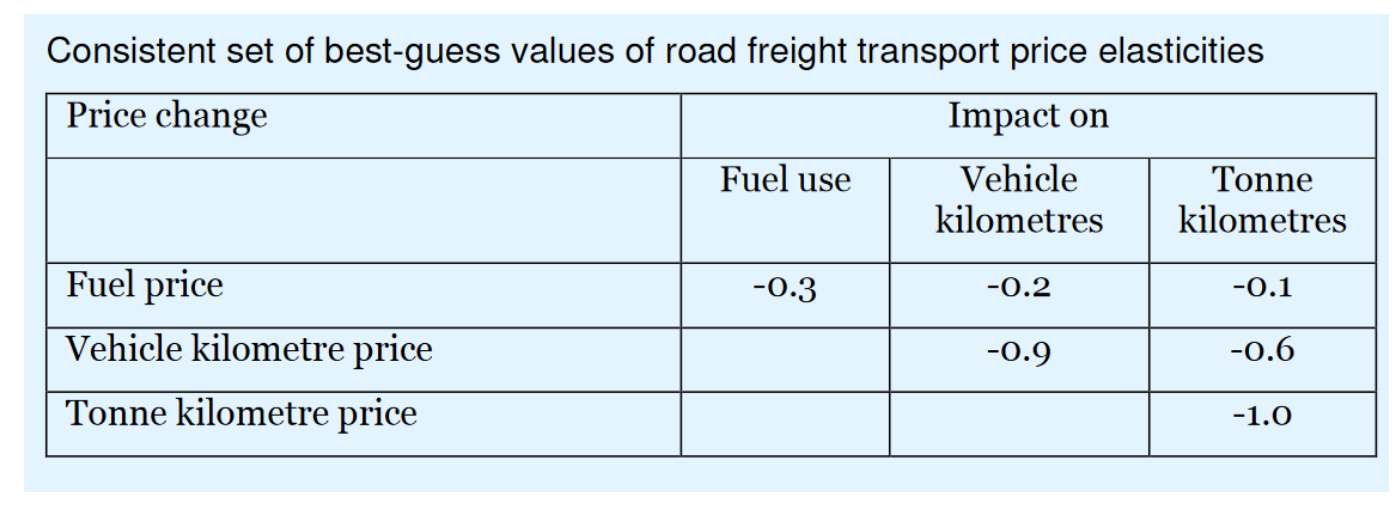
In this study, the elasticities were related to the response mechanisms which could be distinguished for the effect of a change in the price of road transport on road transport demand, consistent with (but broader) than those identified in the SACTRA 1999 study. They listed:
Changes in fuel efficiency
1. Using more fuel efficient vehicles
2. Improving fuel efficient driving
Changes in transport efficiency
3. Improving the load factor (the amount of goods measured in tonnes, divided by vehicle capacity) by:
a. Optimising the allocation of vehicles to shipments
b. Consolidating shipments originating from the same company
c. Consolidating shipments originating from several companies
d. Changing the number and location of depots, including consolidation and distribution centres
e. Getting more return loads to reduce empty driving.
4. Changing route and time of day
5. Increasing the shipment size
Changes in transport volumes
6. Changing mode: substitution to and from rail, inland waterways, sea and air transport
7. Changing production technology (affecting the weight of the goods, e.g. trends towards lighter products).
8. Reducing kilometres per tonne:
a. Changing the choice of supplier or the geographical market size of the supplier
b. Changing production volumes per location
9. Reducing demand for the product.
The indicative evidence suggests the nature of responses which are economically sensible, and the empirical evidence helps identify on their strength. This is sufficient to make the case that the models need to be improved to take account of them.
This list of potential response mechanisms is broadly consistent with the review for DfT by SACTRA (1999), Transport and the Economy[12]. Its chapter 5 How Firms Respond to Transport Changes, cites evidence provided by Mckinnon, Ernst and Young, Mackie and Simon, European Logistics Comparative Survey 1989, he Freight Transport Association, Mackie and Tweddle, McKinnon and Woodburn (full extracts and citations listed in the report).
These two paragraphs point to the most significant findings:-
5.28 Just over 20% of the firms surveyed by Ernst and Young (1996, p18) reported that changes in their use of transport as a result of new or improved transport had led (with varying degrees of significance) to wider business benefits. Benefits claimed varied between:
Ability to access new markets;
Increased sales;
Relocated activities;
Improved staff punctuality;
Increased size of labour catchment areas; and
A decrease in stock held.
5.29 Mackie and Simon (1986), in examining the industrial impacts of the Humber Bridge, state that three quarters of the firms in their study claimed they were able to utilise their savings productively. The cited operational effects of the bridge were:
Vehicle re-routing;
Increased vehicle utilisation;
Improved market penetration;
Increased market area; and
Internal rationalisation (ie, changes to the number or size of depots).
How to improve our recognition and treatment of the data described?
The observations I have made here are intended as a prompt for a substantial, serious research and development effort to bring the forecasting of LGV and HGV responses to transport cost and speed changes up to at least the standard of best practice analyses of car use, and apply these consistently to appraisal.
I would suggest such a study should be carried out professionally by specialists with modelling skills, a familiarity with appraisal principles, and experience on HGV and LGV data sources. One rather obvious modelling strategy would be to build on the methods used to model variable demand for car traffic, namely a hierarchical trip generation-distribution/mode choice, route assignment/ timing model, finding analogous formulations of heavy and light lorries. That would require professional teams well versed in the present dominant models, with the addition of specific freight knowledge. The other strategy would be to make use of the fact that goods distribution is now provided with its own detailed modelling expertise using operation research and optimisation processes, so one could use elements of two different modelling traditions in the same framework. I do not prejudge that choice, nor the merits of a much wider overhaul of the modelling framework as a whole, for example, on agent based, simulation methods.
It would surely be useful to treat this task not as a purely intellectual process, but also in recognition of the existence of many interested parties, including the main professional institutions (CILT, CIHT, ICE and TPS), and in contact with some sort of ‘reference group’ of interested parties such as those who would expect to give evidence to Public examination of road schemes, or Parliamentary Committee inquiries. It would clearly be useful to have support from the Department for Transport and interested Local Authorities, who are the most immediately obvious funding sources, though independent transport related funding bodies, such as Rees Jeffreys Road Fund, and Foundation for Integrated Transport will also be potentially relevant. As might current discussions on a new research fund.
In any case, this work should feature a degree of independence of judgement such as that which SACTRA was able to bring to its advice on similar issues. My own view would be that it would benefit from having more than one source of funding, with deliberate encouragement of more than one strand of strategy for implementation. It should also follow good practice of non-anonymous, published, peer review; have transparency of documentation; involve a wide discussion among several different communities of scholarship; and – long discussed but never implemented – be based on open access for suitably qualified interested parties to be able to use the models themselves.
Work of this kind, will, of course, take time. Meanwhile it seems inevitable – and essential - that current practices in the modelling for LGVs and HGVs will continue to underestimate induced traffic, and therefore underestimate the resulting growth of congestion and environmental impact from highway projects. Whilst this continues it will bias the results of appraisal until it is set right, which suggests the need for some more immediate ad hoc adjustments that can be made, to compensate for any bias. This should be done pending the necessary revised model development.
Addressing these issues I have raised will also affect the recent tendency to rely more on wider economic benefits, especially agglomeration, to provide sufficient benefits to justify projects. In this there is a serious problem of consistency. If indeed it were true that the demand for LGV and HGV movement were unaffected by infrastructure provision, then the prospective wider economic benefit of agglomeration would arguably have no effective route for delivery, since it depends substantially on changing location decisions, and by converting increases in identified potential productivity into the fruits of actual addition production and activity. Productivity increases while production is fixed, must in contrast, be inevitably associated with reductions in employment, with its own effects on levels and location of travel.
A broader review of the interaction of goods movement with agglomeration and wider economic effects would also need to take on board two different relocation processes: closer to an improvement, which would have an effect on local congestion; and in the opposite direction, ie away from the improvement (to optimise market access and catchment areas). This would have the effect of reducing agglomeration and potentially increase the wider economic costs of sprawl.
Uncertainty and Alternative Scenarios
There are some bigger uncertainties which can be addressed in the same way as the DfT’s common analytical scenarios. One major issue is that the role of rail freight is itself politically uncertain, with renewed potential for rethinking it entirely. It is clearly important if there is reexamination of the potential for mode switching. Rail passenger demand is subject to its own manual (which, unlike DfT TAG notes is not published free but requires expensive subscription, has a different tradition of demand analysis with a stronger elasticity base, and in recent years investment in rail freight has not had the priority it may now deserve.
More broadly, there are contradictory social trends in the interaction of vehicle design, housing, retailing, and delivery. At one extreme there is some advocacy of nearly automatic drive-in retailing centres, which seems to sit well with motor manufacturers encouragement of bigger and bigger cars. This would accelerate the disappearance of in-home garages and require more kerb space - or pavement space - for SUVs. At the other extreme, we would see a further reduction in car use for the last stage of goods distribution, and more specialist skills bought in for installation: flat-pack furniture now is partly collected and assembled by residents, and partly delivered by vans and assembled by one or two person teams requiring only three of four tools and taking a quarter of the time or less. This involves new local employment with very little transport needs. The experimental role of delivery by robots or drones could be transformative, or short-lived gimmicks.
All such the issues discussed can be logically considered if demand is accepted as variable- but not if demand is assumed to be fixed.
The case for a new look at how we calculate, model and calibrate the economic impacts of freight traffic, and how they change and why, is surely overwhelming.
References and Links
-
The origin of this practice is unclear, but it is in part due to a misunderstanding of Wardrop’s classic formulation of the theory of traffic flow, where this assumption had been used as a stage in the mathematical derivation of speed and flow calculations. It was never proposed as a full description of drivers’ choices. See Wardrop J G (1952) Some theoretical aspects of road traffic research, Institution of Civil Engineers.
-
SACTRA (1994) Trunk roads and the generation of traffic, DoT, most conveniently available in full at https://bettertransport.org.uk/wp-content/uploads/legacy-files/trunk-roads-traffic-report.pdf
-
In their submissions for the Lower Thames Crossing, National Highways attributes this to DfT TAG guidance, saying that: “TAG Unit M2.1 sets out that LGVs and HGVs do not experience variable demand as their journeys are driven by commercial needs, and therefore remain consistent between the Do-Minimum and Do Something scenarios.” This is from National Highways Submission 9.10 Post- event submissions July 2023 https://infrastructure.planninginspectorate.gov.uk/wp-content/ipc/uploads/projects/TR010032/TR010032-002966-National%20Highways%20-%20Applicant’s%20submission%20of%20documents%2064.pdf Paragraph A3.10 page 49. However, these words do not occur in the TAG guidance, which has a more nuanced description that such a practice is ‘often done’, significantly less than a recommendation.
-
Source Trans.INFO https://trans.info/en/yet-more-growth-in-shipping-routes-between-ireland-and- european-mainland-258036 see IMDO Ireland as at October 2021 in https://twitter.com/dfatirl/ status/1447570154221678609/photo/1
-
SACTRA (1994) Trunk Roads and the Generation of Traffic, Department of Transport, conveniently accessed at https://bettertransport.org.uk/wp-content/uploads/legacy-files/trunk-roads-traffic-report.pdf
-
Schroten A, Van Essen H, Otten M, Bucci P, (2010) Price sensitivity of European road freight transport – towards a better understanding of existing results, Transport & Environment Report 9012-
-
SACTRA (1999) Transport and the Economy, DfT Archived and also conveniently available online at https://www.ffue.org/wp-content/uploads/2016/08/SACTRA_Full-report.pdf
Professor Phil Goodwin is Emeritus Professor of Transport Policy, University College London and University of the West of England. He was head of the Transport Studies Unit at Oxford University for 16 years, before moving to UCL in 1996.
This article was first published in LTT magazine, LTT891, 8 May 2024.
You are currently viewing this page as TAPAS Taster user.
To read and make comments on this article you need to register for free as TAPAS Select user and log in.
Log in