TAPAS.network | 18 September 2024 | Commentary | Devon Barrett
Bus Connectivity Assessment: a new element in the transport planning toolkit

A new tool to assess local bus connectivity has been created in response to the Department for Transport’s requirements for ongoing Bus Service Improvement Plans by Local Transport Authorities. , CTO of Podaris, led the project at the transport planning and analysis software company. Here he describes how the tool was created to produce bus network connectivity metrics and discusses the need for continual refinement and increased discussion about what the concept of connectivity should measure.
IN THE FIELD OF transport planning, there has recently been an increased focus on measuring current and desired levels of connectivity to assess system performance and inform policy objectives. This work has benefited greatly from the latest data analysis and presentation techniques, made possible by deploying an ever-expanding digital capability and capacity.
The Department for Transport (DfT) – alongside consultancies, researchers, and some of the larger individual transport authorities – have been researching this area for a number of years with respect to both road and rail networks. In early 2024, it was reported that the DfT had won the Evaluation and Analysis category in the 2023 Civil Service Awards for the Department’s new Connectivity Model. However, although mentioned in a number of DfT documents over the past ten years, little has so far been revealed on how the model has been developed, and any plans to use it have not yet been officially released (LTT 883 9th January 2024).
In January, the DfT asked all 79 of England’s Local Transport Authorities (LTAs) to submit Bus Connectivity Assessments (BCAs) under new guidance on bus policy and Bus Service Improvement Plans (BSIPs), emphasising the importance of connectivity measurement, but not offering its own tool for this purpose. The newly introduced assessment was described as a process to identify the best bus network to meet connectivity objectives at varying levels of public funding support, and in particular, the submission and evaluation of BSIPs. By association, this also included the expected identification of transport needs, objectives, and shortcomings in the next generation of Local Transport Plans.
It is not really yet clear what precisely the Department is trying to achieve by this new requirement placed upon Local Transport Authorities relating to their bus networks. As an LTT editorial commented at the time it was issued, “This after all, is not an assessment based on actual proposals to see if they are value for money, nor to support the implementation of a master plan approach underpinned by an appropriate available budget,” (see https://tapas.network/48/stonham.php).
It will be interesting to hear what the DfT has made of the BCA information it has now received.
The LTT editorial added “It seems there may have been Treasury insistence that monitoring of the benefits of the substantial sums now being provided for bus support should be undertaken by the DfT, perhaps explaining the £2.2m contract it has awarded to Ernst & Young for assessing the BCA concept and collecting other bus sector management information.” (LTT 884 23 January 2024)
Either way, due to these decisions, English Local Transport Authorities had only a few short months to update their BSIPs, with the inclusion of the new Bus Connectivity Assessment requirements. Each authority was required to provide the DfT with detailed data and analyses of their local bus services to give an “understanding of the current bus connectivity across the country and identify trends in the data”. Commercial operators have meanwhile been expected to comply with the bus connectivity assessments submitted to DfT at regular intervals, under guidance to be communicated by the Department.
What The DfT 2024 Bus Service Improvement Plans Guidance to Local Authorities and Bus Operators said re BCAs
“In Spring 2024, Government will ask all LTAs to submit bus connectivity assessments (BCAs). BCAs are process to identify the best bus network to meet bus connectivity objectives for the local transport authority (LTA) area at varying levels of public funding support.
They will be completed annually, led by the LTA working closely with from bus operators, to feed into the LTA’s budget setting process. As part of this process, operators and LTAs will be expected to report on a range of issues, including but not limited to:
-
Connectivity: assessment of the connections of the LTA’s bus network between employment, leisure, services and residential locations, and the costs associated with maintaining and improving that connectivity;
-
Patronage: actions taken to grow patronage;
-
Types of Service: percentage and cost of tendered services, numbers of zero- emission buses, DRT services;
-
Innovation: innovative approaches to growing revenue;
-
Funding: annual transport budget and use of specific grants.
Data from the BCAs will help Government to understand the impact of recent funding
interventions and to determine what, if any, new policy and/or funding interventions are needed.
BCAs will complement the 2024 BSIP, with evidence and information gathered for the BSIP being relevant for the BCA and vice versa. The exercise is designed to support the LTA with identifying the best bus network available at varying levels of funding (including more and less than is currently available), plus informing future Government decisions on bus interventions. These activities will also provide evidence for and feed into the LTA’s local transport plan.”
Source: The National Bus Strategy: 2024 Bus Service Improvement Plans Guidance to Local Authorities and Bus Operators (page 28)
As part of this process, operators and LTAs were advised that they would be expected to report on both connectivity and other bus service delivery matters, including patronage, types of service, and areas of innovation. In terms of Connectivity, the stated requirement was:
“Evaluate bus connectivity for different types of key destinations, broken down by rural, semi-urban and urban populations. Destination groups include analysing access to business, healthcare, work, education, retail, leisure opportunities, and to other modes of transport.”
The challenge for Local Transport Authorities: The Development of the Bus Connectivity Assessment Toolkit
Accurately assessing connectivity was a very challenging ask for many Local Transport Authorities, requiring complex and time-consuming data-gathering and accessibility calculations to meet the DfT’s request on time. LTAs were given only approximately six weeks to complete this task alongside their BSIP updates, with minimal guidance on how to do so. Many local authorities also lacked the tools (and the resourcing) to produce both the BSIP and BCA for the same 12th June deadline.
Podaris was poised to help. In recent years we have seen considerable use of Podaris tools to support public transport schemes and policy changes, including the development of Bus Service Improvement Plans, enabling LTA’s who successfully used the platform to secure millions in funding for service enhancement proposals.
Many existing customers asked us if we could help with their BCA analysis, which led to the collaboration between the international transport consultancy WSP, whose input was led by Julian Moss, and myself at Podaris to co-develop a general-purpose toolkit that can be used by any Local Authority to provide answers to the five quantitative metrics of the BCA.
These are:
B1) Catchment analysis: Percentage of population that can travel to one or more destinations within 30 minutes by bus
B2 ) Peak Services: How many high-frequency routes serve each destination during the peak period?
B3) Off-peak services: During off-peak periods, how many services serve each destination?
B4) Journey time analysis: What is the average journey time for each population group to each destination by bus during the peak period?
B5) Bus Stop Access: For all bus stops directly connected to destinations, what is the percentage of the population <500 minute walk?
We were very confident that many of the existing components of the Podaris platform that have been instrumental in providing supporting evidence for BSIPs and transport plans could be quickly repurposed to generate the required five metrics of the BCA, and could provide the basis of a wider bus service analytical and data presentation capability.
Podaris responded by creating an appropriately tailored version of its latest web-based planning and analysis platform tool, Podaris:Insight, launched last year. The toolkit generated answers to the Department’s BCA questions within minutes. Remarkably, the toolkit was built within a month of the guidance being published.
We also found that for the majority of our customers, the greatest outcome of the BCA toolkit was not only the ability to generate these required metrics, but rather that they have since gone on to use the capabilities of the new toolkit to support evaluating a wide range of public transport projects and policy changes. For example, some are extending the BCA toolkit to account for DRT services (not something required as part of the Department’s guidance), while others have been inspired to use the toolkit to expand the definition of accessibility to healthcare by bus in more detail, whilst it also provides a capability for appraising post-franchising bus networks.
How the Bus Connectivity Assessment Toolkit works
Podaris’ existing simple yet powerful tools were already designed to assess the connections of bus networks between any number of points of interest, including those listed in the Government’s guidance. These tools help answer questions such as: “How many residents can access hospitals using our existing bus network within an hour?”
The same tools can be applied to understanding connectivity to employment, leisure, services and residential locations for other modes in addition to buses, such as rail and active modes. They enable Local Transport Authorities to quantify and visualise the accessibility afforded by their current bus network to determine travel time to these destinations and the number of people who can access them within, for example, 15, 30, 45 and 60 minutes, using the network.
Results can readily be filtered according to any date or time, in order to address the same question in the context of weekday peak, or Saturday morning, for example.
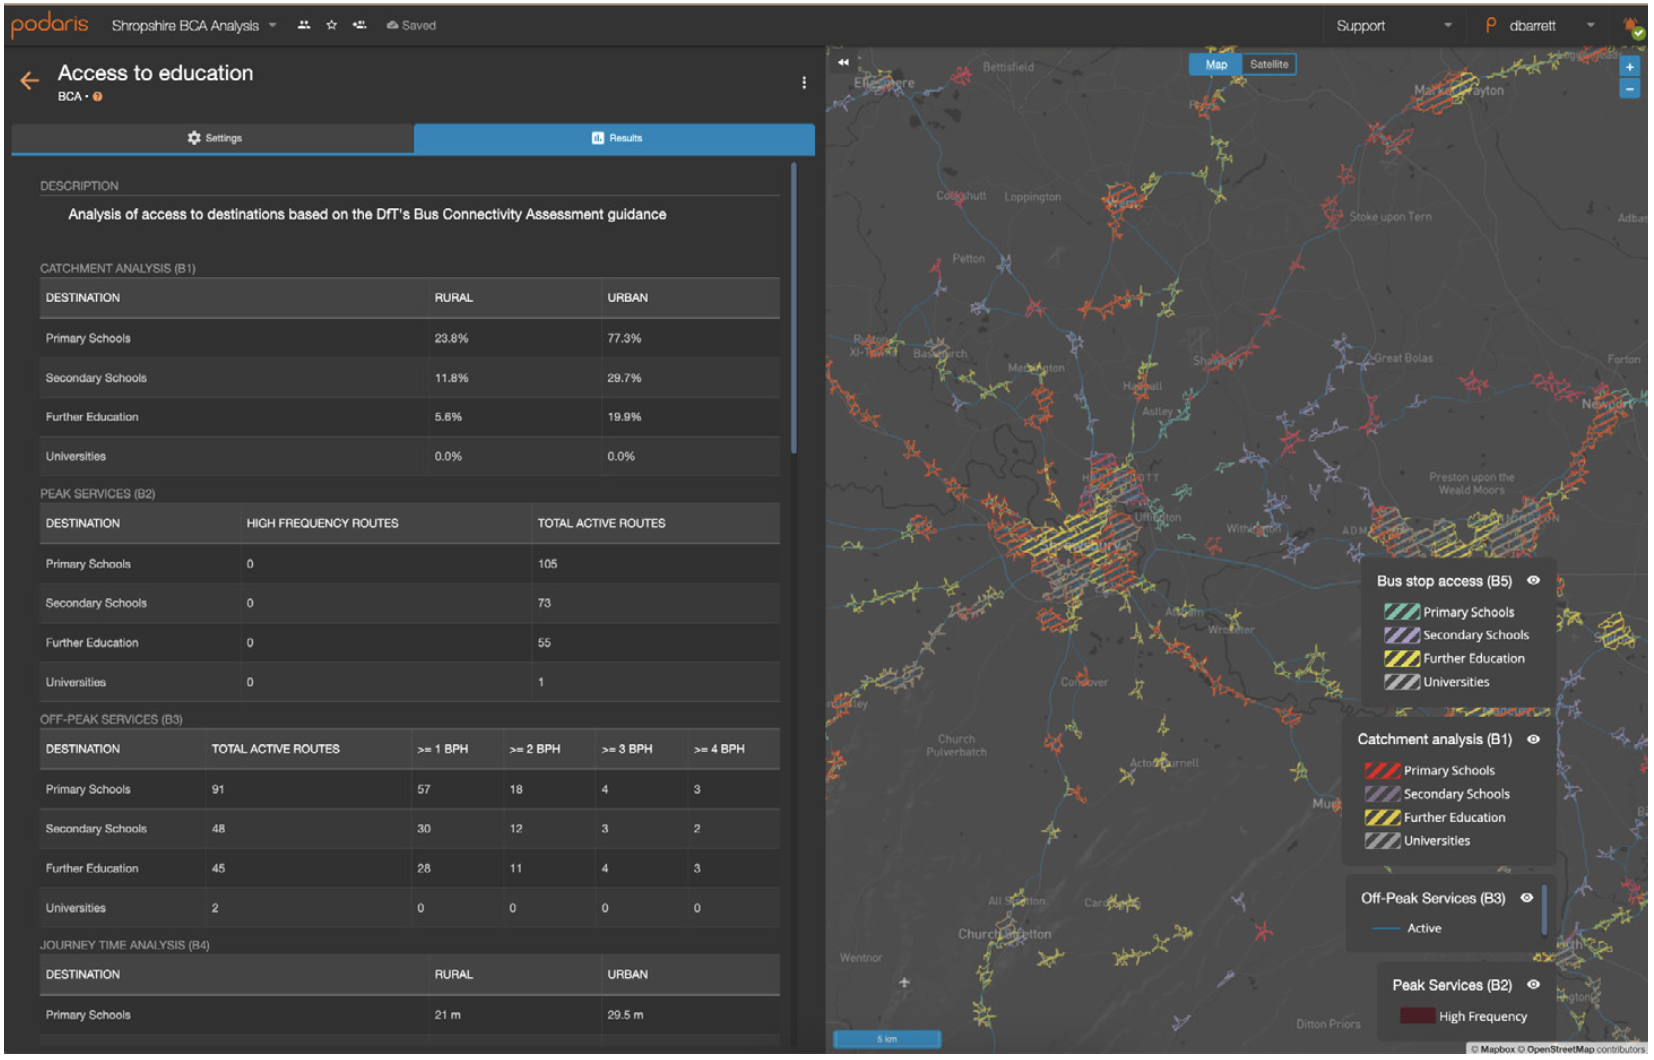
An image of the interactive results page from the Podaris BCA Toolkit. It shows maps and tabular results for the B1 - B5 metrics when analysing Access to Education in Shropshire.
Whilst this type of (arguably important) temporal interrogation was not part of the DfT’s required BCA metrics, this level of probing is part of how LTAs and their consultancy partners now use the Podaris platform when evaluating their current or future public transport networks.
The custom Podaris BCA toolkit automatically fetches several datasets, including the underlying transport network, including timetables from either the Bus Open Data Service (BODS) or the Traveline National Dataset (TNDS), as well as authoritative demographic and destination data from sources such as Ordnance Survey, NHS England and the Department for Education based on the destination types defined in the DfT’s guidance. Where authoritative data sources are not available, it fetches point-of-interest data from OpenStreetMap.
The web-based Podaris system then generates the transport accessibility calculations required for B1 - B5 of the BCA within a few minutes. Results are produced in both a tabular format (which can be extracted into Google Sheets/Excel) and visually, as maps that can also be downloaded as an image or taken into other GIS tools to style and analyse further (see example illustrated above).
Outcomes and Learnings from the Bus Connectivity Assessments – and beyond
The toolkit helped support over one in five of England’s 79 Local Transport Authorities in answering the Department for Transport’s quantitative Bus Connectivity Assessment questions, while also providing the capability to go further with bus network analysis, visioning, and information presentation.
Laura Needham, Bus Strategy Programme Manager for Liverpool City Region Combined Authority commented: “Podaris allowed quick analysis of the connectivity offered by the current bus network, using multiple datasets simultaneously for each of the required categories. The completed analysis was then available to view statistically and as an interactive/customisable map, with both available for export to help complete the assessment as well as for wider consideration.
“It proved vital in completing elements of the Bus Connectivity Assessment, which was a requirement of our BSIP submission, and we are exploring other opportunities for using the toolkit to shape our approach to network development.”
Consultant to a number of the client authorities Mott MacDonald told us : “Podaris provided an intuitive, user-friendly interface with a thorough step-by-step user guide detailing how to use its BCA templates with its team always on-hand to provide support as and when required. The connectivity analysis templates supported the streamlining of our analysis of the bus network to provide a robust yet proportionate response to meet the specific quantitative requirements of the BCA Guidance.
“`The outputs also enabled quick, accurate and effective identification of key network trends which went above and beyond BCA requirements and were able to provide a solid foundation for the general comments / commentary boxes within the BCA Survey which it was also necessary for us to populate. We hope to make significant use of it for other tasks going forward.”
Deployment by East Sussex
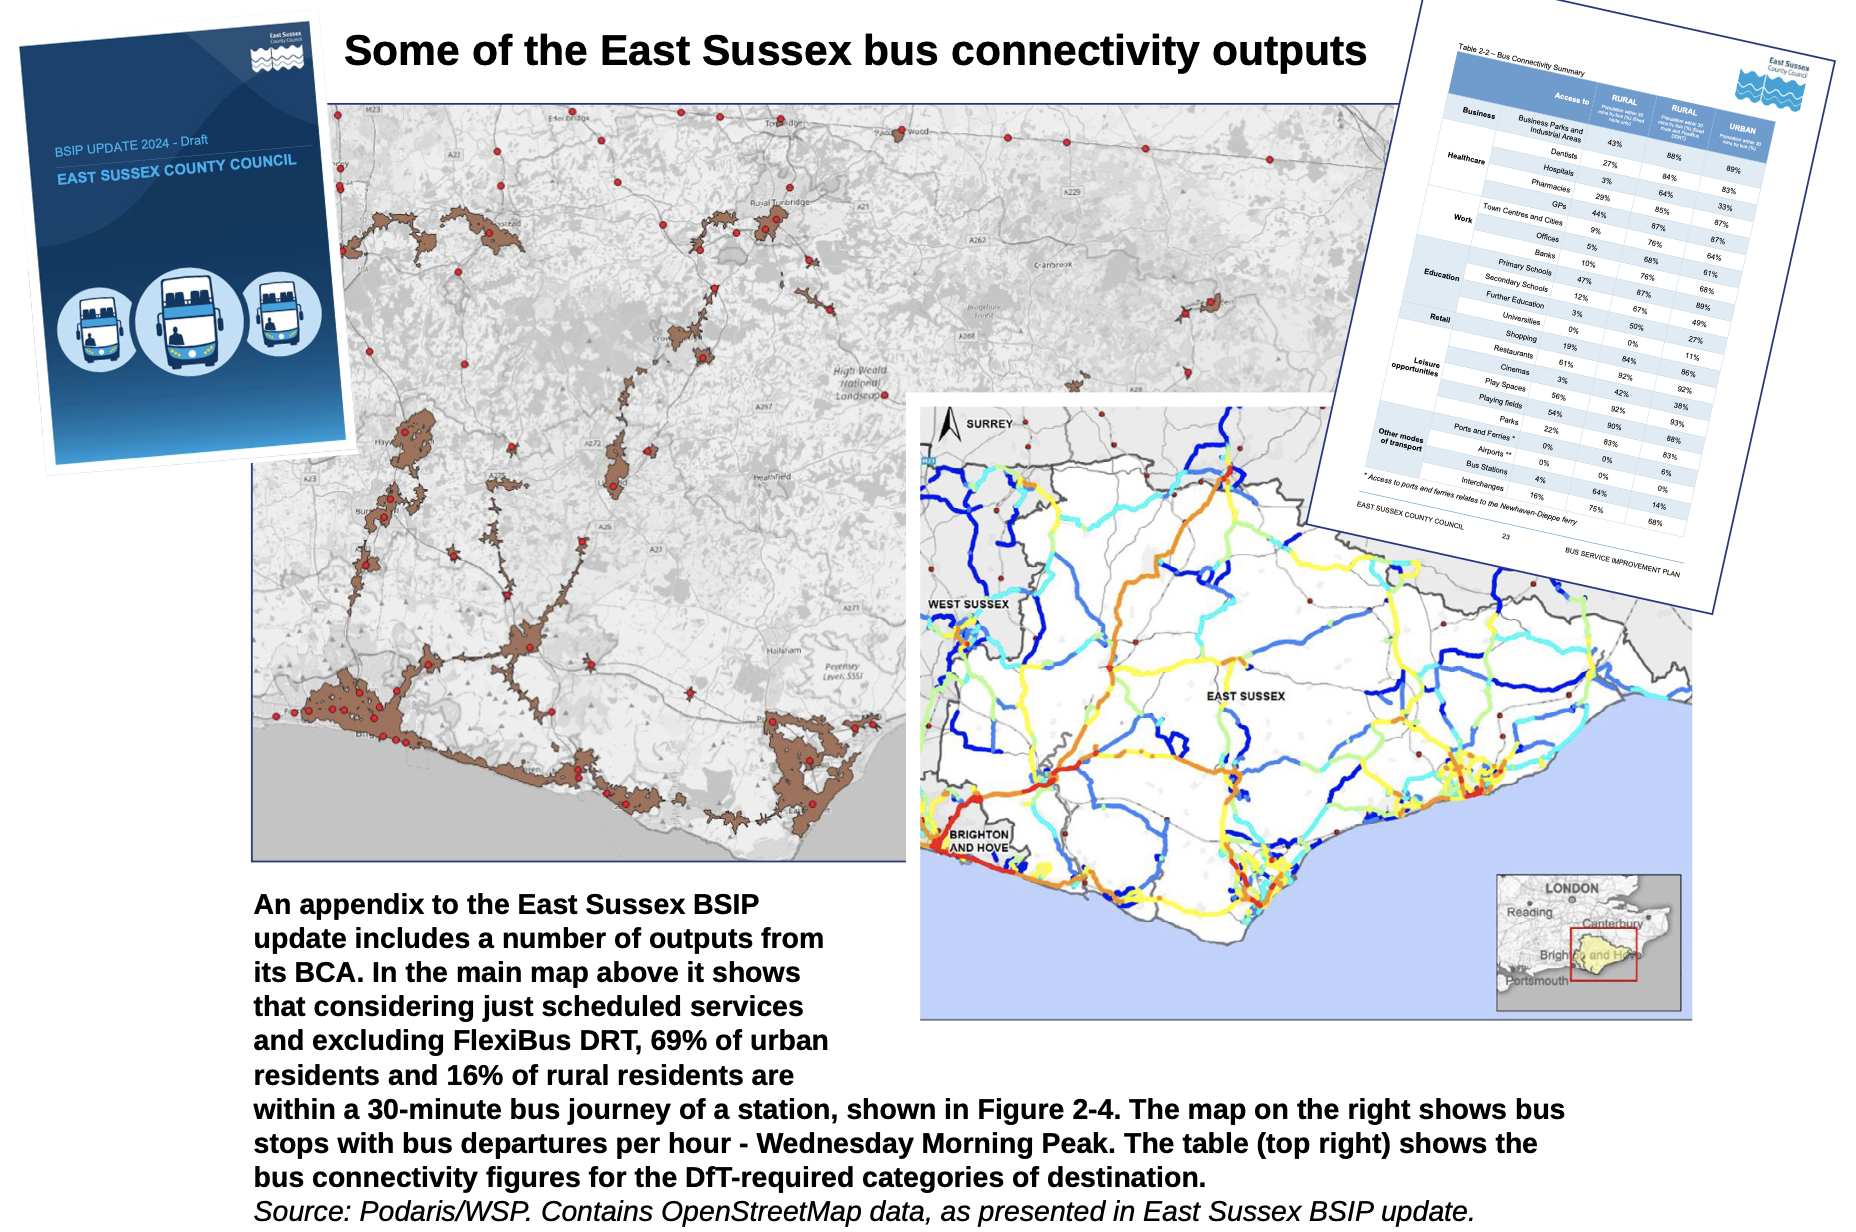
As another case study ,East Sussex County Council includes in its new BSIP submission a section entitled “Opportunity to Travel : Connecting People to Places ” This states, “Our Bus Connectivity Assessment, which sits below this BSIP and informs our ongoing network development work, seeks to answer the question of what our bus service provision means for people getting to key destinations (work, education, healthcare, leisure opportunities), and what proportion of the population can reach key destinations by bus within 30 minutes.”
“We have assessed what proportion of East Sussex residents can travel to these destinations within 30 minutes by bus in the morning peak hour, or on a direct bus route at any time of the day. We have also compared average times to travel to these different destination types by bus. We have completed this analysis looking only at fixed route services, and also looking at both fixed-route and FlexiBus demand-responsive services.
“The introduction of FlexiBus DDRT services,covering most rural areas of the county, has led to very significant improvements in access for rural residents. Considering only fixed-route bus services, rural residents have noticeable poorer bus access to most destination types, reflecting the network with many rural areas not served at all or only by infrequent buses, making a 30-minute trip difficult or impossible. With FlexiBus, however,rural access matches and in some cases exceeds the access available on fixed-route services in urban areas.”
Some of the results from more detailed assessments by East Sussex meanwhile show the importance of where facilities are located. ie :
-
Around two thirds of rural residents and 19 out of 20 urban residents can reach a major shopping area by direct scheduled bus.
-
About one fifth of rural residents can reach a major shopping area by bus within 30 minutes, while 86% of urban residents can.
-
Considering FlexiBus as well as scheduled buses, 84% of rural residents enjoy this level of access.
-
The average journey time is faster for urban residents at 19 minutes, compared with 29 minutes for rural residents. This reflects the location of major shopping areas in or on the edge of urban areas
-
There are relatively few hospitals in or close to East Sussex, so almost all rural residents (97%) and two thirds of urban residents are further away from them than a 30-minute scheduled bus trip.
-
The numbers are similar for cinemas: nearly half of rural residents (48%) can access a cinema by scheduled bus, but only 3% of them can complete the journey within 30 minutes. Over four fifths (83%) of urban residents can reach a cinema by bus, but for around half of these (42% of all urban residents) the trip would be longer than 30 minutes by bus.
https://democracy.eastsussex.gov.uk/documents/s60114/Appendix%201.pdf
“These proportions and average journey times reflect how different facilities and services are distributed, with many located in or close to town centres (and therefore closer to urban residents),” says the council’s BSIP document.
As well as being able to connect buses with each other for onward travel, there is also high importance that the bus network has integration with other modes of transport, especially rail stations, East Sussex Council’s BSIP submission notes.
It says ongoing analytical work by ESCC will identify changes in access to key destinations for residents brought about by network changes since 2022 and will be reported in the next update of their BSIP.
Deployment by Cambridgeshire and Peterborough
Cambridgeshire and Peterborough Combined Authority’s new BSIP document meanwhile also reports on its analysis in line with the DfT Bus Connectivity Assessment guidance, having split the area into the two distinct categories of : Urban – the continuous built-up areas of Cambridge and Peterborough; and Rural – other areas.
The authority says it “has taken a hybrid approach to assessing access and connectivity,” having used Podaris software to calculate a range of quantitative metrics for access to the seven DfT-specified destination types, using publicly accessible datasets for the destinations (such as NHS data for hospital locations, DfE data for school locations, OpenStreetMap data for shopping) and ONS Census 2021 data for residential population locations.
Some of the Cambridgeshire and Peterborough combined authority BSIP bus connectivity output

Figure 2 - Overview of buys services in Combined Authority Area
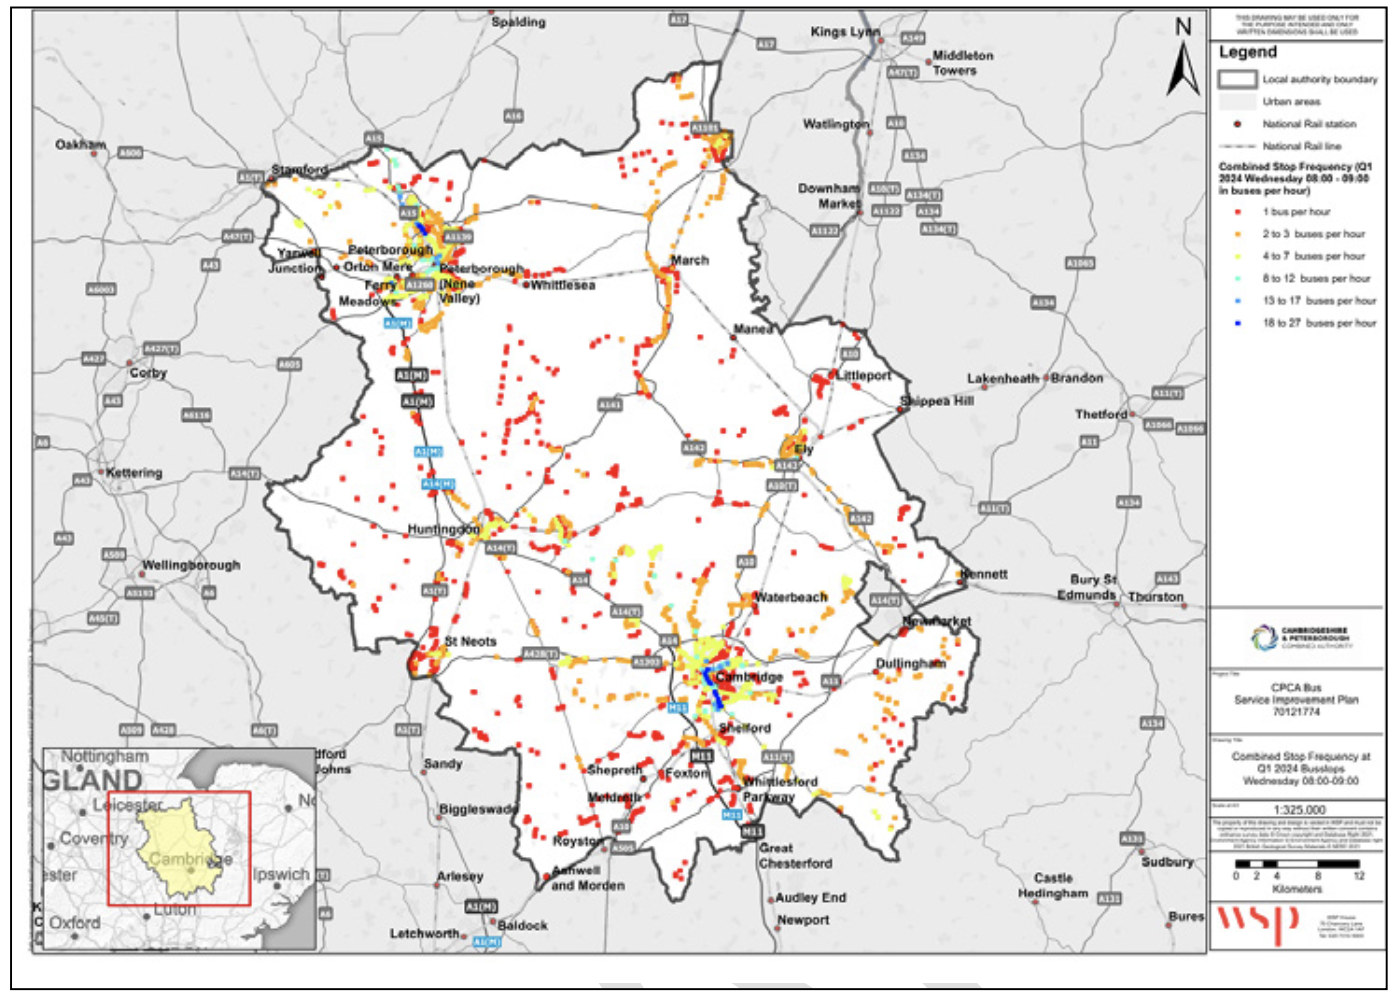
Figure 3 - Bus Frequency on Wednesdays 08:00-09:00 (Q1 2024)
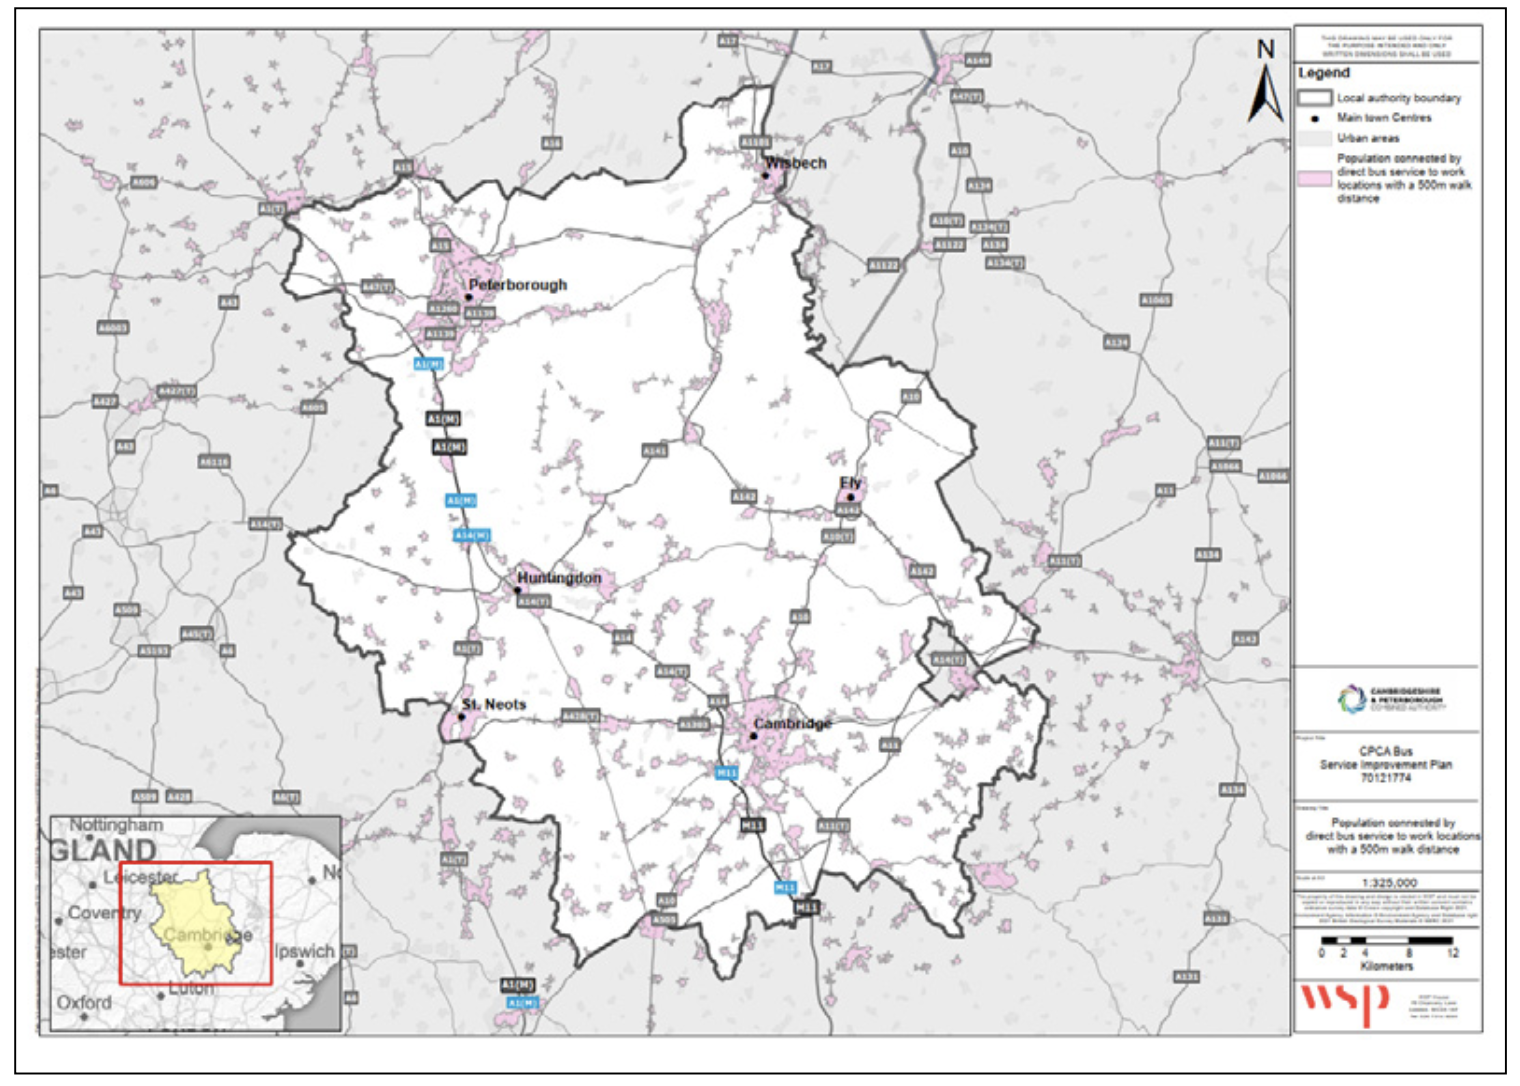
Above provides an example of the connectivity mapping for Direct Access to a Work Location. Digital map files have been produced for all destination types and will be used to identify possible gaps in connectivity.

Above shows the collated detail of the quantitative metrics above to the identified destination types in each of the categories. These will be used as
an ongoing way of evaluating the impact of future changes in the network.
The quantitative metrics assess the following:
-
Percentage of population within 30min journey time of destination (Travel Time)
-
Number of high-frequency bus services to destination, defined as service offering more than 6 buses per hour during peak hours (High Frequency)
-
Off-peak service levels to destination, based on the number of buses per hour (Off Peak)
-
Journey time per passenger journey to destination, relative to the average bus journey in CPCA (Journey Time)
-
Percentage of the population within 500m of a bus stop connecting to the destination (Direct services)
“Officers have separately prepared a qualitative assessment of the relevant factors (punctuality, passenger satisfaction, safety etc). This has considered our experience and knowledge, insight from passenger surveys and from operators, ” the Cambridge and Peterborough Combined Authority notes.
“We have chosen not to apply any weightings to the assessment but may use the analysis to inform future prioritisation or policy decisions, where scenario testing using weightings would be applicable.”
The illustrative charts on this page provide an example of the connectivity mapping for Direct Access to a Work Location. Digital map files have been produced for all destination types and will be used to identify possible gaps in connectivity. Also shown is the collated detail of the quantitative metrics above to the identified destination types in each of the categories. These will be used as an ongoing way of evaluating the impact of future changes in the network.
How can we develop enhanced Connectivity Assessments for the future?
The Bus Connectivity Assessment is intended to be an ongoing requirement for LTAs to update their Local Transport Plans (alongside BSIPs). The Podaris toolkit continues to be available to use, and we’re ready to update it to align with any changes to the DfT’s guidance.
So we’d like to go further in unlocking the toolkit’s potential for wider applications.
Indeed, this is just a first step in how we see the future of analysing and evaluating transport schemes that account for connectivity, and more work is needed to truly appreciate and calculate the nuances of connectivity to ensure that we create sustainable transport systems that actually effectively connect people to the places that they want to go.
As a multimodal transport planning tool, the Podaris capability allows users to understand journeys as they are actually made and explore connectivity between buses, trains, trams, and several other modes of transport. If necessary, users can set a maximum number of transfers and a maximum access distance. It can generate end-to-end journey plans that provide a complete multi-modal picture of the travel options between two points using existing or proposed networks.
This means that, in addition to having achieved the DfT’s base requirements for bus connectivity assessments, the opportunity arises to further enhance the capability to consider travel holistically.
In this regard, it is worth raising the obvious question : Beyond these initial metrics created to gather BCA information, what should the optimal/most desirable connectivity characteristics of transport networks be?
Here at Podaris, we hope that this consideration will become central in future revisions. In our experience of supporting 1 in 5 Local Transport Authorities in applying the concept, the BCA metrics fell short in a number of respects in trying to measure connectivity in a meaningful way, and would recommend that future connectivity assessments account for the following factors:
-
The guidance gave no consideration for demand responsive flexibly routed (DRT) services which are becoming an additional option for securing rural connectivity;
-
Bus-only connectivity should really not be considered in isolation and thus show areas that are actually well connected by other modes of transportation as having poor connectivity; these other modes should sensibly surely also be included in an overall public transport accessibility measurement;
-
Metric B5 only measured how directly connected each area was to the specified destination groups, though leading industry guidance often favours hub-and-spoke system topologies that can provide greater frequency, but indirect, connectivity;
-
The guidance around defining the most important destination groups was sparse and sometimes puzzling. For instance, it suggested curious points of interest, such as banks being a key employment destination, though these days, the percentage of most LTA residents who work in a bank must be very small.
-
Overall, requiring each LTA to calculate these metrics themselves, using often ambiguous guidance, and sourcing their own datasets, will potentially lead to analytical outcomes that are incomparable and difficult for policymakers to use confidently at a national level.
We’ve been delighted to support our LTA and consultancy partners with data sourcing and network analysis to help meet this summer’s demanding BSIP submission deadline. Let’s jointly build on this achievement.
As mentioned earlier, it is understood that the DfT itself has been working on a connectivity tool that might one day be used to support analysis, such as the BCA. While we are sure that would be welcomed by many LTA’s, we question whether this is the best use of public funding when affordable commercial solutions such as those developed by Podaris are now widely available and proven as cost-effective as demonstrated by the ability to build this custom BCA analysis function very quickly.
A more pertinent – and uniquely appropriate and most welcome task for the Department for Transport - would be a more detailed and comprehensive set of guidance about the role of connectivity analysis within policy making and implementation. This would assist in its technical specification and current and potential wider application to the policy development and assessment area. Indeed, accessibility analysis is now so common - perhaps more common than transport modelling- does it not deserve its own distinct element within DfT’s Transport Appraisal Guidance TAG?. This would then guide platforms like Podaris in how they can best provide features to help practitioners in their implementation.
On these issues and others, the author would be delighted to hear readers’ thoughts about the concept of connectivity analysis in general, its application to bus networks, the outcomes of the current round of assessments for BSIPs and the contribution of the Podaris BCA toolkit. And of course, any additional steps or metrics you would like to see for the toolkit.
References and Links
-
Consultant lands £2.2m DfT contract to drive new bus network. Local Transport Today magazine, LTT884, 23 January 2024. https://lttmagazine.co.uk/edition/
-
DfT gets award for connectivity assessment app tool. Local Transport Today magazine, LTT883, 9 January 2024. https://lttmagazine.co.uk/edition/
-
https://democracy.eastsussex.gov.uk/documents/s60114/Appendix%201.pdf
-
https://blog.podaris.com/podaris-insight-accessibility-analysis/
Devon Barrett is Co-Founder and Chief Technical Officer of Podaris, a collaborative platform for transport planning. He combines his passion for making cities more liveable with his software engineering expertise to deliver solutions helping plan the cities of tomorrow. His work has won a number of awards, and this year, he was nominated for Young Transport Planner of the Year for providing strategic technical modelling advice on a number of high-profile projects.
This article was first published in LTT magazine, LTT899, 18 September 2024.
You are currently viewing this page as TAPAS Taster user.
To read and make comments on this article you need to register for free as TAPAS Select user and log in.
Log in