TAPAS.network | 19 December 2022 | Commentary | John Siraut
Station usage figures show a changed post-Covid rail market

The changing pattern of rail travel in Britain is revealed in new figures from the ORR examining station usage. The differences in returning post-Covid demand between Regions, Urban and non-urban areas and commuter, inter-city and leisure travel are quite significant says
IT’S THAT TIME OF YEAR when the Office for Rail and Road publish its annual estimates of National Rail station usage across England, Scotland and Wales. The figures cover the financial year April 2021 to March 2022 and though still heavily impacted by Covid restrictions and responses, they indicate a rather different travel landscape emerging. With total rail usage having continued to recover strongly, especially for leisure travel, there are considerable differences between regions and between stations in different areas that are very worth exploring, beyond looking at just absolute passenger numbers.
For the record, the busiest station was London Waterloo once again, returning after being knocked off the top spot last year by Stratford (London). Waterloo’s passenger numbers though, at 41.4 million, are still less than half of its pre-lockdown figures. Eight of the top 10 are London stations, with Birmingham New Street and Manchester Piccadilly coming in at eighth and 10th respectively. Elton and Orston in Nottinghamshire was the least used.
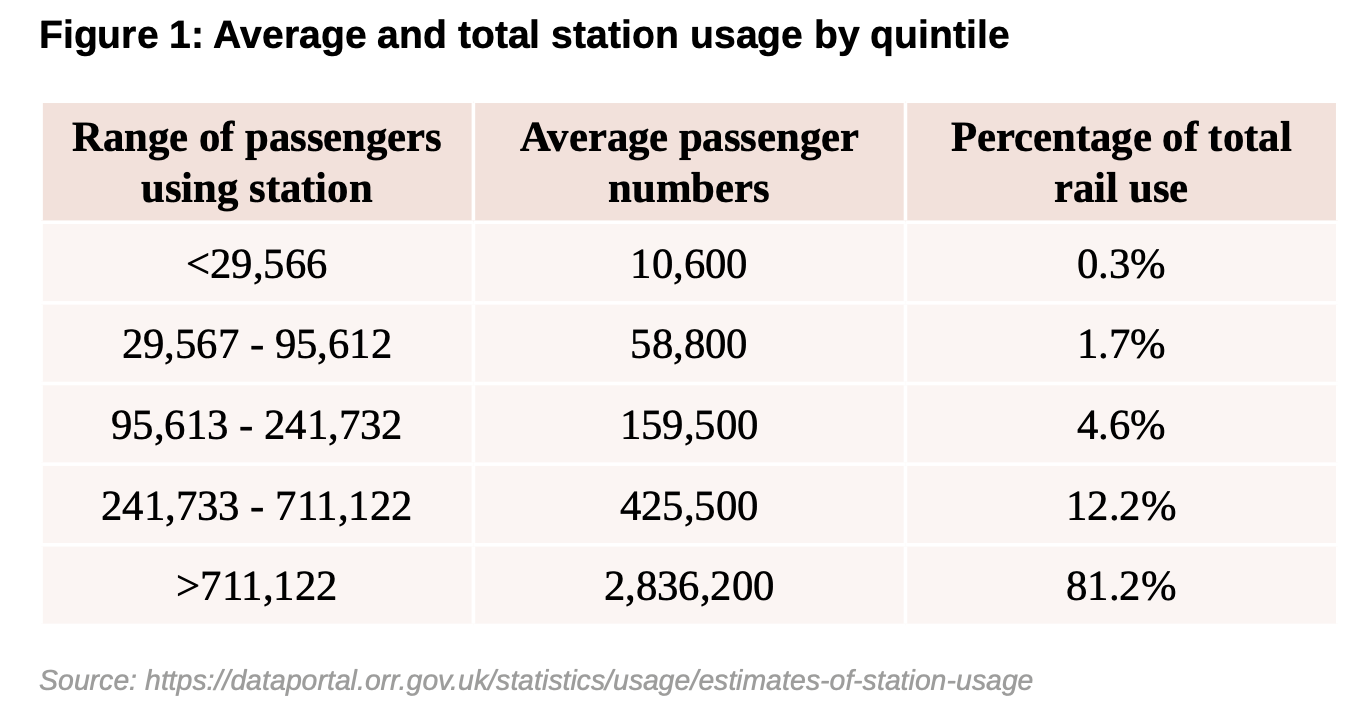
This year, data was provided for 2,568 stations which range from unstaffed halts in remote areas of the country to bustling city centre termini. Figure 1 gives an idea of the variety of the type of stations served by the rail network. Stations have been split into quintiles based on usage. The least used 20% of stations account for 0.3% of total rail use while the busiest 20% are used by an average of 2.8m people a year and account for over 80% of total rail use.
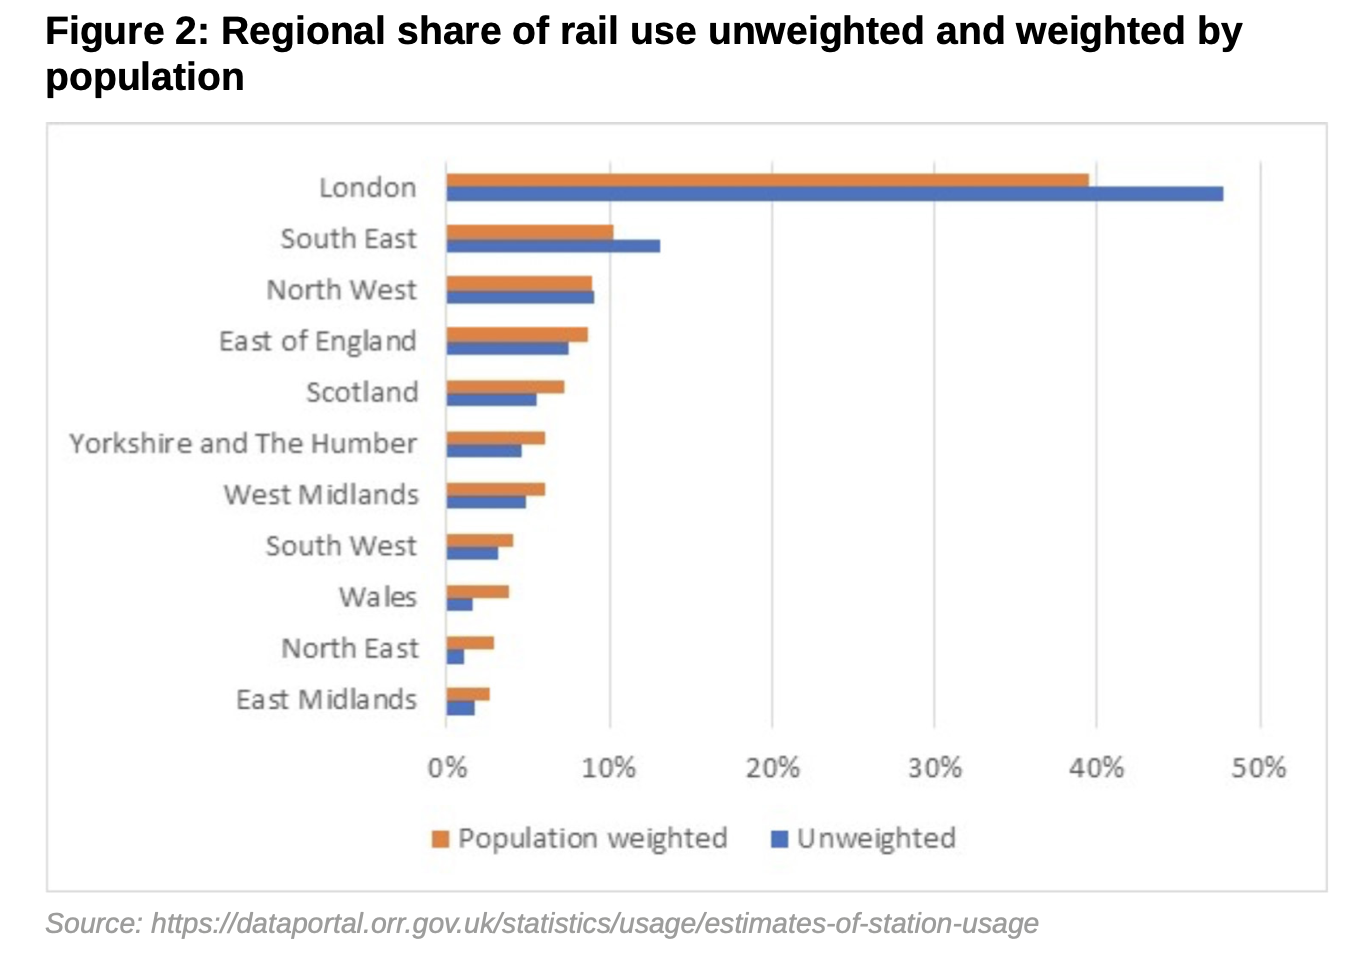
Rail use is still heavily dominated by London whose stations handle nearly 50% of all passenger journeys. However, once account is taken of the regions’ different levels of population this falls to under 40% as shown in figure 2. After London, the South East, North West and the East of England have the highest rail use taking account of their populations.
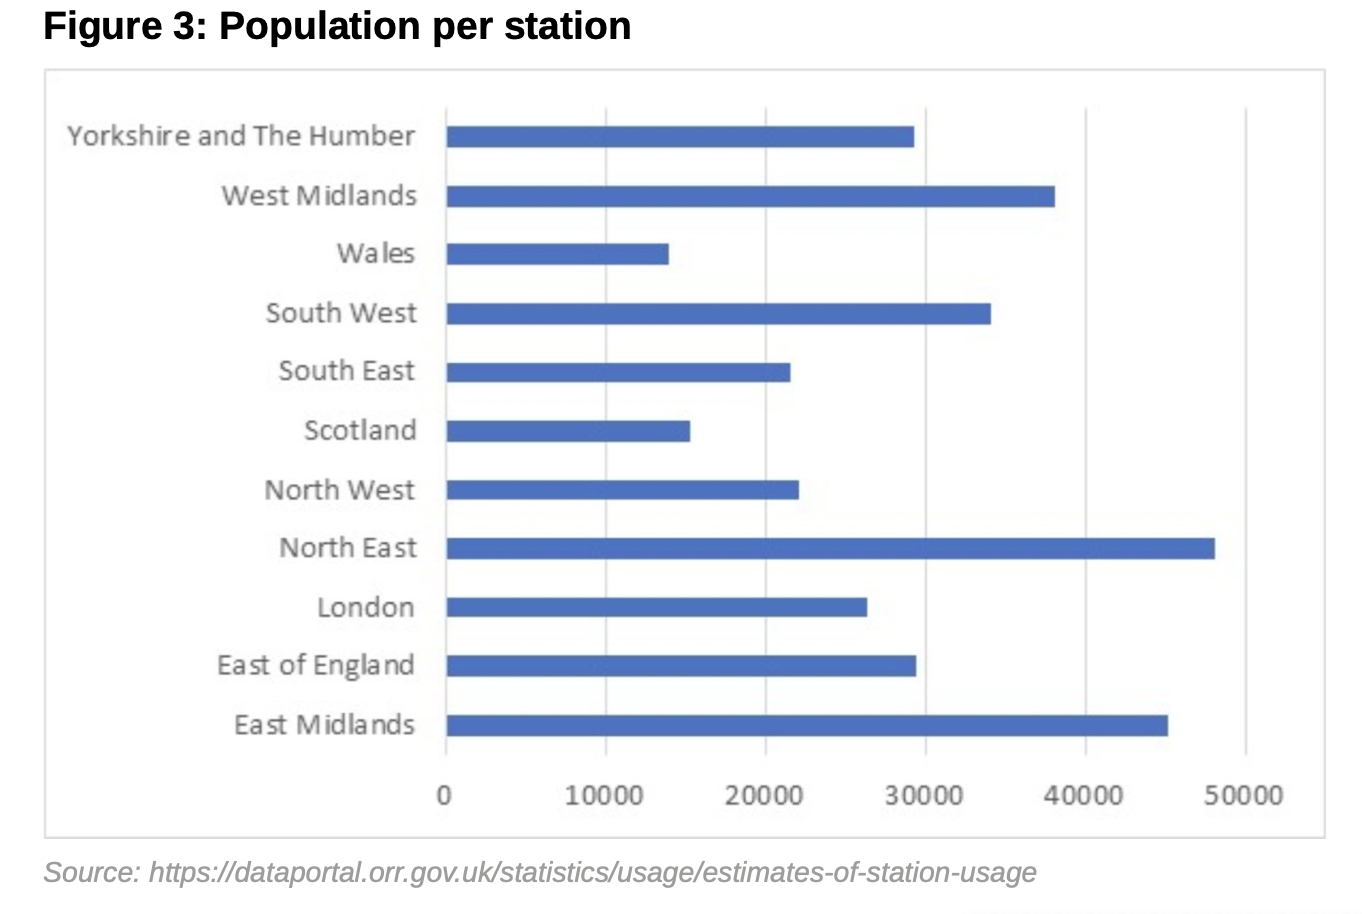
Usage of the rail network obviously depends on its extent and there are large differences in the average number of people per rail station across the regions as shown in figure 3. The North East has one station per 48,000 residents (in part due to the transfer of many stations to the Tyne & Wear Metro). The East Midlands is the next, sparsely served with one station per 45,000 residents. The West Midlands is also not well serviced. Wales with a station for every 14,000 people and Scotland one for every 15,000 are better served.
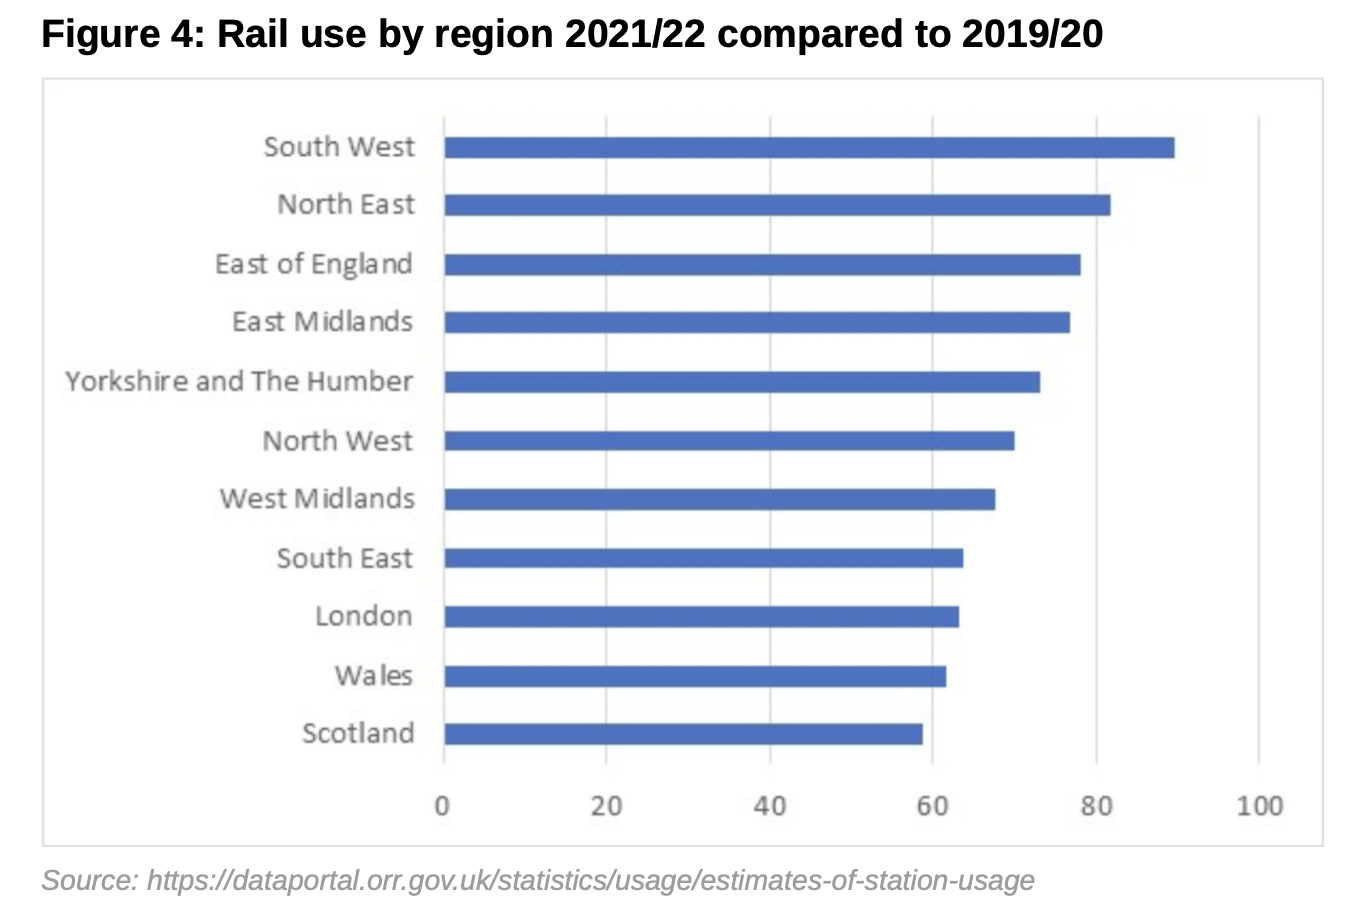
Recovery in rail use has varied around the country as shown in figure 4. Boosted by domestic tourism in 2021, the South West saw the biggest bounce back with usage at 90% of pre-Covid levels. Cornwall and Devon both had higher rail use in 2021/22 than in 2019/2020. With tighter Covid restrictions than England, Wales and Scotland had the smallest recovery, followed by London and the South East reflecting the high levels of working from home in these areas.
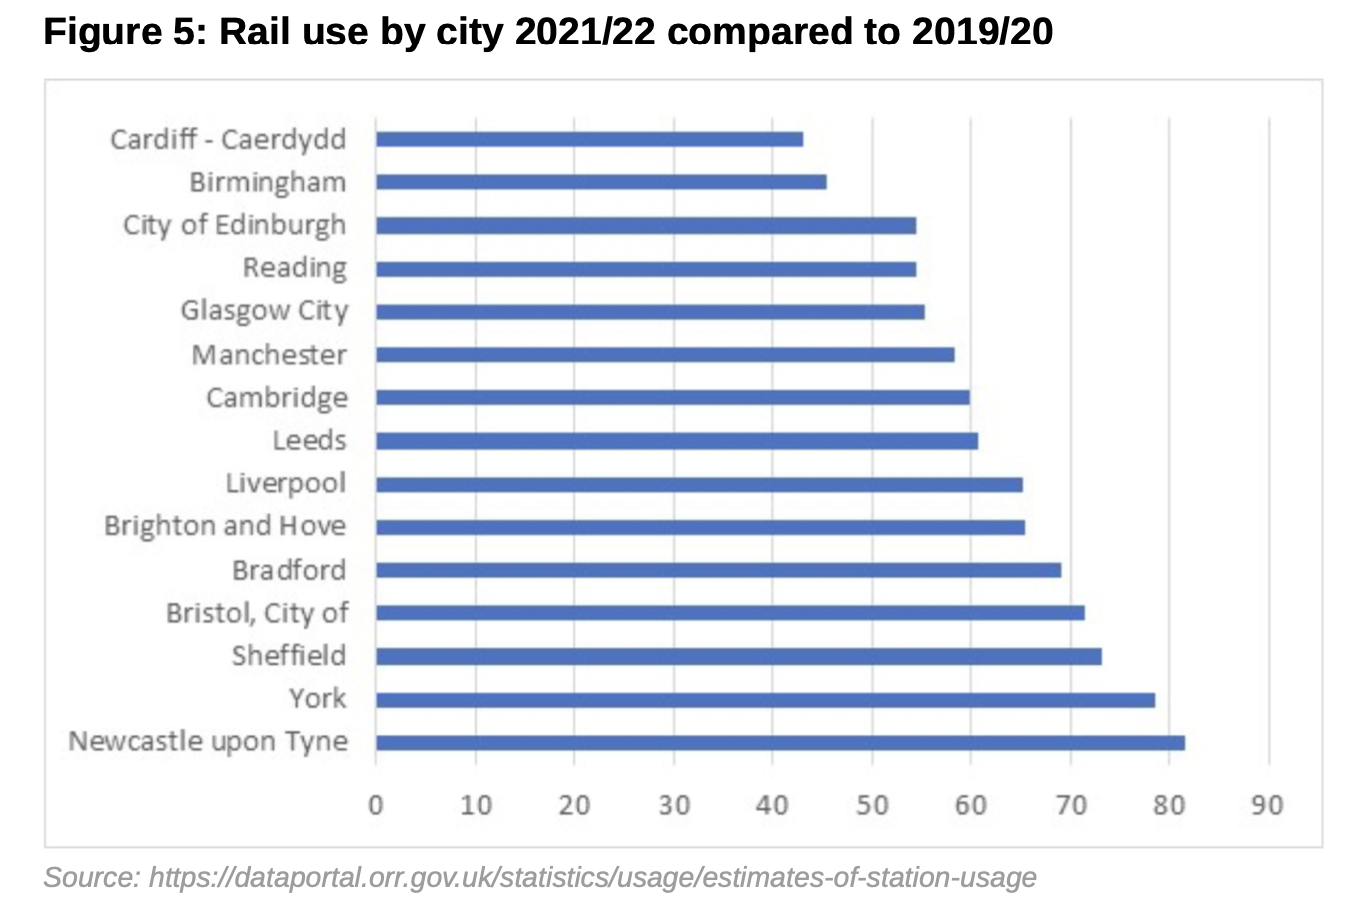
At a city level the changes are even more pronounced. Cities that have limited commuter traffic fared best with Newcastle and York at 80% of pre-Covid levels. Tourist destinations such as York and Cambridge performed better than Reading or Birmingham. Cardiff, Edinburgh and Glasgow are towards the bottom due to the tighter Covid restrictions that were applied in those locations.
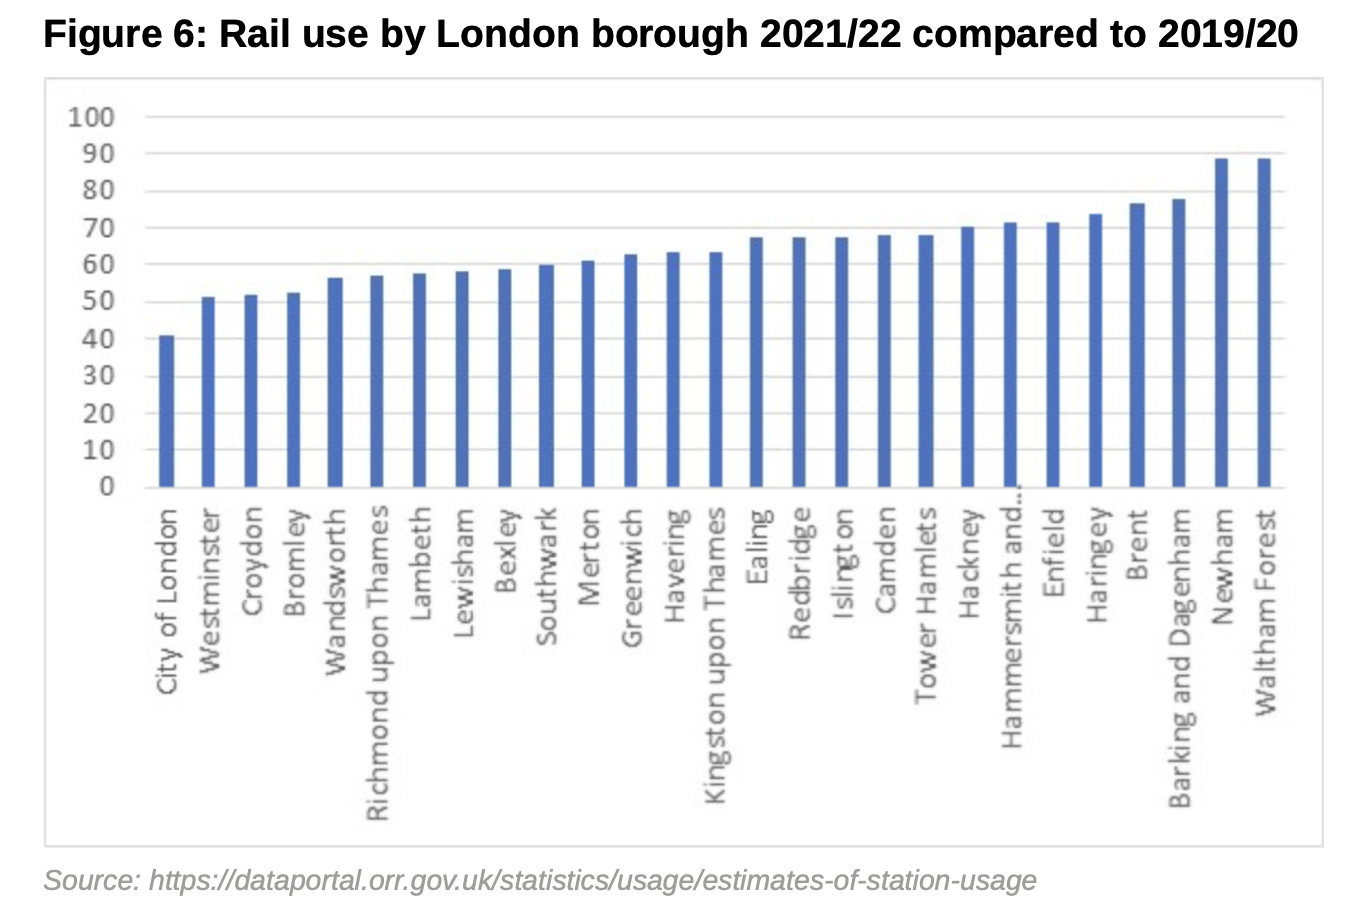
In London, the impact of working from home can clearly be seen in that the Cities of London and Westminster had the lowest level of recovery while less affluent boroughs with fewer commuters saw demand return close to pre-Covid levels.
Rail is often perceived to be used by well-off commuters living in London and the South East and those making long inter-city journeys on the main radial routes in and out from London. However, the impacts of Covid have highlighted that it is often lower income earners that are heavily dependent on rail for commuting and connecting with other regional economic and social activity in other parts of the country where the train network allows it.
It must be a significant development that leisure use of the railway is a growing phenomenon, and an activity more evenly distributed across income levels.
John Siraut is director of economics at Jacobs.
This article was first published in LTT magazine, LTT859, 19 December 2022.
You are currently viewing this page as TAPAS Taster user.
To read and make comments on this article you need to register for free as TAPAS Select user and log in.
Log in