TAPAS.network | 30 May 2022 | Commentary | John Siraut
How sandwich sales have added new insights about current transport and travel trends

Taking the pulse of transport activity in the shorter term is a different challenge to plotting long term modal usage trends - and can potentially benefit from less obvious data sources. looks at some new indicators that could be valuable markers in this regard - some that might be unexpected, but revealing alternative measures of transport use.
SINCE THE PANDEMIC, the Office for National Statistics has been publishing a number of real time activity indicators on an experimental basis. The aim is to provide decision-makers with a better insight as to how the economy is performing through a time of rapid and fluctuating change. For those with interests related to transport, they include the use of sandwich sales, traffic cameras and credit card transactions. Each measure has its limitations and are influenced by a range of factors, but together they provide an alternative and informative insight into transport behaviour across the country at a time of unprecedented disruptions to established patterns of travel.
The Pret A Manger dataset, for example, contains in-store transactional data presented as an index of the average weekly till transactions based on the first four weeks of 2020 (between 3rd and 30th January).
Figure 1 (below) shows how sales have progressed at both London and regional stations as well as at London airports over the last 12 months. Transactions at London stations had returned to pre- pandemic levels by November 2021 and after the Christmas restrictions have done so again recently. Transactions at regional stations have tended to lag behind at around 80% of 2020 levels. However, airport transactions have stormed ahead in recent months and are now 20% higher than pre-pandemic. However, the numbers are not seasonally adjusted so do not necessarily mean air travel is higher than the same period two years ago.

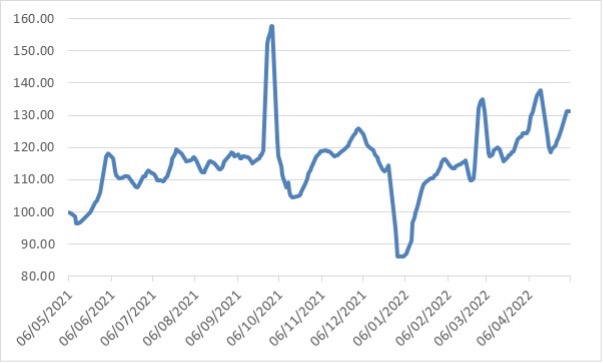
The credit and debit card data refers to spending at outlets providing public transport or selling petrol/diesel. It is an index based on February 2020 =100. This index is more difficult to interpret as it relates to spend, rather than volume of sales, so is impacted by fluctuating fuel prices as well as increases in public transport fares.
Figure 2 (below) shows that spend on fuel and public transport has been running about 20% higher than pre-pandemic levels since June 2021. The panic buying of fuel in late September last year can be clearly seen, with spend rising by a third more than normal and then falling below average levels as people used up their stockpiles. Spend also picked up noticeably after the Russian invasion of Ukraine and the subsequent increases in fuel prices. Spend on fuel and public transport is now up around 30% compared with two years ago, leading to a squeeze on other areas of consumer spending.
The third data set uses traffic cameras to track changes in flows of vehicles and people. This is perhaps the least reliable dataset, due to missing data and different starting dates from when data was first collated for some of the locations included. However, it is seasonally adjusted.
Figure 3 (below) presents data for pedestrian and cycling combined for three areas where the data is most complete, as an index from the situation a year ago. Due to widely fluctuating daily numbers the data is presented as a 14-day moving average. The data in all three areas broadly moves in the same way, albeit that for Greater Manchester it shows far greater fluctuations. It is notable that in all three areas there has been an increase in combined pedestrian and cycling movement since fuel prices increased earlier this year.
Spend on fuel and public transport is now up around 30% compared with two years ago, leading to a squeeze on other areas of consumer spending.

In summary, the various new ONS indicators I have looked at (and some others that you will see listed below) provide a useful - and timely - overview of changes in transport use and spend across the country.
It has also been good to have much more frequent and detailed statistics on transport use since the pandemic struck, published weekly, based on daily counts, collected by the Department for Transport. These cover road traffic in Great Britain, rail passenger journeys, transport for London (TfL) tube and bus routes, bus travel in Great Britain (excluding London) and cycling in England.
The full-time series for these statistics, starting 1 March 2020, is usually published every Wednesday at 9.30am (see the link).
But the transport sector itself can arguably do rather more to demonstrate quickly what’s going on amongst its various user bases. Indeed, let’s hope that more transport organisations follow Transport for London’s example for daily figures for bus and underground usage on a nearly real time basis.
One can think of a range of situations where valuable and fascinating statistics ought to be possible very quickly - for example the response to the opening of the new Elizabeth Line and the discounted national rail fares promotion that’s just been running.
I’d be interested to hear from readers with any other quick access sources that they may have themselves produced or sourced about travel or transport activity, or proxy indicators like the Pret a Manger sandwich sales. And maybe suggestions about what else we might usefully go looking for as indicators too!
Full current list of ONS real-time indicators data
Since the beginning of the coronavirus (COVID-19) pandemic, ONS have been providing a range of indicators of the effect on the UK economy and society in its Economic activity and social change in the UK, real-time indicators (link to page on ONS website).
The real-time indicators are compiled using a variety of different data sources.
On a regular basis, the following indicators are now included:
-
fortnightly Business Insights and Conditions Survey (BICS), a voluntary business survey to deliver real-time information to help assess issues affecting UK businesses and economy
-
weekly Companies House data for company incorporations, voluntary dissolutions, and compulsory dissolution first gazettes in the UK
-
weekly Energy Performance Certificates (EPCs) data for new and existing dwellings in England and Wales
-
daily indices of footfall in retail destinations at a UK level, using data from Springboard, a provider of data on customer activity
-
weekly experimental online job advert indices covering the UK job market, using data from job advert aggregating website Adzuna
-
weekly data from OpenTable showing how seated diners from online, phone, and walk-in reservations compared with 2019
-
weekly transport use and developing faster indicators of transport activity
-
data provided by Kantar Public, recording item availability of 23 popular products across the UK and English regions
-
weekly and daily shipping data from exactEarth using the UN Global Platform
-
fortnightly Opinions and Lifestyle Survey (OPN), looking at the social impact of the coronavirus
-
daily and weekly changes in gas prices, using the system average price (SAP) from the National Grid
-
experimental daily traffic camera counts data for busyness indices covering the UK
-
weekly transactional data for Pret A Manger, comparing weekly in-store transactions against the average level of the first four weeks of 2020
-
daily CHAPS payments from the Bank of England made by credit and debit card payment processors to around 100 major UK retail corporates
-
daily flights data from EUROCONTROL comprising international arrivals and departures to and from the UK (including crown dependencies) and domestic UK flights, but excluding overflights (flights that pass over UK territory)
-
monthly value-added tax (VAT) diffusion indexes and new VAT reporters using data from HM Revenue and Customs (HMRC) VAT returns
-
daily and monthly counts and average speeds of vehicle flows around English ports
-
weekly advanced notification of potential redundancies from HR1 forms submitted by employers to the Insolvency Service’s Redundancy Payments Service
-
monthly data on sales and jobs in small businesses, taken from Xero, a global cloud-based accounting software platform with 785,000 small business subscribers in the UK.
ONS says that new experimental data and indices are included as and when new data become available, either on a stand-alone or regular basis as appropriate, with the relevant methodology information listed on its website.
John Siraut is director of economics at Jacobs.
This article was first published in LTT magazine, LTT846, 30 May 2022.
You are currently viewing this page as TAPAS Taster user.
To read and make comments on this article you need to register for free as TAPAS Select user and log in.
Log in