TAPAS.network | 20 September 2022 | Commentary | John Siraut
National Travel Survey shows still unfinished patterns of change

Each year the Department for Transport publishes its National Travel Survey for England, providing a snapshot of our travelling behaviour; why we travel; for how long; and by what means. There is usually not much change from year to year, but the pandemic has changed our travel behaviour and in this article looks at some of those changes between 2018/2019 and 2021.
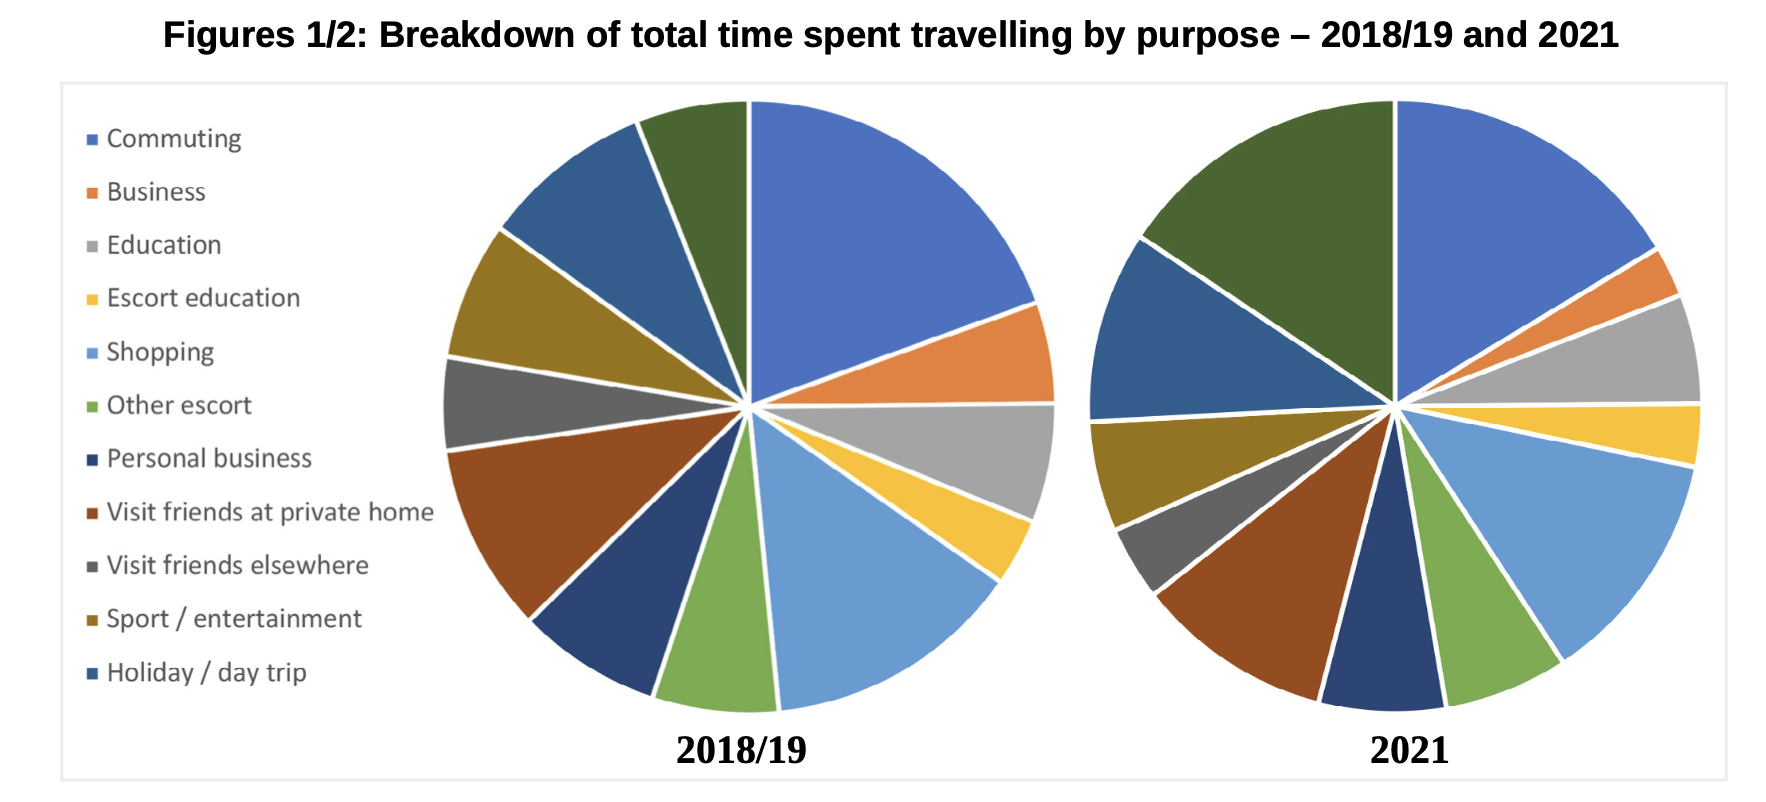
ONE RULE OF THUMB that has long applied across time and countries is that on average we each spend about an hour a day travelling. In keeping with that metric, the total annual time spent travelling in 2018/19 was 373 hours. As can be seen in figure 1, nearly 20% of that time was spent commuting, with shopping accounting for the next most time intensive activity. In 2021, the new National Travel Survey reveals, under the shadow of the pandemic, that the total time spent travelling dropped by exactly 100 hours to an average of 273 hours.
Not only had the total amount of time spent travelling reduced but the reasons for travelling also changed as can be seen by comparing the segments in the pie charts in figures 1/2. Now a quarter of our time was spent travelling for holidays, day trips or just going for a walk, compared to 15% in 2018/19. While the time spent on business and commuting trips fell from 25% in 2018/19 to under 20% in 2021.
Distance travelled
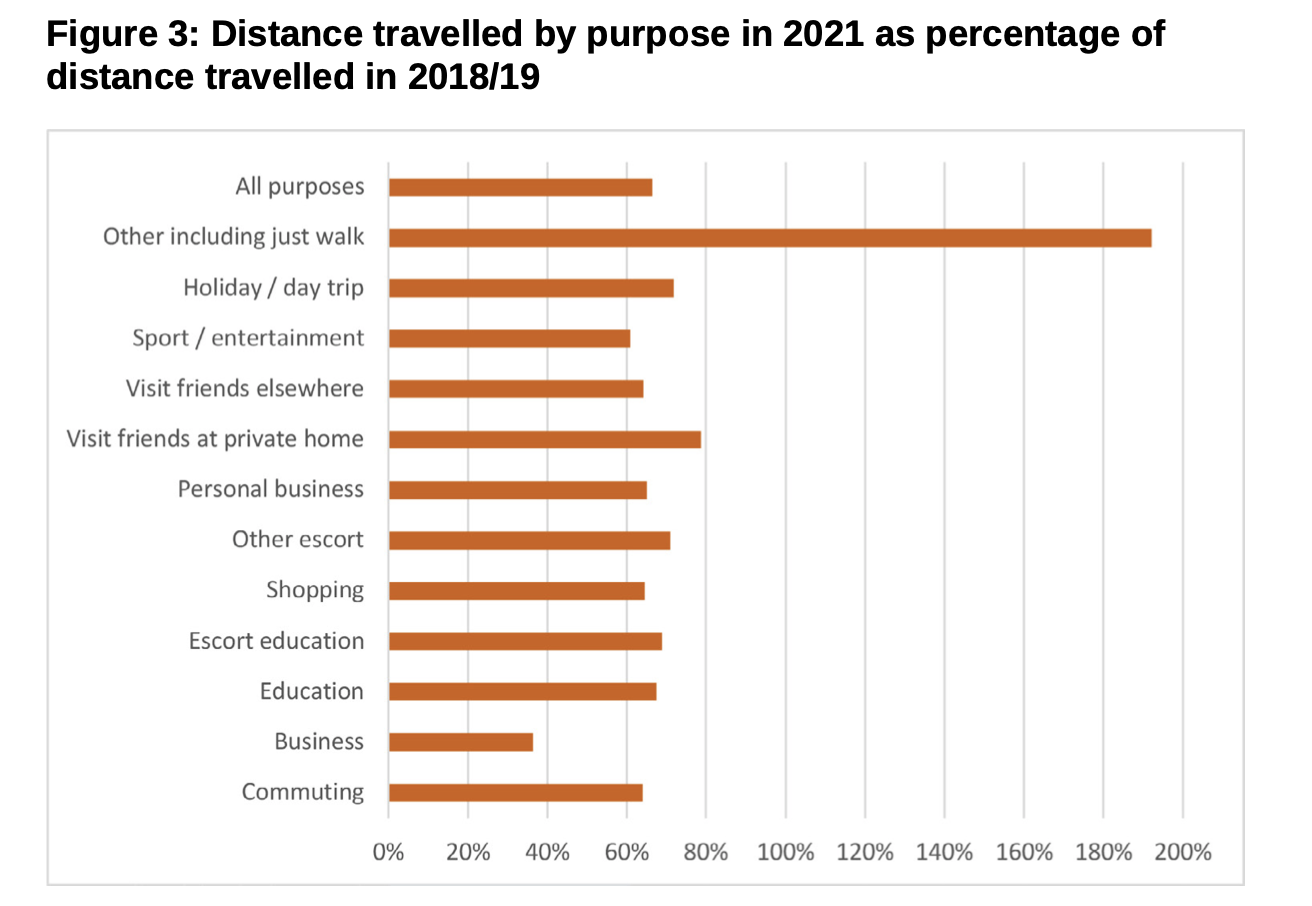
Given we spent less time travelling, the distances we travelled also reduced, in total from an average of 6,515 miles in 2018/19 to 4,329 miles in 2021. However, again the change in miles travelled varied considerably by journey purpose as shown in figure 3. There was a 60% fall in distance travelled for business trips, while most other journey purposes saw a fall of around a quarter to a third. However, people almost doubled the distance travelled going for a walk.
Regional differences
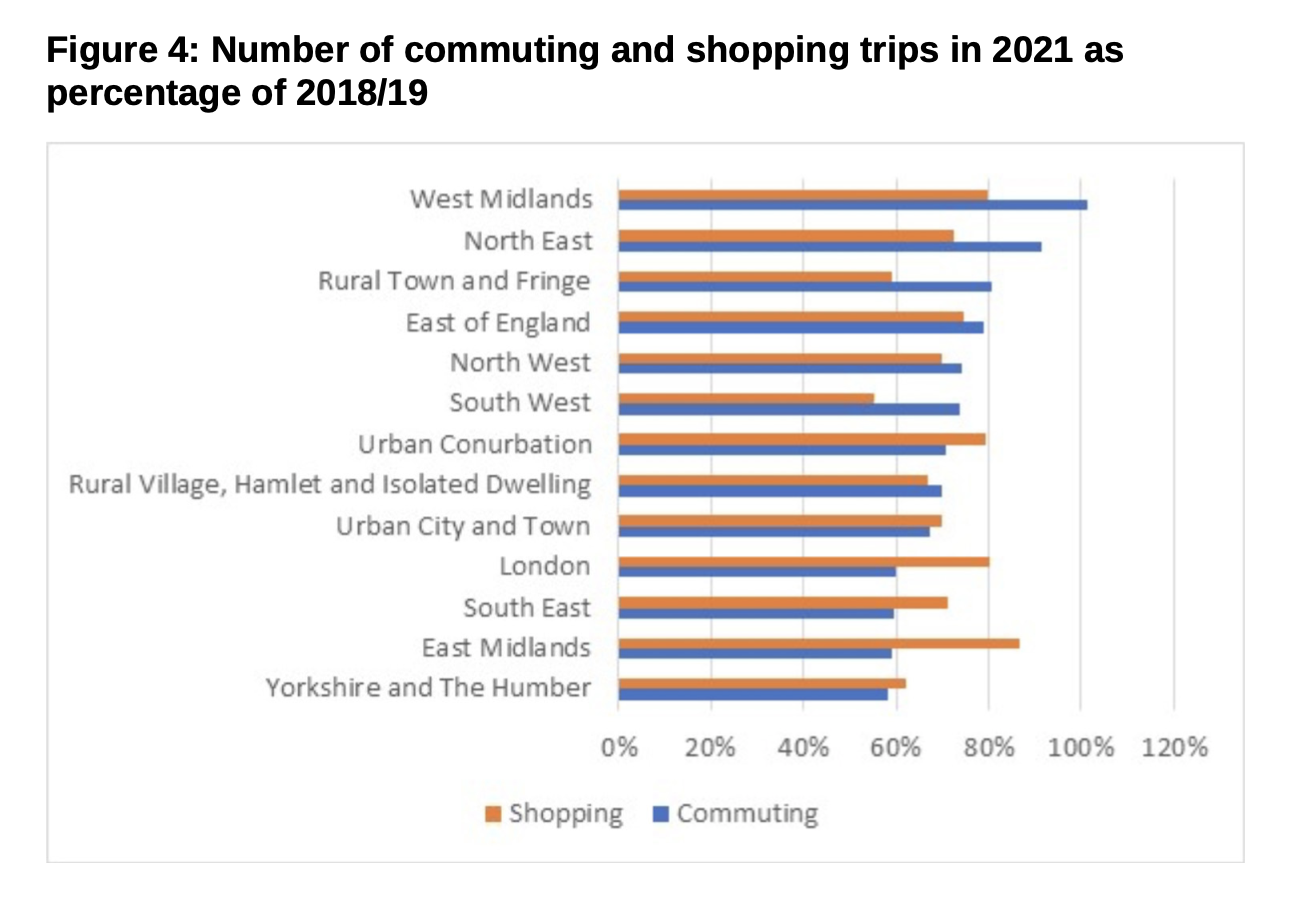
However, changes in travel patterns have not been uniform around the country as figure 4 illustrates. In the West Midlands, the average number of commuting trips per person in 2021 was actually higher than pre-pandemic, while in the North East they were over 90% of 2018/19 levels. They also held up far better in rural towns than urban cities. In part this reflects differences in the economic structure of regions and areas. Manufacturing jobs cannot be done remotely, while office-based jobs can be more easily done so. There is less variation in the reduction in shopping trips, down by 15% in the East Midlands to 45% in the South West.
Car use
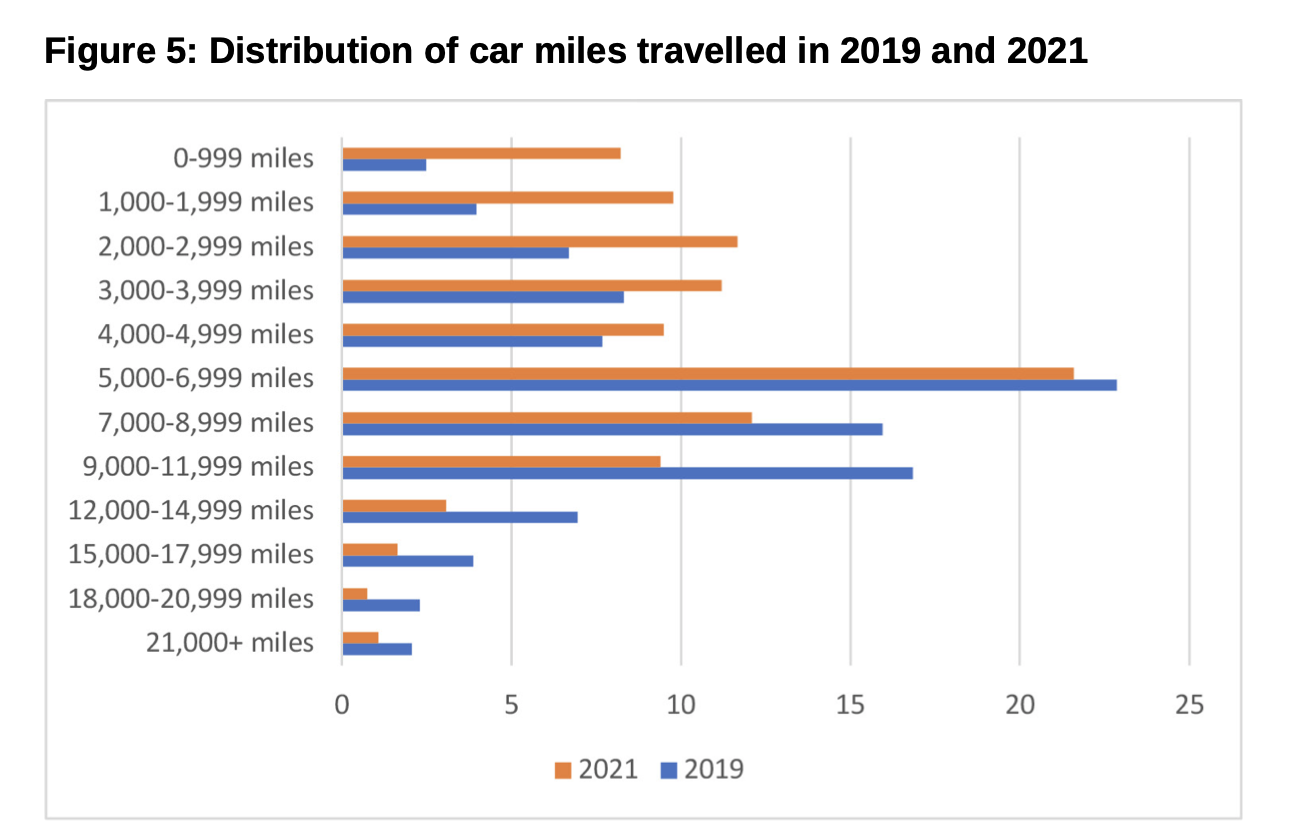
Not surprisingly 2021 saw our cars parked up a lot more than usual. In 2019 roughly the same proportion of cars were driven more than 21,000 and less than 1000 miles, 2% in both cases, while in 2021, 8% of cars registered less than 1,000 miles and just 1% did more than 21,000 miles. Whereas pre-pandemic 56% of cars were driven between 5 to 12,000 miles, this fell to 43% in 2021. In fact just over half of all cars were driven less than 5,000 miles compared to 30% pre-pandemic.
Walking
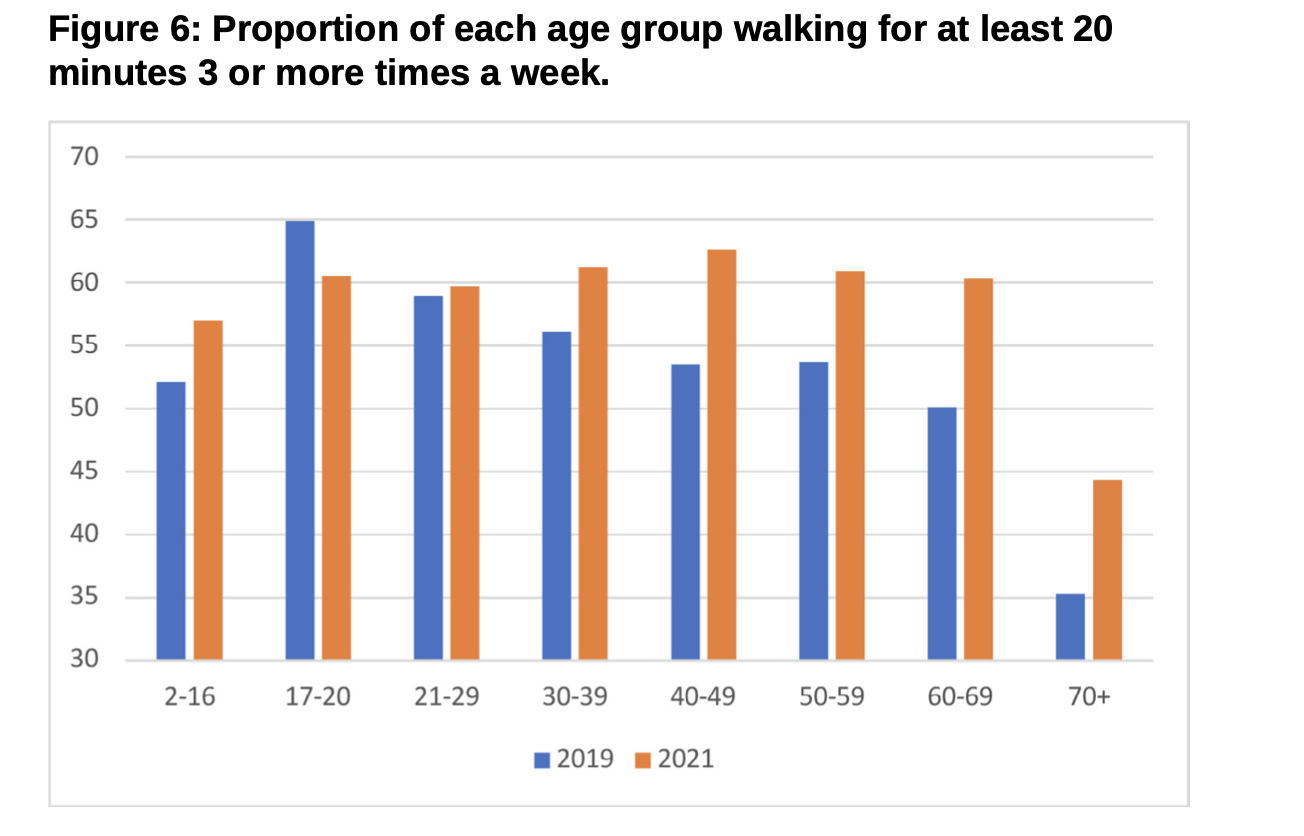
Has the pandemic got us walking more? Well it depends on how old you are. Figure 6 shows the percentage of each age group who walk for at least 20 minutes at least 3 times a week. For those in the 17-20 age band, who are typically those that walk most, there has been a small decline in walking activity between 2019 and 2021 presumably as they have not been socialising as much. For those over 30 there has been a marked increase in walking with a rise of around 10 percentage points for each age group which should have material health benefits if maintained in the future.
Travel and Income
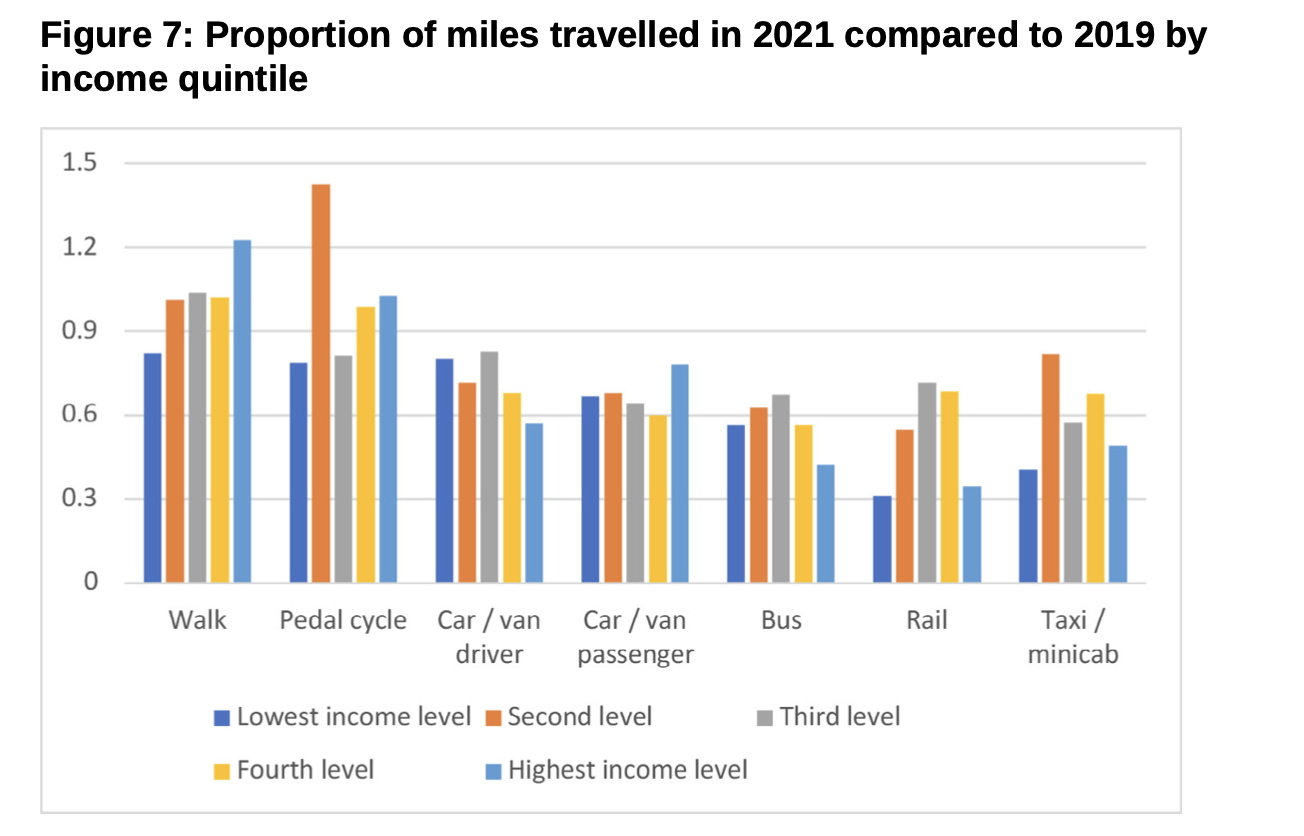
How our travel habits have changed is influenced by our income which generally reflects occupation and hence the ability to work from home or not. Figure 7 shows the proportion of miles travelled by mode by income quintile in 2021 compared to 2019. It is notable that it is the highest income group who increased their walking most, up over 20%, possibly due to having more leisure time as they are not commuting so often. It is the second lowest quintile group that took up cycling the most. Again possibly due to working from home, car use fell the most, down by 40% among the wealthiest quintile.
Men and women
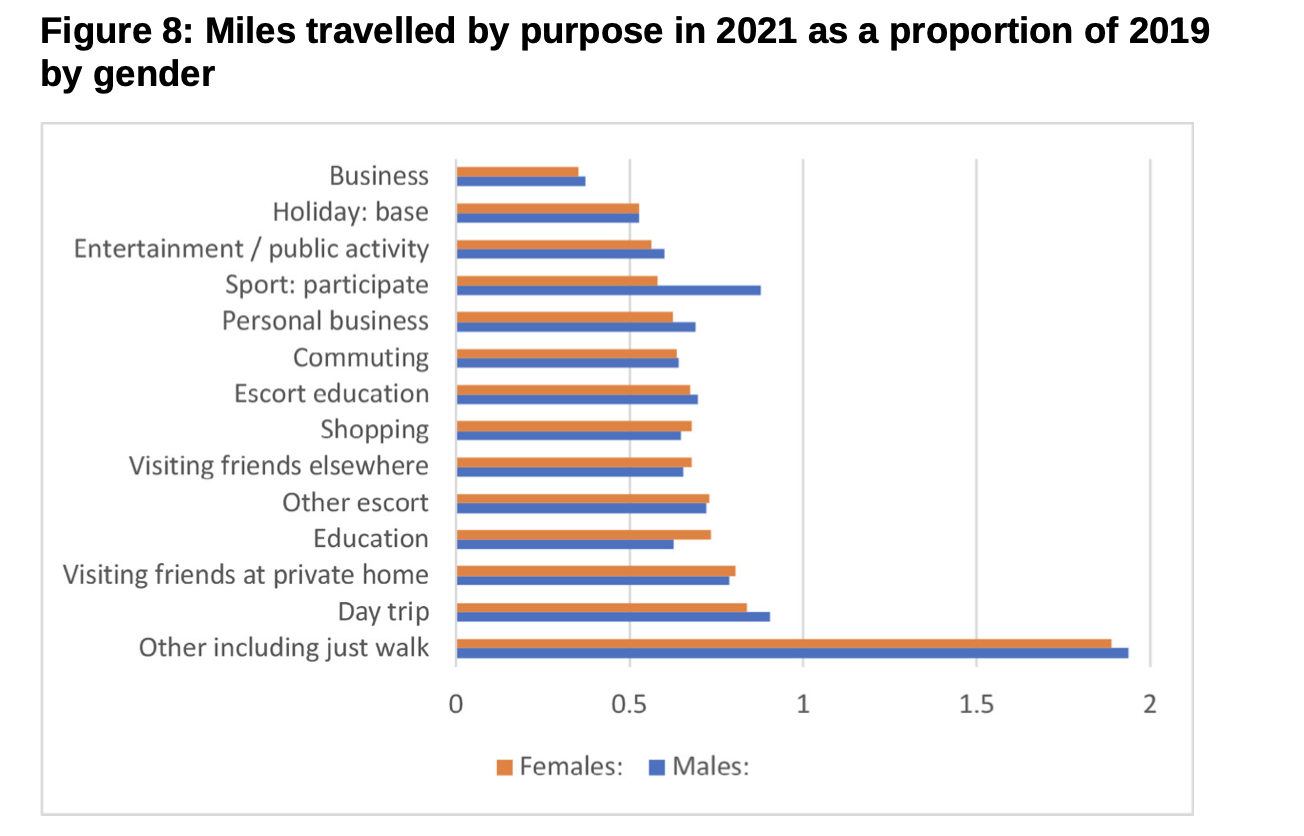
Men and women’s journey purposes are markedly different, but the pandemic seemed to have mainly impacted them in the same way. The differences that stand out most are that men continued to participate in sport far more than women, and they relatively increased escorting children to school more, again presumably aided by greater working at home.
Online shopping
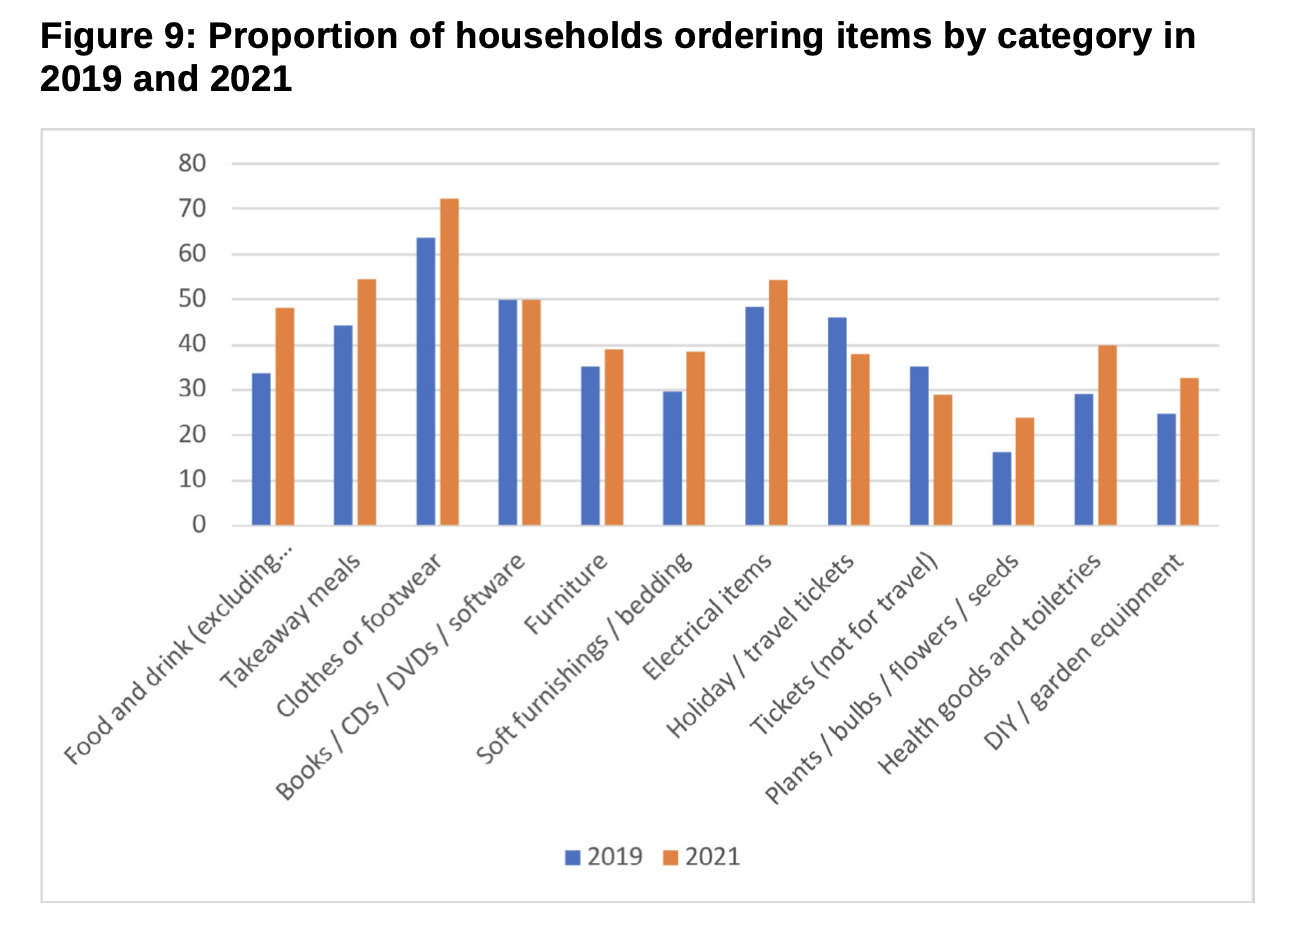
Besides working from home the other reason less trips were made is that we had far more home deliveries in 2021 compared to 2019. In 2019 31% of households ordered items for home delivery at least once a week, this had increased to 46% by 2021. The items ordered also changed as shown in figure 9. There were marked increases in the proportion of households ordering food and drink, up by over 10 percentage points, and take-aways. Although ordering clothes or footwear was most common with 70% of households ordering these items. While not surprisingly there was a fall in those purchasing tickets for travel and other events. Purchase of leisure activities increased but perhaps surprisingly not books and software etc.
Conclusion
We have yet to reach a new status quo but it would appear the pandemic has so far changed our travel patterns. There has been a clear and sustained increase in leisure travel although this is now at risk due to the energy crisis. Online retail is here to stay but there has also been a return to in-person shopping and a decline in online sales in recent months. Commuting and business travel may be permanently changed for at least a proportion of the working population.
We await with interest which trends have continued or changed when subsequent years’ National Travel Surveys are published.
All data is sourced from: https://www.gov.uk/government/statistics/national-travel-survey-2021
John Siraut is director of economics at Jacobs.
This article was first published in LTT magazine, LTT853, 20 September 2022.
You are currently viewing this page as TAPAS Taster user.
To read and make comments on this article you need to register for free as TAPAS Select user and log in.
Log in