TAPAS.network | 9 April 2024 | Commentary | Peter White
What is the place for DRT in the wider public transport system?

Each transport mode has operational and economic attributes that define its potential to play a role within the overall mix of options. As technologies and business concepts evolve, the transport options change too. But reality and cost-effectiveness, rather than promotional claims, should define the most appropriate choices in public policy and expenditure on them, argues . He is concerned in particular about an absence of consistent examination and evaluation about what Demand Responsive Transport can deliver at an acceptable cost.
THERE IS A CONTINUING DEBATE about the appropriate roles for Demand Responsive Transport (DRT) within the transport mix in Britain and elsewhere, rather belatedly taking place after a surge of public expenditure on such schemes seemingly, and surprisingly, having taken their benefits and performance for granted. Many new schemes have been set up with public funding, but in most cases this represents a very high cost per trip made, with little prospect of attaining commercially-viable operation or indeed even one at an acceptable public expenditure of subsidy per trip, despite claims that DRT can be an answer to all kinds of gaps in provision or cost issues in the existing public transport network.
I welcome the detailed and comprehensive paper by Dr John Sutton recently published in TAPAS[1], which provides at last some information on the fundamental capability and capacity issues of running DRT services - and the likely costs and revenues. I am aiming to add some further thoughts on these issues here, and to seek to place DRT in a pragmatic place within the overall range of public transport options.
Having studied the landscape of passenger transport provision over the past fifty years, I am familiar with the emergence of new technologies, operating variants and business concepts – many initially promoted within the sector and outside it - as ‘the answer’ to various mobility and accessibility problems. Some of these can be seen as successful, such as the adoption of the travelcard and later smart card as pricing mechanisms which simplify transactions for the user. In some cases, commercially viable operation can result, such as improved interurban bus services and express coach expansion. However, there is a need for rational assessment of their outcomes, especially where substantial public funding is involved. While some degree of experimentation is desirable, with its attendant risks, monitoring of outcomes against experience is essential. DRT services have been around for over twenty years, notably the extensive ‘Call Connect’ system in Lincolnshire (see panel below), yet we seem to be repeating experiments rather than applying and adapting thinking in response to accumulating experience.
We should bear in mind that the roles of individual modes fit within a pattern of overlapping and complementary transport systems that make up a ‘hierarchy of modes’ suited to meeting different travel needs based on their particular capacities, passenger appeal, operational performance and economics of supply, and their consequent contribution to overall transport policy aims.
No one would sensibly present a tram route as a solution suited to meeting transport needs in rural areas, for example. Taxis serve a useful role, but in congested urban areas may represent inefficient use of road space due to poor occupancy rates and empty positioning runs.
In some cases, an innovation may prove worthwhile for a period, but is not sustainable in the longer term. For example, high-frequency urban minibuses in the 1980s undoubtedly created large increases in ridership, but relied on very low driver wage rates which were unsustainable. Should fully-driverless buses become feasible, this concept could potentially be revived. Likewise, commuter coaches in London were viable for many years, but have almost completely disappeared, as a result of growing traffic congestion and improved rail services.
So where does, or might, DRT (or DDRT, with the added ‘D’ for Digital in its most recent brand re-invention) fit in? In any such analysis it would surely be most useful to establish some basic capacity/cost parameters of its ability to handle trips before making claims about DRT’s potential to replace other modes, or provide some new offer that can tempt people out of their cars at an acceptable cost to the public purse (and indeed a net benefit to the planet it terms of carbon footprint) compared with the status quo.
The underlying issue is how one establishes a balance between a taxi-like service meeting individual passenger needs, and the element of ride sharing, which increases average load carried but results in indirect routeing and variable journey time for the users, as analysed in highlighted in John Sutton’s recent article. The nub of the issue seems to both him and me to revolve around where DRT can sit in terms of service offer between buses and taxi/private hire modes (including the likes of Uber), what capacity can DRT vehicles genuinely manage, and at what comparative costs per passenger and/or to the subsidy call on public funds.
Public transport is traditionally based on aggregating demand by running on fixed routes and fixed times, compared with the individual use of a taxi. To what extent can DRT ‘bridge the gap’ in practice, at an acceptable cost? The evidence so far is unconvincing.
For example the withdrawal of many DRT schemes as economically unsustainable has been recorded extensively in LTT magazine and elsewhere in recent months, whilst the recent County Councils Network survey showed that only 16% in a sample of member authorities considered their DRT services to be sustainable in the longer term[2]. A study for the DfT meanwhile showed a low average utilisation of vehicles in schemes analysed, including a substantial proportion of empty running – for 8 schemes where data were available, an average of 45% (derived from table 7 in that report)[3].
A convenient overall productivity indicator is passenger trips per vehicle per annum. As I have shown elsewhere[4] for many DRT schemes this is around 6,000 or less, around one tenth of the average for all buses outside London in 2022-23. Whilst one would expect services in low-density areas to carry substantially fewer trips than the average bus, the issue is how much lower they are. Given that driver costs are the largest single element, there is limited scope for radical reductions in total cost when using minibuses (even if lower rates can be negotiated, the national minimum wage would set a floor to this). If, for example, total minibus costs per vehicle-km were around 65-70% of those for full-sized buses, a very high cost per passenger trip is bound to result.
As John Sutton’s detailed paper in TAPAS indicate, there is meanwhile a fundamental contradiction in the DRT model between offering (or implying there can, or will be), a taxi-like service to suit the needs of each user, and recognising the operational necessity of combining passenger trips to improve loadings, and reduce the cost per passenger figure. This may result in longer waiting times plus indirect routeings, and hence greater journey time, the overall result being low utilisation of vehicles in terms of journeys undertaken per vehicle hour. Parallels may be drawn with his calculations for trips per vehicle-hour at which DRT might be an option between taxi and fixed route bus, and those of Steve Wright of Newcastle University who suggested that this would apply between 10 and 50 passenger-km per vehicle hour, with a lower degree of route flexibility at the higher end of this range[5] - at an average trip length of 7km this would imply 1.5 to 7 passenger boardings per vehicle-hour.
One option is to find additional sources of ridership, through sharing by people making common journeys at set times notably by reviving the ‘Total Transport’ concept as discussed in LTT883 (9 January 2024) and by Peter Stonham on TAPAS - for example, by integrating with non-emergency health transport. A further option may be merging with some school contract work (already representing a mandatory responsibility of local authorities), now being considered for the ‘Pingo’ DRT service operated in the Scottish Borders region. For example, even ten pupils carried in each of the morning and afternoon periods could boost ridership per vehicle per annum by about 50% if existing ridership is around 6,000. This may require fixed scheduling according to vehicle availability at certain times of day, but could be a better alternative than entire withdrawal of DRT service where costs are unsustainable.
I’d now like to take a further look in this article at two additional issues - a recent DfT attitudinal survey about DRT, and the scope for setting common journey time reliability criteria for both fixed route bus and DRT. I’ll then conclude with a look at possible ways forward that set achievable general objectives for providing accessibility and mobility in low density/demand areas through which DRT might contribute in appropriate circumstances, rather than being regarded as an ‘all purpose’ solution.
Do attitudinal findings match up with practical outcomes?
The recent round of the National Travel Attitudes Survey (NTAS) recently issued by DfT included questions on perceptions of DRT[6]. The responses indicated a positive outcome, with about 40% preferring a DRT service to fixed route, be willing to use a DRT service rather than a car, to pay more than for a fixed route service, and agreeing with the contention that DRT would be more reliable than a fixed-route service. A similar proportion did accept that journey times would be longer, or take a less direct route. There was a clear preference for using apps rather than a call centre to make a booking, especially among younger respondents, but the those aged 70 years or older indicated the opposite pattern.
Given these results, it may seem surprising that the experience of DRT services where they offer an alternative to fixed route services within urban areas has in some cases been less positive, with the latest being discontinuation of services due to low usage and high public expenditure per passenger in East Leeds and Watford, and replacement of a developer-supported service in New Lubbesthorpe (near Leicester) by a fixed route. One possibility is that respondents were reacting to an abstract and broadly-defined concept of DRT, rather than basing their views on direct experience of using it (the survey data are classified by level of use of conventional bus services, but do not indicate whether respondents had used DRT).
The other question is the extent to which willingness to pay more would be affected by the actual amount of expenditure involved. No specific sum was suggested in the survey, but a modest premium such as 30% would be a very different matter to several £ that might be needed to ensure commercial viability. It is also noteworthy that in some cases market research which appears to show potential demand for a new product is not necessarily borne out in practice, as illustrated in a recent episode of the BBC’s ‘The Bottom Line’ business programme (“The Say-Do Gap”, first broadcast on 15 February).
Nonetheless, the survey does raise the question of whether some users will trade-off a longer in-vehicle time for other benefits. One should also note that two DRT services reported at the Landor webinar in March reported high user satisfaction scores, in both cases serving low-density rural areas where fixed routes did not represent an alternative. The element of ‘personal service’ was also appreciated by DRT users in one case, although this may also reflect the small numbers involved.
Can we define a common standard of journey time reliability for fixed routes and DRT?
One of the problems with defining and providing DRT is setting some consistent level of service parameters – including walking times and reliability - that both operators and users can both fairly base their expectations upon. This could avoid claims and assumptions that DRT is just like a taxi service in terms of individually timed and tailored door- to door travel, whilst in a vehicle providing for a number of different people’s origins and destinations and travel times - something simply impossible to achieve.
For some years, in relation to buses, the Senior Traffic Commissioner has applied a reliability standard for fixed routes, that operators should aim for a ‘window of tolerance’ in which 95% of timetabled departures arrive at timing points not more than one minute early or five minutes late. In practice, some flexibility is allowed where conditions vary beyond the control of the operator, but nonetheless it is expected that timetables reflecting predictable external conditions will be set (such as the need for greater running time at peak periods). In effect, this standard implies the achievement of agreed levels of predictability not only of waiting time at the stop where the passenger boards a service, but also of in-vehicle journey time (due to the same reliability constraints being applied to timing points along the route).
A variant on this is the use of ‘Excess Waiting Time’ (EWT) as used by Transport for London, where services operate at high frequencies (typically 5 or more journeys per hour) both to measure inferred waiting time and as performance criterion in service contracts with operators. In such cases, passengers tend to arrive independently of the timetable rather than aiming for a specific timetabled trip, as confirmed in research following conversion of a 20-minute headway double-deck service to a 10-minute minibus service[7]. If a service ran at perfectly regular headways, then average waiting time would be half the headway (e.g. 5 minutes for a 10 minute service). In practice, such perfection is not attainable. EWT reflects this by estimating average waiting time allowing for actual vehicle arrival times at a stop (derived from the ‘i-bus’ system in the London case), typically around 1 minute in recent years. Given that waiting time has about twice the disutility of in-vehicle time (a factor also relevant to the possible willingness of DRT users to trade-off some increase in in-vehicle time against a shorter wait), a focus on EWT could be seen as appropriate where journeys are short (as in London), but it may be less appropriate where longer journeys occur.
In practice, a bus user would plan their journeys based on recent experience of bus use – for example, in travelling to work at peak periods - with a margin of time travel time allowed to ensure on-time arrival, a concept developed in a paper by staff of ODI and Travel for West Midlands at the Transport Practitioners’ Meeting in 2018[8].
Two other factors also affect user journey time:
-
Walking time to and from stops
-
Whether it is possible to board the first bus to arrive at a stop (implicitly assumed in EWT).
In practice this will be true in the vast majority of cases, although some exceptions may occur at peak periods, notably when heavy school loads are carried.
So how does this concept as applied to buses also apply to with DRT? The theoretical image of a DRT vehicle turning up just a few minutes after being requested to take the passenger directly to the desired destination may be recognised as unrealistic. A request in advance of travel needs to be accepted, and a vehicular journey then planned, combining this request with other trips, but some level of reasonable passenger expectation is obviously needed for the service to function effectively.
An indication of a desired reliability level for DRT can be seen in the latest BSIP guidance[9], that operators should provide a pick-up (after a booking being accepted) within a 20 minute time window of the requested pick-up time (which can also be specified as “…not more than 10 minutes before or 10 minutes after the agreed pick-up time..”), compared with 5 minutes of the scheduled time for a fixed route bus (i.e. as per the Senior Traffic Commissioner’s criterion, above). However, there is also the question of expected and actual in-vehicle passenger journey time and the predictability of arrival time at the destination. This will be affected by the other users’ requests being accommodated on the same vehicular trip. From an individual passenger’s viewpoint, the ideal would, of course, be something at least close to a taxi service. However, if the whole aim of a DRT service is to offer something in the ‘public transport’ hierarchy by combine differing users’ requests, this means a less direct route will be followed (and unique to each trip), requiring the user to allow a sufficient margin of extra journey time to arrive on time, compared with what a direct journey would offer.
Three other factors also apply. The DRT service could offer journey time savings compared with a scheduled bus service through reduced walking time to the pick-up point. Although not running door-to-door, most DRT services pick up at ‘virtual stops’ within about 200 metres of the origin, compared with a walk of up to 400 metres or sometimes more to a fixed route bus stop. Second, the importance of a predictable destination arrival time will vary with journey purpose (both for fixed route buses and DRT). It will be obviously less critical for a social visit or shopping, than work or study start time, a medical appointment, cinema or theatre performance, or connecting with a scheduled service. The third factor is whether a trip is accepted, and then undertaken as offered. The most recent DRT study for DfT (reference 3, figure 10) indicates that on average for five schemes studied, 13% to 19% of journey bookings were not fulfilled, either due to vehicle capacity not being available (in contrast to the general ability to board almost any fixed route journey) or passengers cancelling their booking - presumably because the anticipated level of service did not meet their needs. This outcome also raises the issue of the ‘no show’ cost penalty that applies (if any).
Such detailed performance data is fundamental to any assessment of the role and performance of DRT. It should be capable of production fairly easily for all DRT user journeys (apart from walking time). The Bus Open Data Service (BODS) data will give variability in both vehicular arrival time for a timing point near the boarding stop, and journey time to destination stop (where this can be inferred). Booking data on DRT systems should enable both pick-up and destination arrival timings to be derived.
Given the wider margin for arrival time at stop or pick-up point, and the greater variability in routeing of the journey, the implication is that DRT would provide a less predictable arrival time at the destination, than either a scheduled bus service or taxi. All types of service could of course be affected by traffic congestion.
Some possible ways forward
Putting all this together, one could suggest that a relatively attractive DRT service would be one serving a compact catchment area, so that user requests could be met within a reasonably short time window, with journeys focussed on a core destination, hence the variability of in-vehicle passenger journey times thus being fairly small. An example is the service operated by Go Coach of Sevenoaks, Kent in the immediate hinterland of that town which is able to serve requests made in real time with an average waiting time of 20 minutes[10]. About 30,000 passenger trips per year are made using three vehicles, implying about 10,000 trips per vehicle per annum, a higher figure than many other reported DRT schemes. However, this still requires a public subvention of about £10.90 per trip made[11].
Compared with this ‘local catchment /destination focused’ type of DRT, where DRT services are used to cover an eclectic and relatively random set of needs in wide-ranging rural area, then longer and potentially more variable journey times are inevitable. An objective of providing a basic level of accessibility may thus be met, but attractiveness to those with alternatives available may be poor, and the overall perception of the service quality likewise be regarded as unattractive.
Another longer term possibility is that driverless public service vehicles might become feasible, and change the cost model, although clearly the rate of progress is far less rapid than naïve hopes of a few years ago implied. However, if we are to apply consistent criteria to DRT and fixed route operation, scope for automating the latter would also apply (indeed, probably easier on a fixed bus route than for a variable route service using smaller country roads with mixed traffic). This would enable higher frequency fixed bus routes and/or a denser service network to potentially be established without the cost of drivers.
A legitimate criticism of fixed route bus networks is that they may be slow to respond to changes in potential demand, and that greater experimentation may be needed to test the response to new routes and links. In this regard, although prohibitively costly as a permanent alternative, DRT might make sense for a limited period as a form of ‘market testing’. One could see the period of Sunday DRT operation in Newport, Wales as an example of this, enabling data to be gathered on demand patterns from which a new fixed route network could be designed. The recent plan to convert Newport service DRT31 to fixed route, as reported in LTT887 (6 March 2024), seems to represent a similar development.
Whatever experimentation continues, it is important that systematic monitoring of outcomes is conducted, and clear vehicle productivity cost and usage figures are revealed. As with any mode taking its place in the modal hierarchy the cost per unit of the service provision, and the required income per passenger to offer it at an acceptable price with or without subsidy are fundamental data inputs. There is a danger that the high levels of financial support required to sustain some current DRT services could produce a temptation to ‘change the rules’ of evaluation rather than apply consistent criteria.
References and Links:
-
John Sutton ‘The Theoretical and Practical Limits to Demand Responsive Transport Services’, Local Transport Today issue 887, 6 March 2024, pp20-29 (and accompanying TAPAS article examining these in greater depth), https://www.tapas.network/51/sutton.php
-
County Councils Network press release ‘Three in four rural authorities roll out new ‘demand-responsive’ transport but warn that they are not a substitute for traditional bus services’ 25 October 2023
-
Pantelaki, E., Chatterjee, K. & Nawathe, V. (2023). Rural Mobility Fund Evaluation: Interim Report. Report to Department for Transport
-
Peter White ‘Call and Response: What is the appropriate role for demand responsive bus services?’ cittimagazine February 2024, pp16-18
-
Wright, S. ‘Designing flexible transport services: Guidelines for choosing the vehicle type’ Traffic Engineering and Control Vol 36 (1), 2013, pp76-92
-
DfT ‘National Travel Attitudes Survey (NTAS) Wave 9: bus services, zero emission buses and fare caps’ published 18 January 2024
-
White, P.R.; Turner, R.P. and Mbara, T. ‘Cost Benefit Analysis of Urban Minibus Operations’ Transportation, Vol 19 (1992) pp59-74
-
Forth, T. and McClure, N. (ODI Leeds), Evans, P. and Pass, D. (TfWM) ‘Real Journey Time: A new understanding of bus passenger experience; measurement and applications’ Paper at Transport Practitioners Meeting 2018, Oxford
-
DfT ‘National Bus Strategy: 2024 Bus Service Improvement Plans. Guidance to Local Authorities and Bus Operators’. January 2024, page 35
-
Peter Jackson ‘First Responder’ [feature on development of DRT services by Go Coach of Sevenoaks]. Coach and Bus Week 9 February 2021, pp22-29.
-
Report of talk by Austin Blackburn, Managing Director of Go Coach, to the Omnibus Society London April 2023, as reported in ‘The Omnibus Magazine’ August-September 2023, pp 6-7
-
Innovation needs analysis – so why has DRT had so little? by Peter Stonham, https://www.tapas.network/32/stonham.php
-
Time for Total Transport to come out of the DfT’s ‘too difficult’ tray by Peter Stonham, https://www.tapas.network/47/stonham.php
-
Can 30 DRT minibuses really hope to successfully replace up to 40 bus routes? by Roger French, https://www.tapas.network/32/french.php
Serving rural Lincolnshire flexibly for 20 years
Lincolnshire’s county-council supported bus network has included ‘CallConnect’ demand-responsive services for over two decades. These were introduced to maintain provision when conventional services became financially unsustainable and have evolved over time. Lessons can be learned for what has been achieved about the role of such complimentary elements to rural publich transport provision and how it fits within the wider planning of public transport.
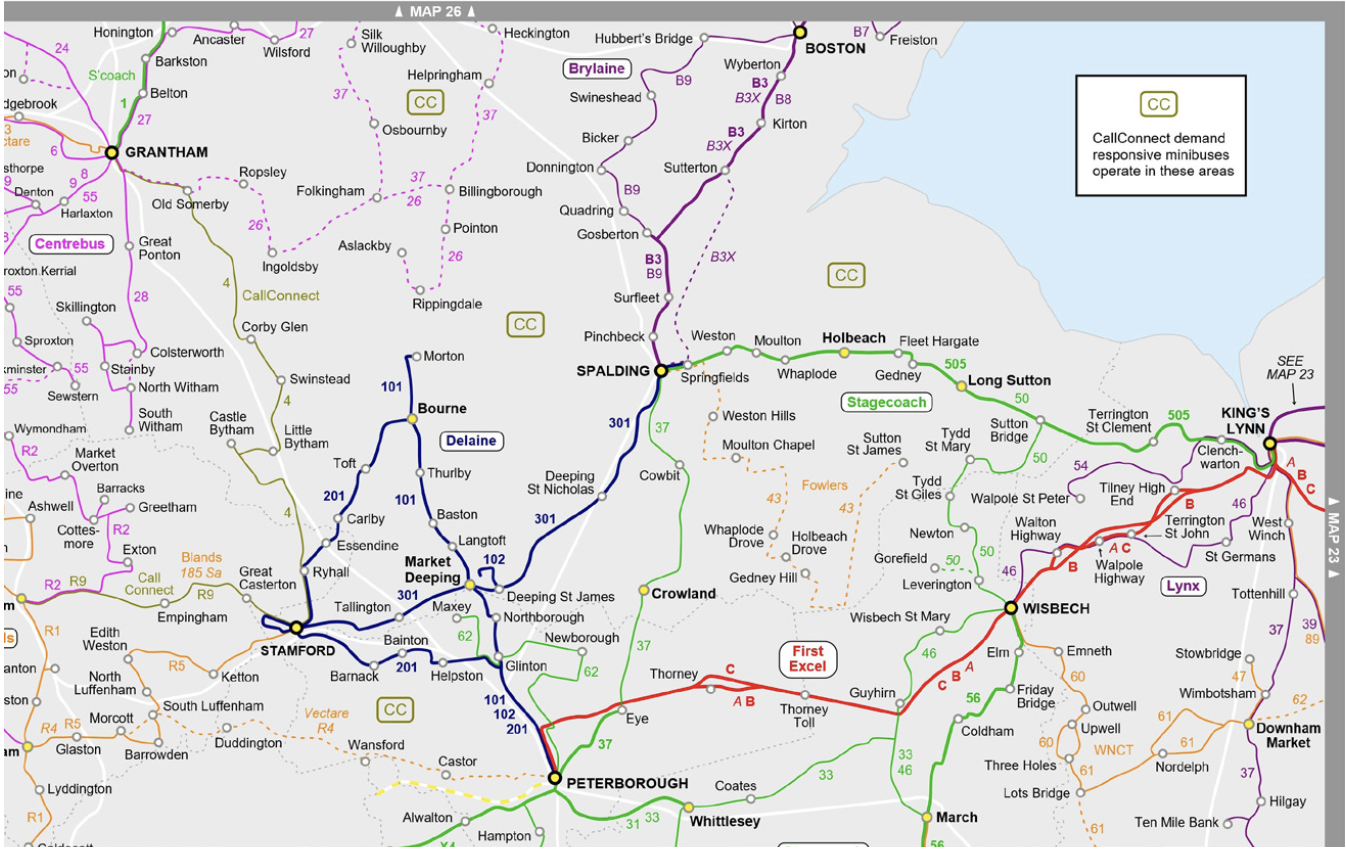
This map shows principal bus services in south Lincolnshire around Grantham, Bourne, Boston and Spalding in September 2023. Fixed routes are denoted by coloured lines for each operator, low-frequency as dotted lines. Solid lines generally indicate services at least three times a day, typically every two hours, and heavier lines hourly, or better (Monday-Friday daytime).
Areas covered by the county-council supported ‘CallConnect’ demand-responsive services (which also runs some fixed routes) are denoted by ‘CC.’ Though in comparison to earlier provision, the fixed route network is now reduced and more fragmented, but substantial low-density areas still served by CallConnect. Conversely, some of the fixed routes now offer better frequencies than before, notably half-hourly for Bourne to Peterborough, and Spalding to Kings Lynn, run by full-sized single and double-decker buses. A striking differentiation may be seen between the areas served by such services, and those by CallConnect.
The map is reproduced from BusAtlas.uk by permission of its compiler, Brendan Fox. The Bus Atlas site provides maps of UK bus services available outside the main urban areas.
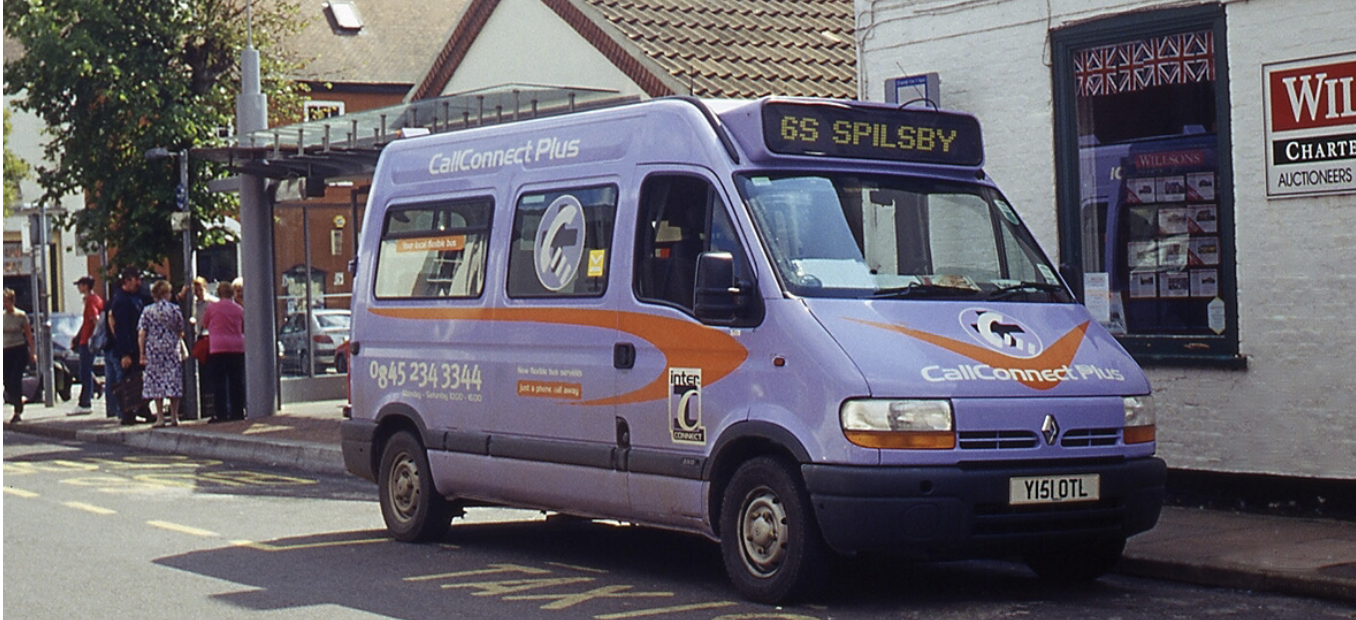
Demand responsive services using smaller vehicles to support bus provision in low- demand areas are nothing new. An 8-seater on CallConnect service at Spilsby in east Lincolnshire (at an interchange with fixed-route services) in 2002, i.e. twenty-two years ago [Peter White]
Peter White is an Emeritus Professor at the University of Westminster, following a long career in teaching and research there, having joined in 1971, back when it was the Polytechnic of Central London. He became Professor of Public Transport Systems in 1992. He is the author of the widely used textbook Public Transport: its Planning, Management and Operation, which is now in its sixth edition, having first been published in 1976.
This article was first published in LTTmagazine, LTT889, 9 April 2024.
You are currently viewing this page as TAPAS Taster user.
To read and make comments on this article you need to register for free as TAPAS Select user and log in.
Log in