TAPAS.network | 21 May 2024 | Commentary | John Siraut
Latest London travel data drills down into changing daily patterns of bus and rail use

Post-pandemic travel behaviour changes have brought a number of challenges for transport authorities and operators, with both revenue implications and service planning issues to address. Tracking data has been emerging only patchily, so has been pleased to examine the comprehensive information now available from Transport for London on key trends.
THE FIRST nine months of the 2023/24 financial year for which comparable figures are available, saw more passenger trips on London’s rail network (Underground, Overground, and Elizabeth Line) at 1,204 million, than on the National Rail network (excluding London Overground and Elizabeth Line), which came in at 907 million. Both these numbers were exceeded by the number of trips on London’s bus network, at 1,426 million for the same period.
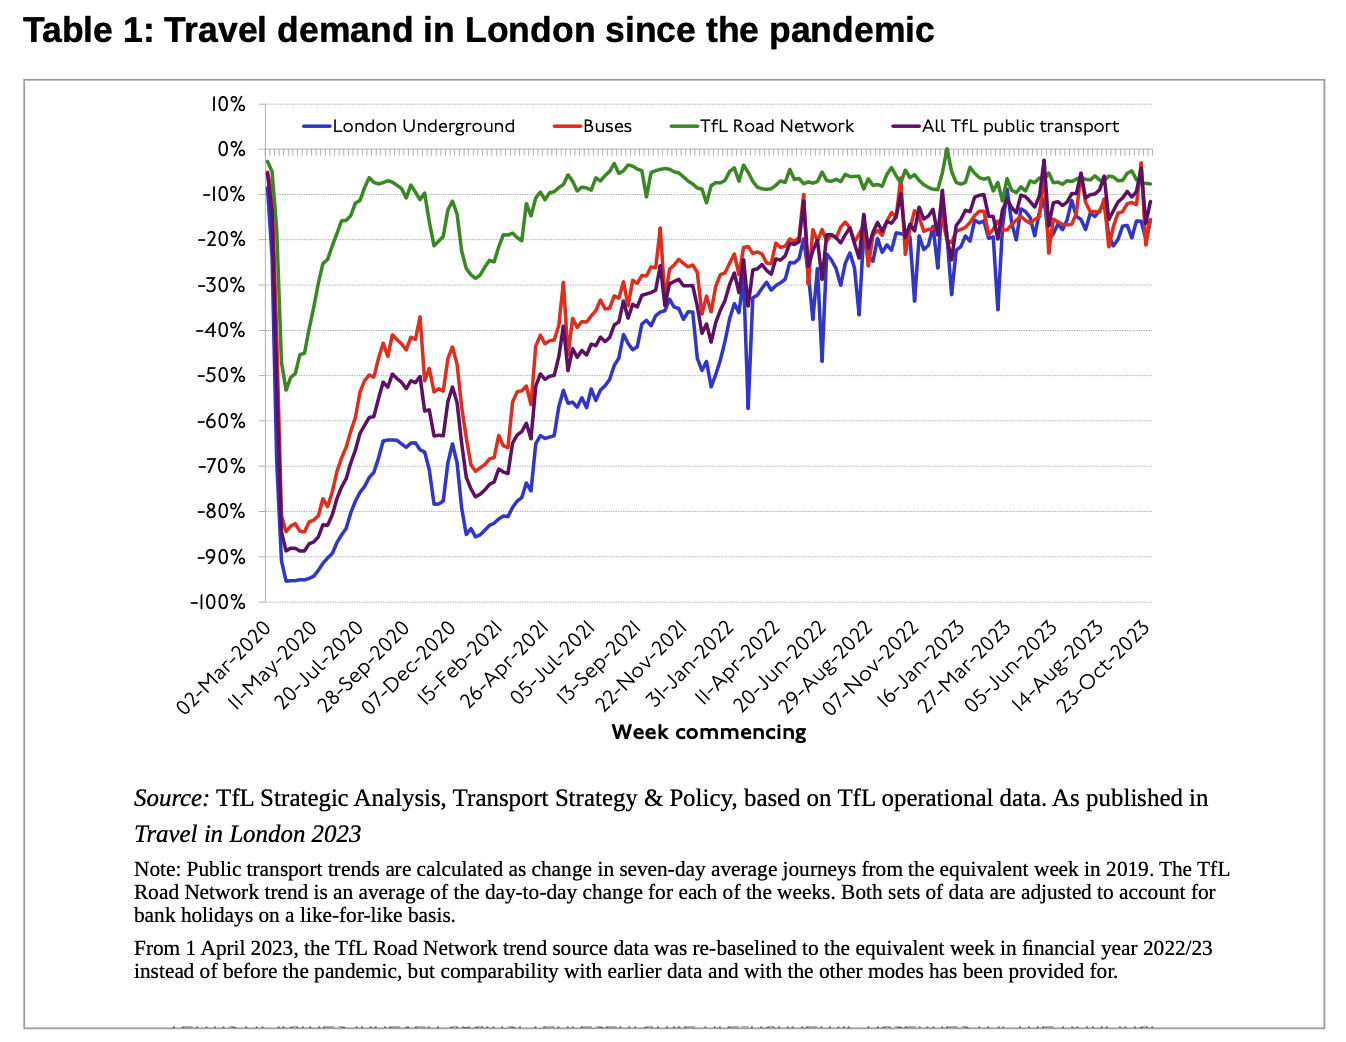
A key issue for all operators and transport authorities is the pace and shape of recovery in travel demand from the unprecedented lows of the coronavirus pandemic during 2020 and 2021. Overall travel demand still remains short of pre-pandemic levels, particularly on public transport, but has recovered to almost previous levels in London as this chart (Table 1) shows. But the devil is in the detail.
While London’s public transport network and economy is unique, it still provides a useful insight into changes taking place in user behaviour post COVID-19 which is being replicated in other major cities. Another area where London is unique is that Transport for London publishes a large amount of timely data on the usage of its network. In addition, given the gated nature of a large part of its rail network, the data that it has is far more accurate than that available for the National Rail network.
To dig deeper into what is going on, in this article I have explored daily tap-in/tap out data from Oyster and Contactless cards covering the one-year period from 21 April 2023 to 20 April 2024 from 434 stations operated by TfL. This includes London Underground, Docklands Light Railway, London Overground and Elizabeth Line stations. A total 1.4 billion transactions are captured by the data. It also looks at TfL’s daily bus usage data which covered 1.7bn boarding transactions over the same period.
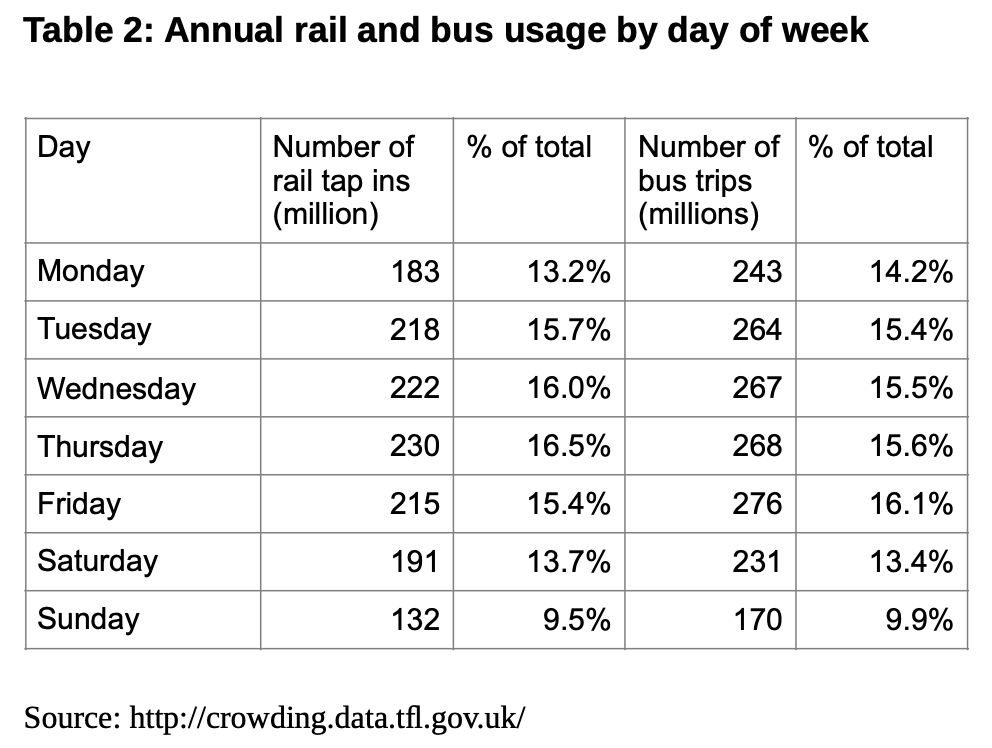
Pre-COVID 19 the use of the public transport network was fairly constant Monday to Friday. This is no longer the case as shown in Table 2. Now, 25% more people use London’s rail network on a Thursday than a Monday, while Saturdays are now busier than Mondays, and Sundays see over 70% of Monday’s traffic,despite services running to a much-reduced timetable and often line closures due to engineering works. Reflecting changed office commuter working patterns,in the City of London and Canary Wharf passenger numbers on a Thursday are now over 40% higher than Mondays.
Use of the bus network is more balanced across the week, but even here there are 14% more trips on a Thursday than a Monday. The proportion of weekly bus trips on a Saturday are slightly less than by rail- 13.4% compared to 13.7%- but higher by bus on a Sunday.
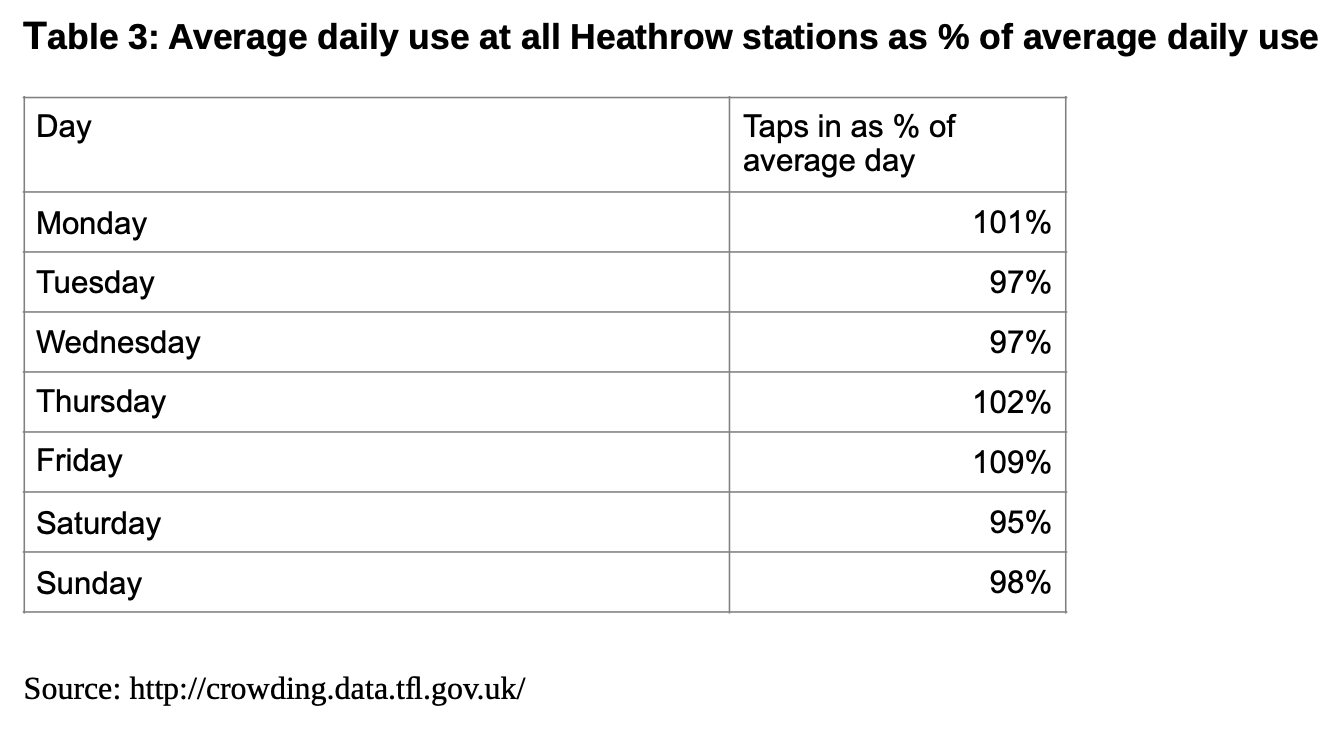
At the other end of the spectrum, it is probably no surprise that Heathrow Airport stations see the smallest daily variation, (Table 3.) Friday is the busiest day, with 9% more transactions compared to the average daily total, and Saturday the lowest with 5% fewer transactions than average.
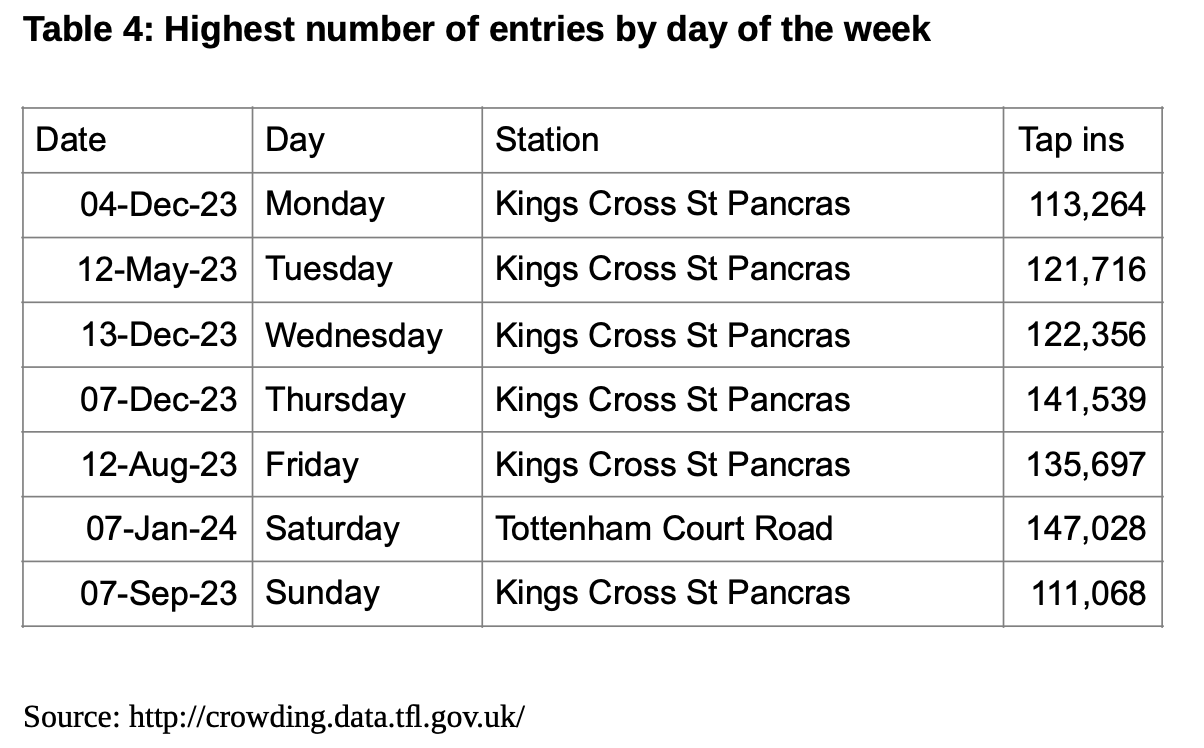
As can be seen in Table 4, the highest number of passengers recorded at any of the main railway termini by day of week broadly follows the overall network weekday pattern, with Thursday having the highest number and Monday the lowest. Kings Cross St Pancras recorded the highest number for all but one day. Alongside these major rail hubs, the exception is that it was Tottenham Court Road that on Saturday 7 January 2024 recorded the highest number of entries of any station over the 12 months being reviewed. Of all the highest volume days of the week, three were those recording their highest numbers in the run-up to Christmas.
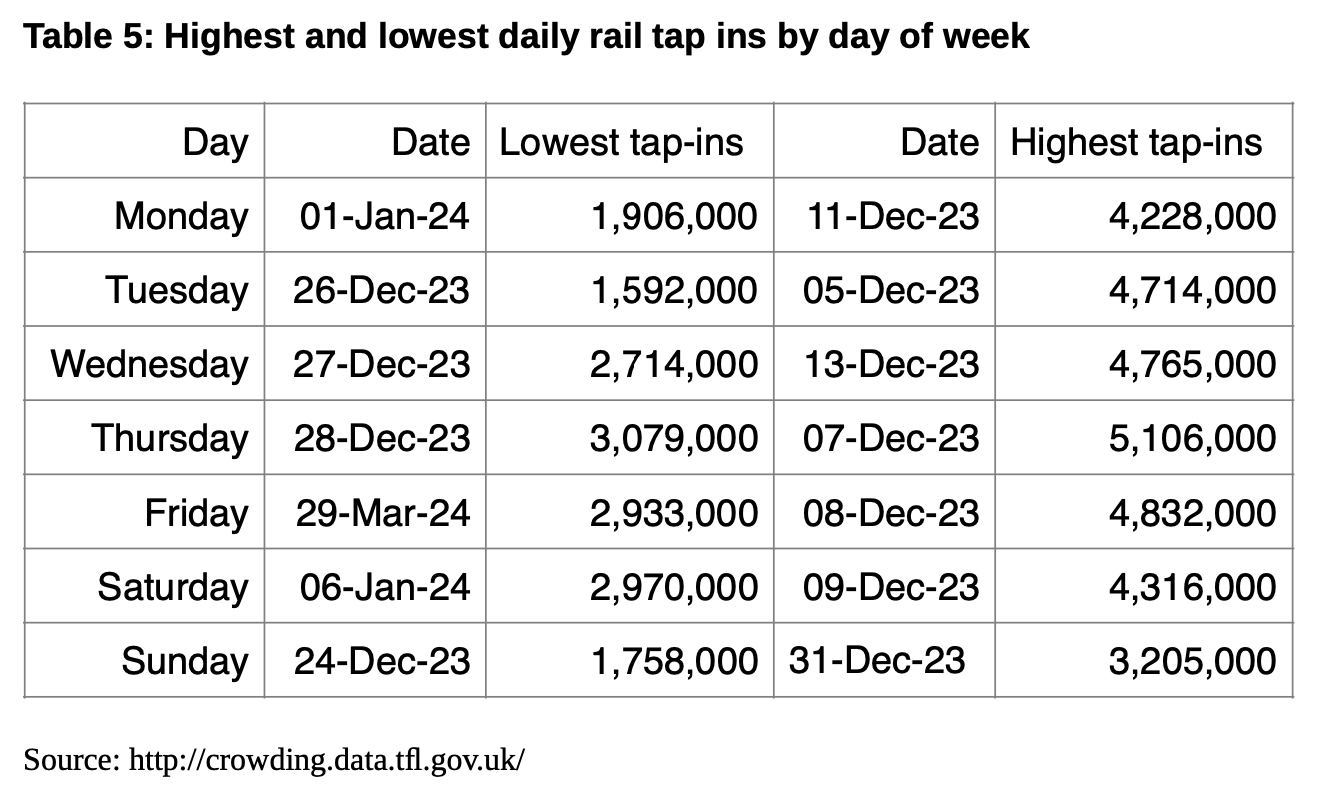
Across the whole TfL rail network, the average daily tap ins were 3.8 million. The busiest days were in the run-up to Christmas 2023 with over 5m tap ins recorded on Thursday 7 December, although the busiest Sunday was on New Year’s Eve, (Table 5.) The quietest days were generally between Christmas Eve and the New Year. However, the quietest Friday was Good Friday. Boxing Day, when there are virtually no national rail services saw the absolute lowest number of users, but this still came in at 1.6m, and was only slightly below the Christmas Eve numbers of 1.8m.
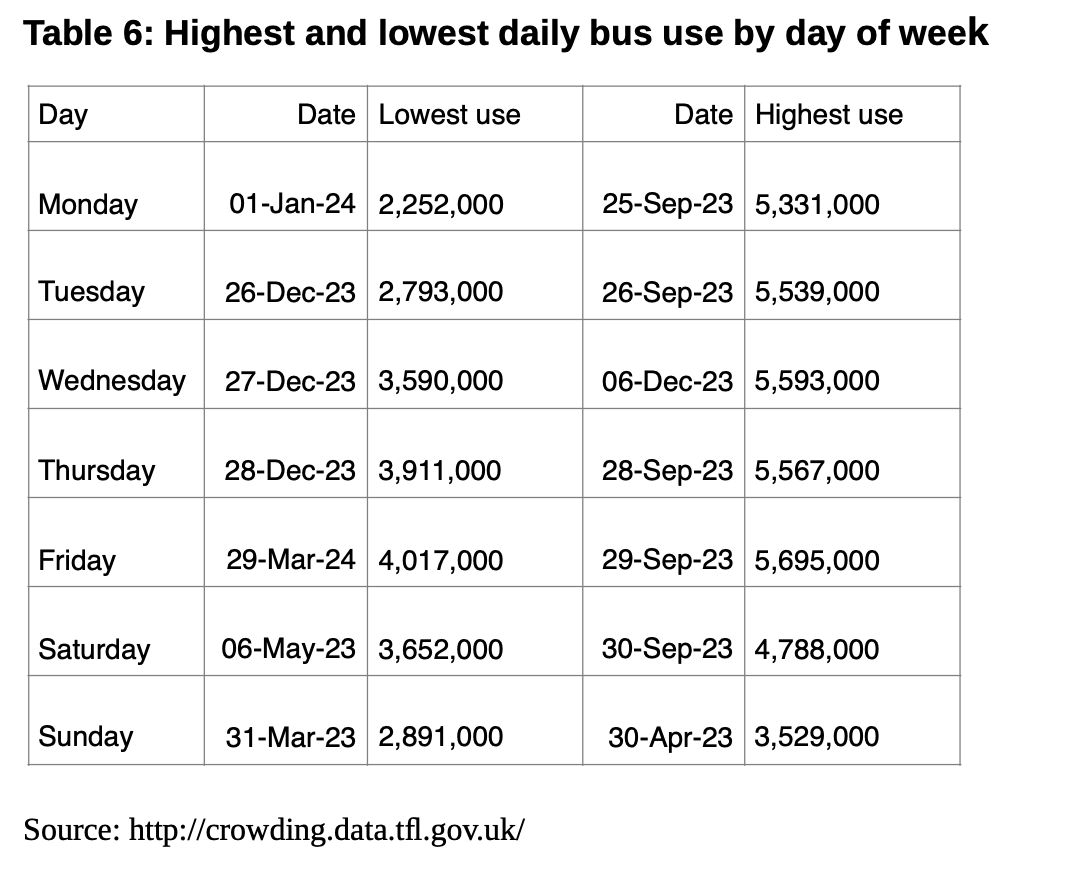
On the London bus network average daily usage is 4.7m journeys. The days of lowest bus usage tend to mirror those on the rail network. The exceptions are Saturday and Sunday, where for the former the lowest total was on Coronation Day, and the latter was Easter Sunday. The highest numbers (Table 6) were however all different, with most occurring in the last week of September which corresponds to the first week of the university term. The highest Wednesday was in the run up to Christmas, and for Sundays it was the 30th April, which doesn’t seem to correspond to any particular event. It is notable that the difference between the highest and lowest usage of the bus network is far less than for the rail network.
The data presented here highlights the fact that though one of the biggest challenges that public transport faces has always been ‘the problem of the peak’ and the large variation in usage, by time of day and seasonally, a significant new pattern of variation is now increasingly by day of the week as well. Do operators provide services to meet the peak Thursday demand, which means surplus capacity for the rest of the week, or just provide enough services to meet Monday demand and cope with overcrowding on the other days of the week? The Sunday experience of an increasing number of people using services at a much lower level of provision than weekdays and Saturdays may be instructive in that regard.
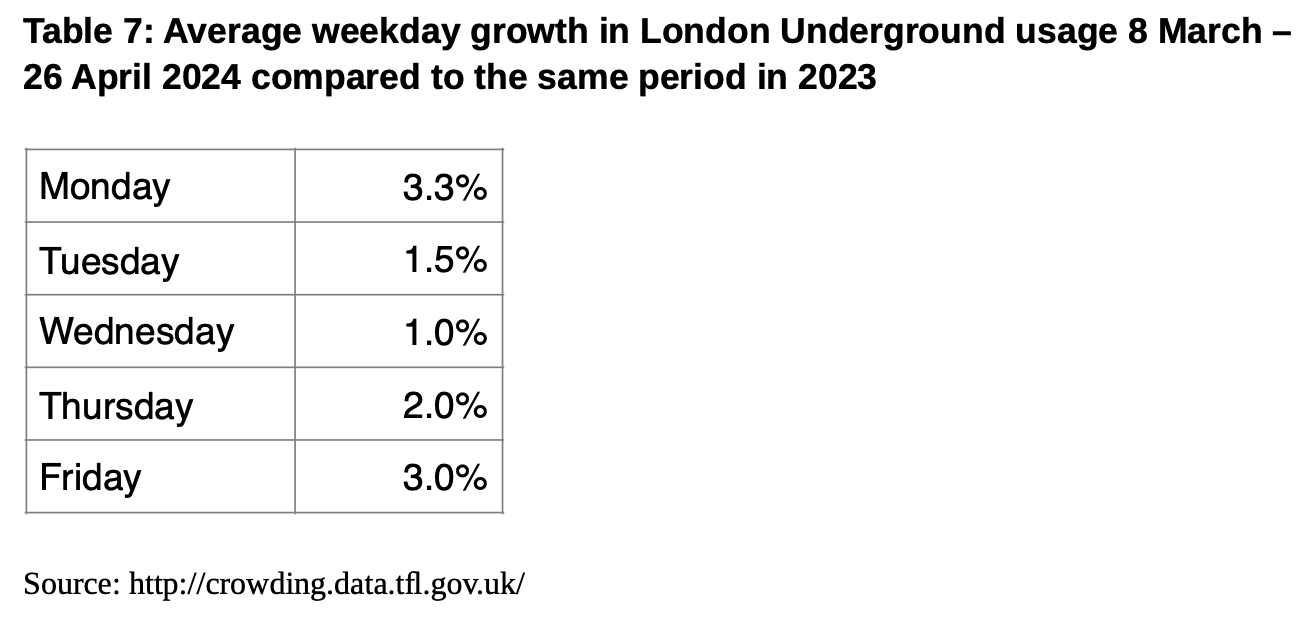
To try to spread out demand more on the rail network, TfL is presently experimenting with offering off-peak fares all day on Fridays for contactless and Oyster fares. Comparing the growth in London Underground use by day of the week for the first 8 weeks of this trial suggests it has had some impact. As can be seen in Table 7, demand on Fridays has grown by 3% compared to the same 8-week period last year, which is higher than that for Tuesdays to Thursdays, but is lower than for Mondays.
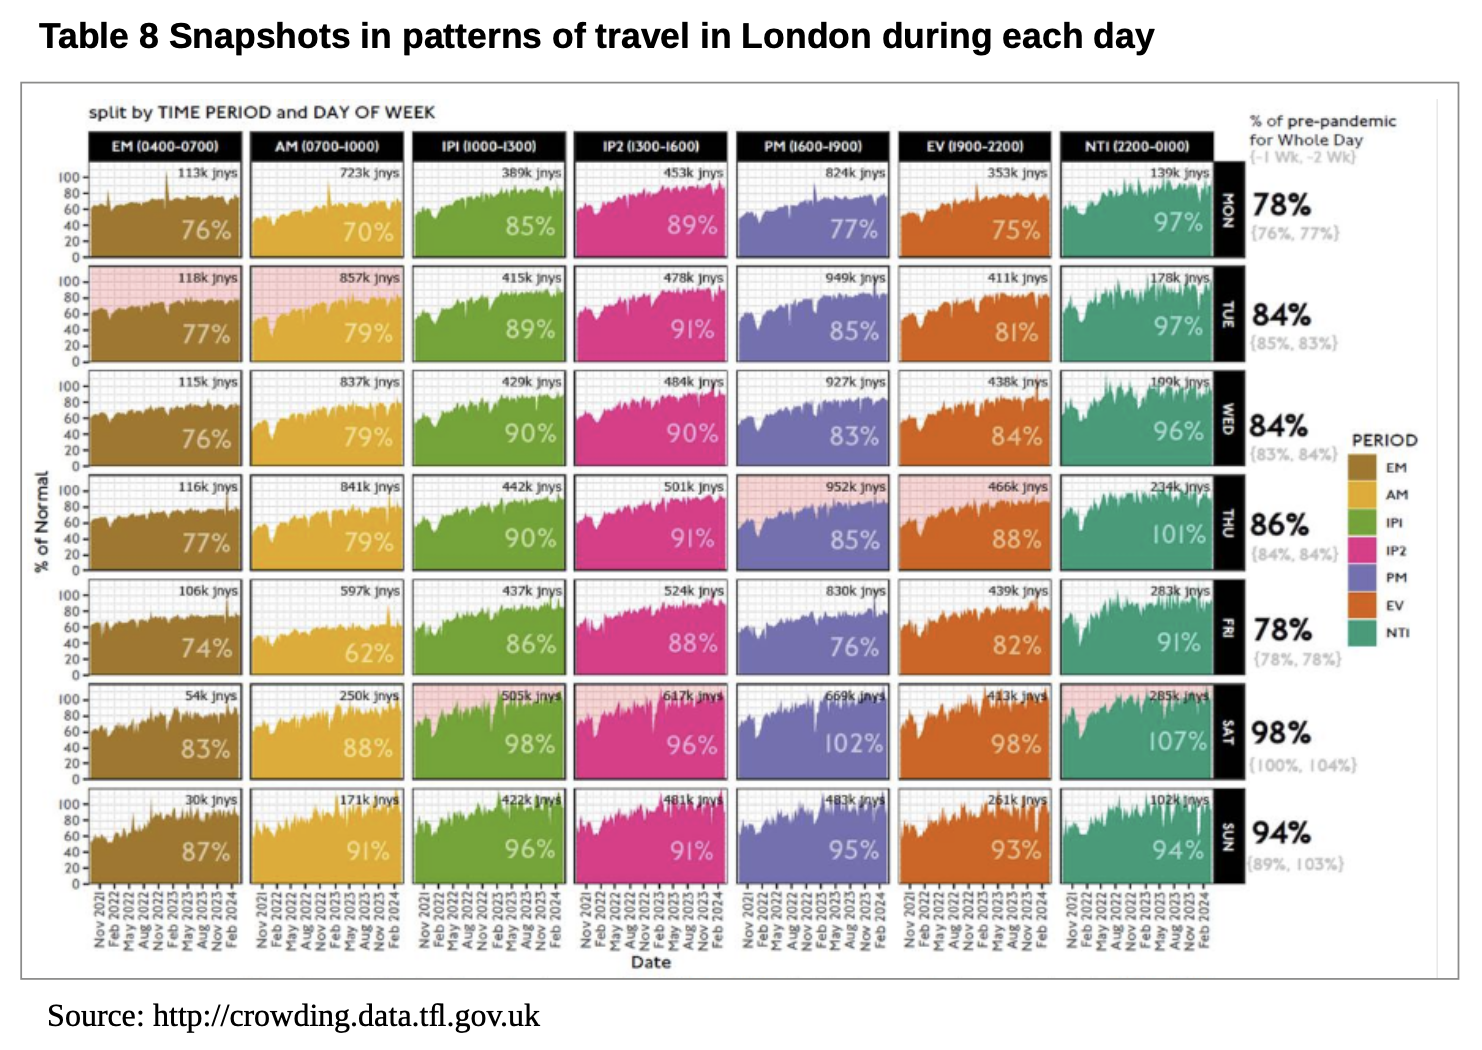
The chart below (Table 8) presents snapshots in patterns of travel during each day, particularly for London Underground. The post COVID recovery has been particularly poor in the Monday morning peak, and especially the Friday morning peak. On both days, however, travel has much more recovered by the evening peak. So the point about whether to meet the peak or not, is pertinent even within a single day.
As highlighted above public transport usage on Mondays and Fridays has lagged that on Tuesdays to Thursdays. That is reflected in the morning peak for these two days especially on Fridays where patronage on the Underground is 30% down on Tuesdays, as can be seen in the table.
Between 10am to 4pm, Saturday is not surprisingly the busiest day. However, while the busiest time on a Saturday is between 4-7pm passenger numbers are well below those on every weekday between the same times, which are around 40% higher. Hence the need to meet morning and evening weekday peaks still dominate rail planning with nearly 1m people travelling in a typical weekday three hour evening peak period. It used to be that the morning peak was busier than the evening peak but this now seems to have been reversed. Overall patronage at weekends is on a par with pre-pandemic but working from home has had a significant impact on weekday travel trends.
On the bus network TfL have provided data showing boarders by London Borough in November 2023 compared to the same period in 2019 ie. pre- and post- pandemic (see Table 9, next page). This shows outer London is more buoyant than inner and central, with patronage not far off the levels pre-pandemic, while in inner London demand is still around 20% down.
This reflects the different nature of both areas.
Inner London is heavily dependent on office employment where working from home has significantly reduced demand for travel. There may also be some mode shift, both to cycling which continues to grow and to rail as crowding reduces.
Outer London employment is less office based and working from home is less of an option. Bus use here is also used more for personal needs and shopping retaining higher levels of underlying demand. Hillingdon is an outlier in terms of substantial growth in bus use. This may be due to local bus enhancements and people feeding into the Elizabeth Line.
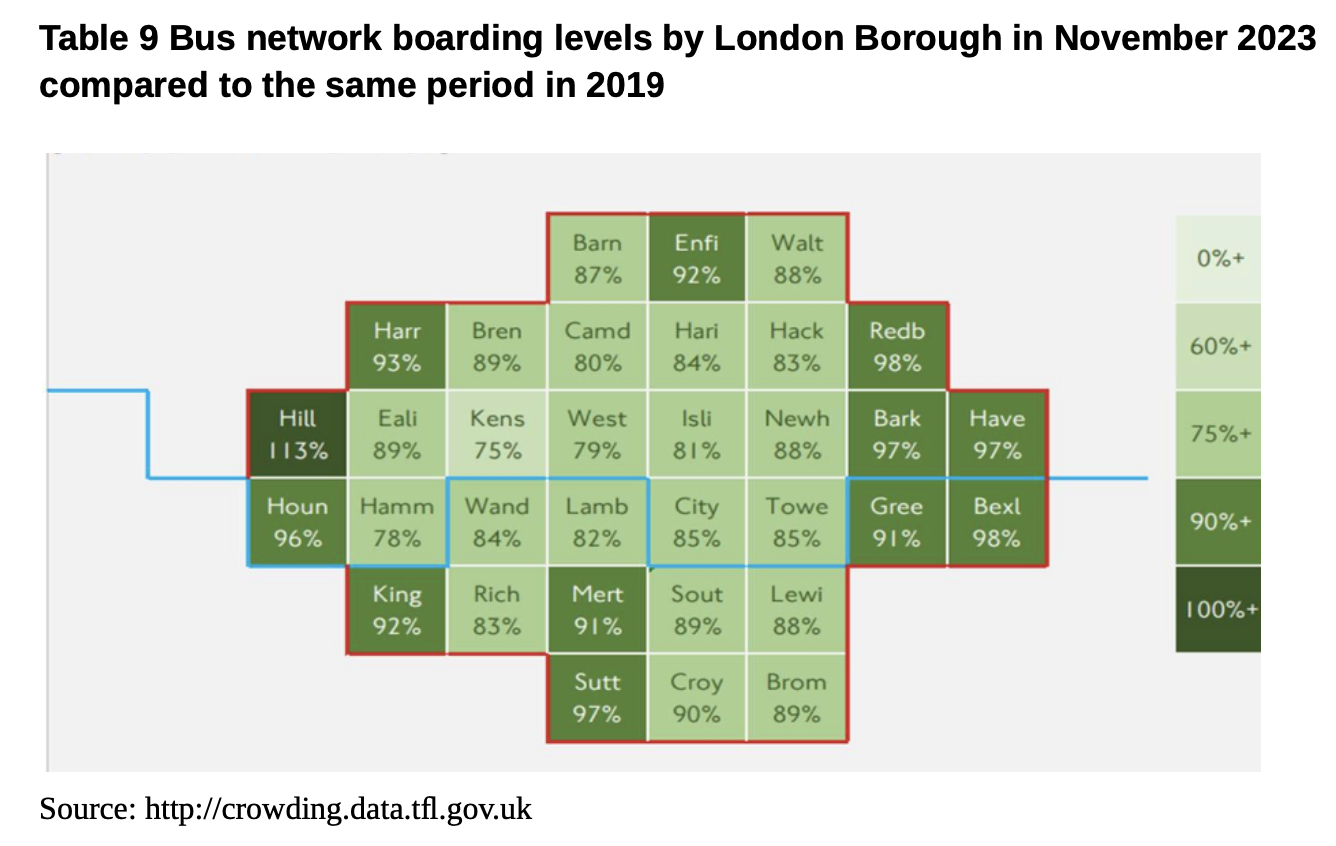
Note that the two graphics in Tables 8 and 9 are drawn with reference to just a week’s comparative data, not a whole year, so data won’t directly relate to the other tables, which measured over a longer period, will be more robust.
Speaking of the rich range of public TfL data, one reason for its release is for open data users to deploy in their own software and services. TfL admirably encourage software developers to use this data to present customer travel information in innovative ways - providing they adhere to the transport data terms and conditions. See, for example http://crowding.data.tfl.gov.uk/ where it is planning to put the bus O&D database up shortly to join the rail one that has been available for some time. Another valuable source is the Travel in London report issued annually that summarise trends in travel and transport in Greater London, also detailing progress towards implementing the transport and other related strategies of the Mayor. Topical reports are published through the year, with the Annual Overview published in December each year. https://tfl.gov.uk/corporate/publications-and-reports/travel-in-london-reports. I also understand there will also shortly be an annual paper to the TfL board that looks at progress in meeting the Mayor’s Transport Strategy (MTS) policies and targets. An important feature is that sustainable mode share (that is walking, cycling and public transport) has apparently lately returned in Greater London to 2019 levels, albeit at lower aggregate usage levels than for both private car and bus and rail.
All this invaluable data highlights the changed status quo on London’s public transport, just as in many other parts of the country facing greater variability in demand across the week. Balancing supply and demand will become an increasing challenge especially if the proportions of working from home and at workplaces continues to evolve and weekend demand continues to grow faster than on weekdays. While this article looks at the situation in London, with its wealth of data, many of the challenges outlined will also be engaging transport professionals elsewhere.
As always, I and LTT and TAPAS will be delighted to hear from anyone able to share their own data and wanting to discuss the message of it and the implications.
I would like to thank Geoff Hobbs of TfL for his helpful comment on the draft of this article and further input.
References
The data reviewed in this article and charts can be found at:
John Siraut is director of economics at Jacobs.
This article was first published in LTT magazine, LTT892, 21 May 2024.
You are currently viewing this page as TAPAS Taster user.
To read and make comments on this article you need to register for free as TAPAS Select user and log in.
Log in