TAPAS.network | 18 September 2024 | Commentary | John Siraut
Pandemic impacts fading into wider long-term trends, new NTS reveals

The newly published major tranche of data from the National Travel Survey 2023, is the first to be totally clear of direct effects of the Pandemic and the associated restrictions on activities and travel it brought. These clearly were a major interruption to normal behaviours, but believes the new figures suggest that established trends have not been much changed- and probably just accelerated
THE LATEST VERSION of the National Travel Survey, which only covers England, presents a wealth of information on the nation’s travel habits. It highlights that the COVID-19 pandemic, rather than fundamentally changing our travel habits, merely accelerated existing trends. This article delves into various aspects of these habits, with a particular focus on the longer-term behavioural trajectory- with some thoughts on what futures we should consequently now be planning for.
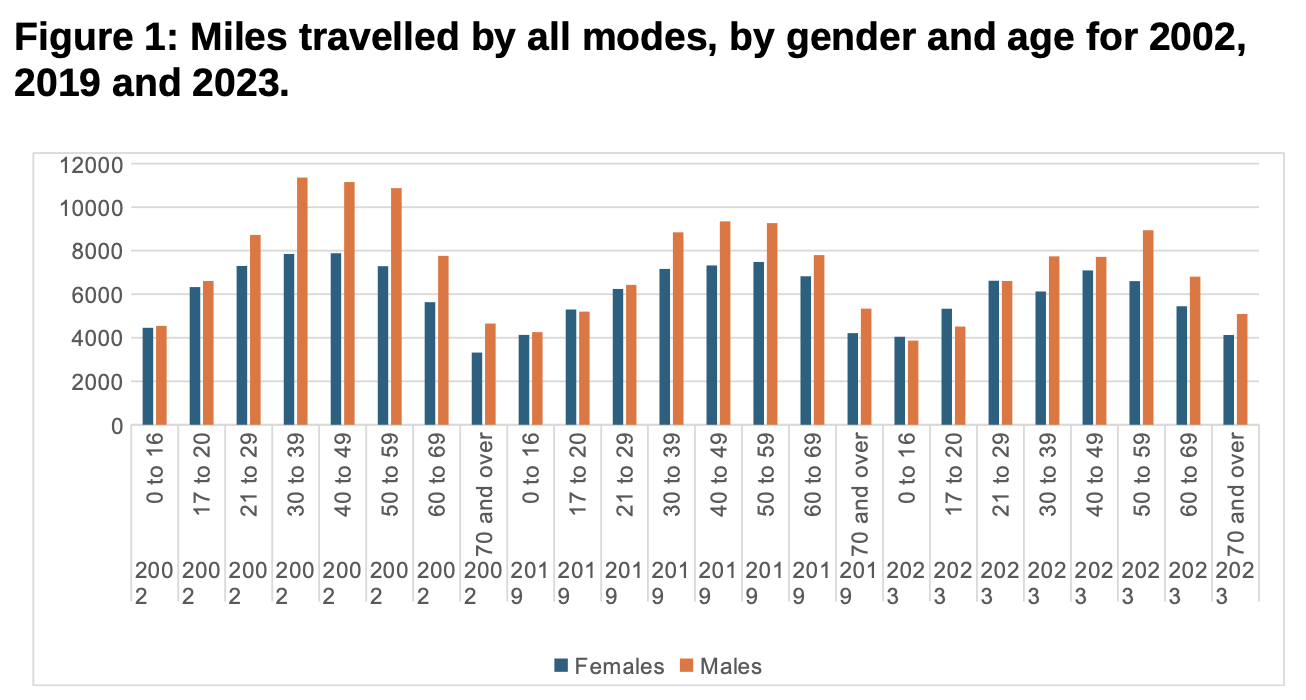
Figure 1 shows the number of miles travelled by all modes, by gender and age in 2002, 2019 and 2023. In 2002, men aged between 30-59 clocked up more than 10,000 miles on average, over 3,000 miles more than women in the same age groups. By 2019, pre-pandemic, miles travelled had fallen considerably for most age groups and both genders. The exceptions were for women over 50 and men over 60, reflecting the greater proportion of people in this age group that now had a driving licence, increasing the number of miles driven by them. The increase was particularly large for women aged between 60-69.
The gap between the number of miles travelled by men and women had also started to decline. By 2023, post-pandemic, virtually all age groups saw further falls in miles travelled. On average, men aged 30 to 40 are travelling a third fewer miles now than in 2002, while women over 70 are travelling a quarter more. In aggregate the number of miles travelled by men has fallen by 15% since 2002 and for women by 10%. This narrowed the gap, from men travelling on average 2,100 miles more than women, down to a difference of only 800 miles.
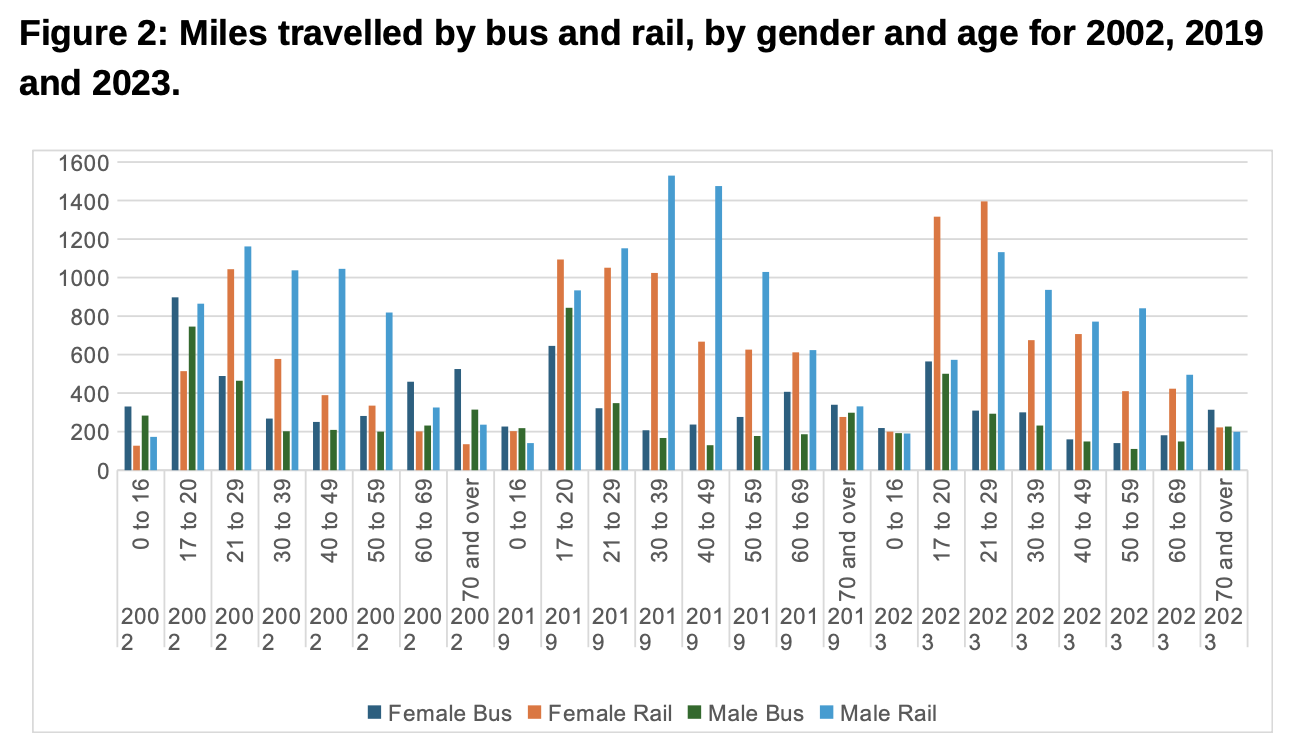
The changes in distance travelled is mainly due to reductions in the miles driven. Public transport use shows a different pattern as can be seen in figure 2. Women tend to use buses more than men, but their mileage travelled declined markedly between 2002 and 2019 and continued to decline up to last year 2023. The miles travelled by women aged 60-69, for example, has declined by 60% between 2002 and 2023, reflecting the switch to driving. Rail use on the other hand, where in 2002 men travelled almost twice as far as women, saw a very large increase in distance travelled between 2002 and 2019 for both men and women. By 2023 the gender difference in miles travelled has almost disappeared (although the data for women aged between 17-29 looks unusual). For males aged 30-49, who made up a key part of the rail market, the distance they travelled almost halved between 2019 and 2023. Over 60s on the other hand, both men and women, are travelling further by rail in 2023 than they were in 2002.
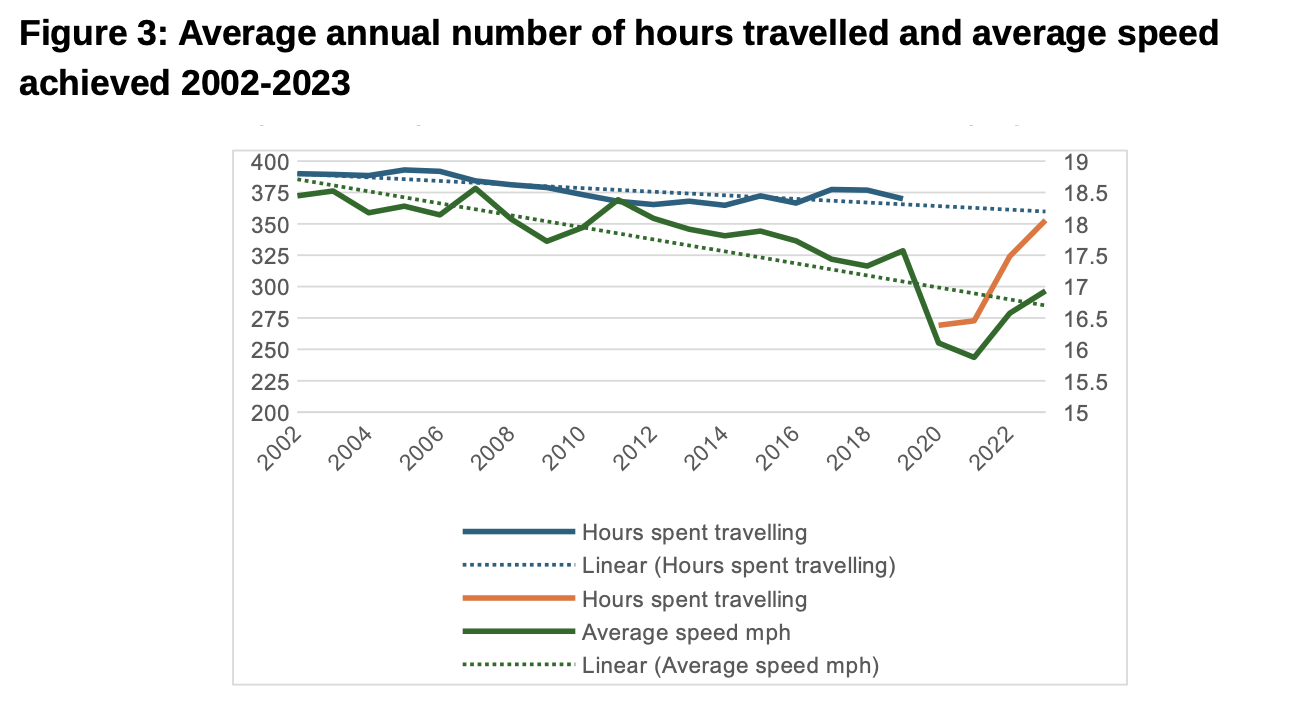
A common rule of thumb, known as Marchetti’s constant, is that we spend on average an hour a day travelling, whatever the distance. The first reference to a constant travel budget appears to be credited to Bertrand Russell back in the 1930s. Since 2002 the average number of hours travelled a year has followed a gradual downward trend, (figure 3). The pandemic led to a large fall in activity, as shown in orange, but the number of hours travelling in 2023 was virtually back on the long-term trend at just under that one hour average as shown by. Over the same time period (ie from 2002) the average speed that we are travelling has also been falling. Fewer hours travelling at lower average speeds means large falls in mileage, as already discussed.
Back in 2002 commuting generated a significant number of trips for those of working age. However, the number of commuting trips was falling steadily for a long time pre-COVID 19, for all categories of employment. Figure 4 shows that for those in full time employment the number of trips made by all modes per year fell from nearly 380 in 2002 to 320 by 2019 and further down to 250 in 2023. Part time employees are more likely to be working in sectors where their physical presence is required in the workplace, so the number of trips they make has only fallen slightly over time. By 2023 they made only 19% fewer trips than full time employees. The self-employed made the fewest commuting trips - presumably a higher proportion are based at home anyway, and for them there was no change in the number of commuting trips between 2019 and 2023.
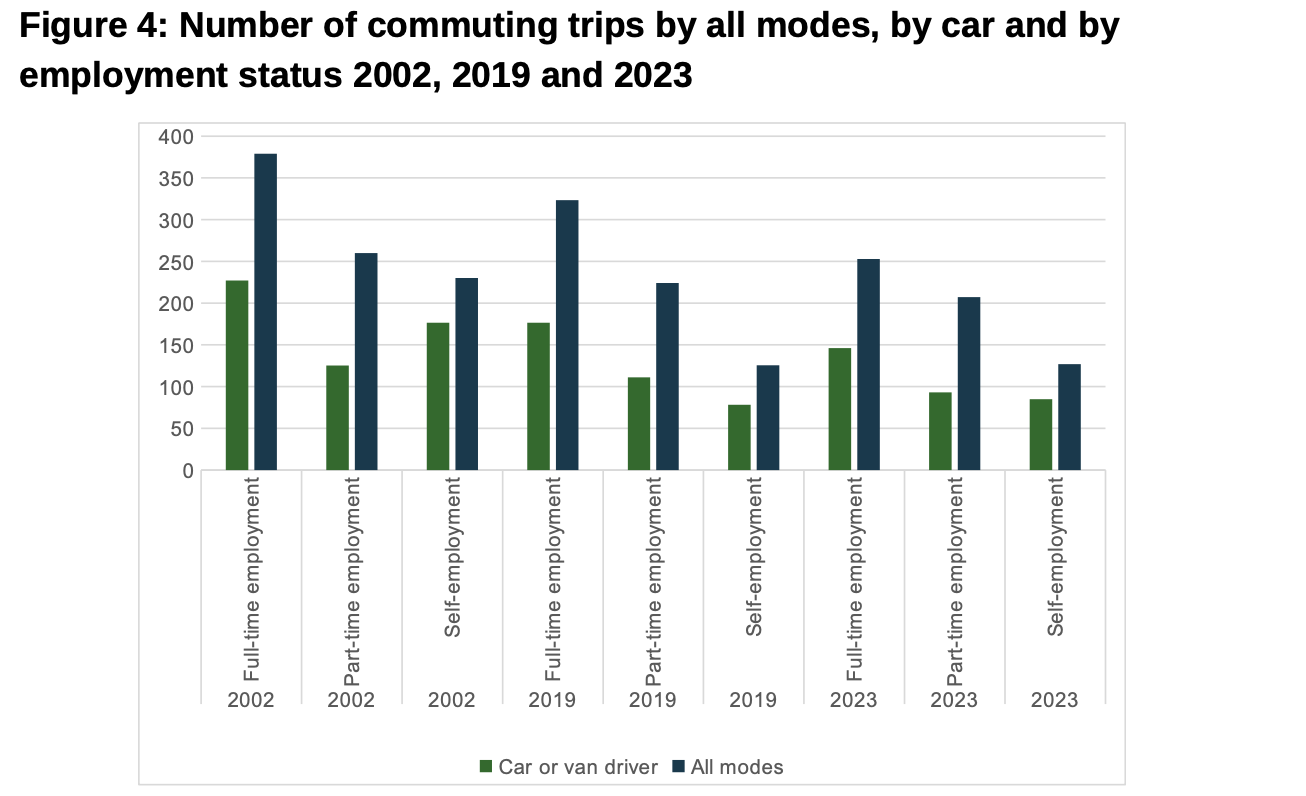
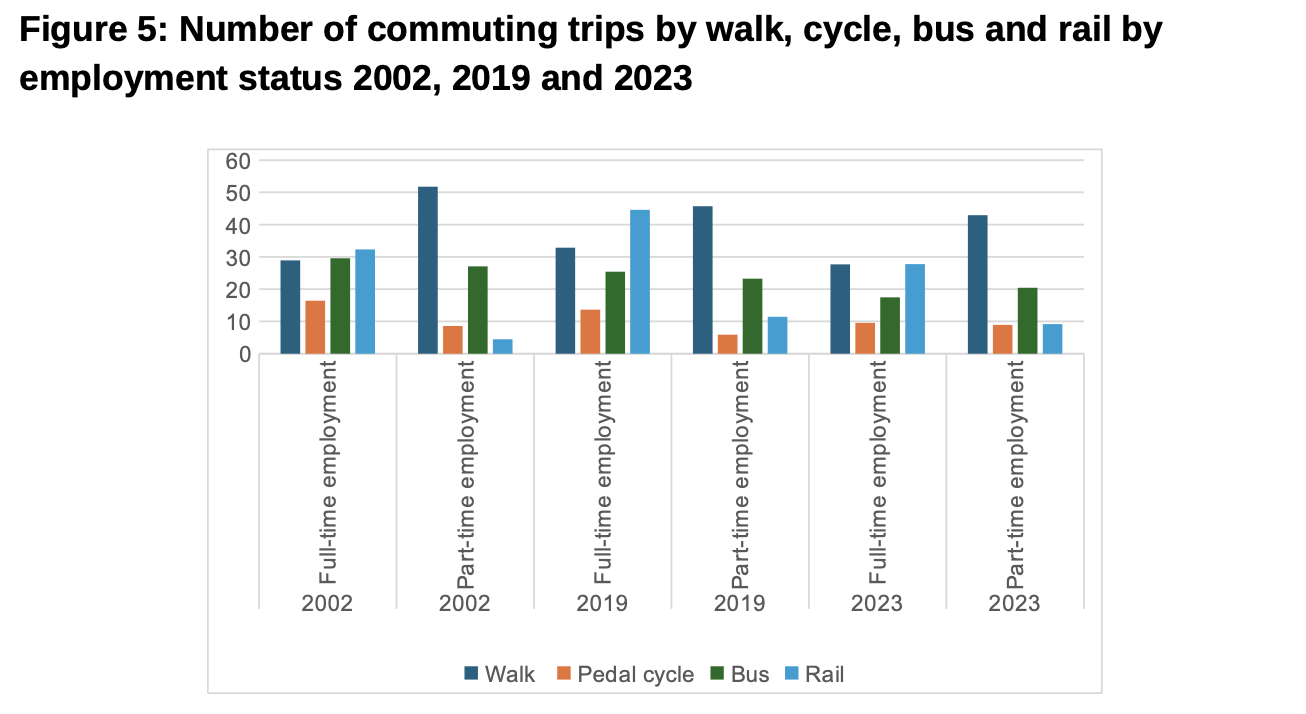
Figure 5 shows the number of trips made by the other main modes used for commuting. For those in full time employment, walking, bus and rail were equally commonly used in 2002. By 2019 pre- pandemic, rail use had increased markedly and there was a small increase in walking. However, by 2023 after the pandemic the number of rail and walking trips had fallen back to 2002 levels, with bus use and cycling also both reducing significantly. Walking and Cycling were both boosted during the pandemic, through substitution for other mechanised modes, but cycling has fallen back since in respect of leisure travel, but not seemingly for commuting.
Those in part time employment are much more likely to walk to work and use the bus. That pattern has remained over the period, although by 2023 the number of rail trips had increased over 2002 levels while the number of cycling trips remained broadly the same.
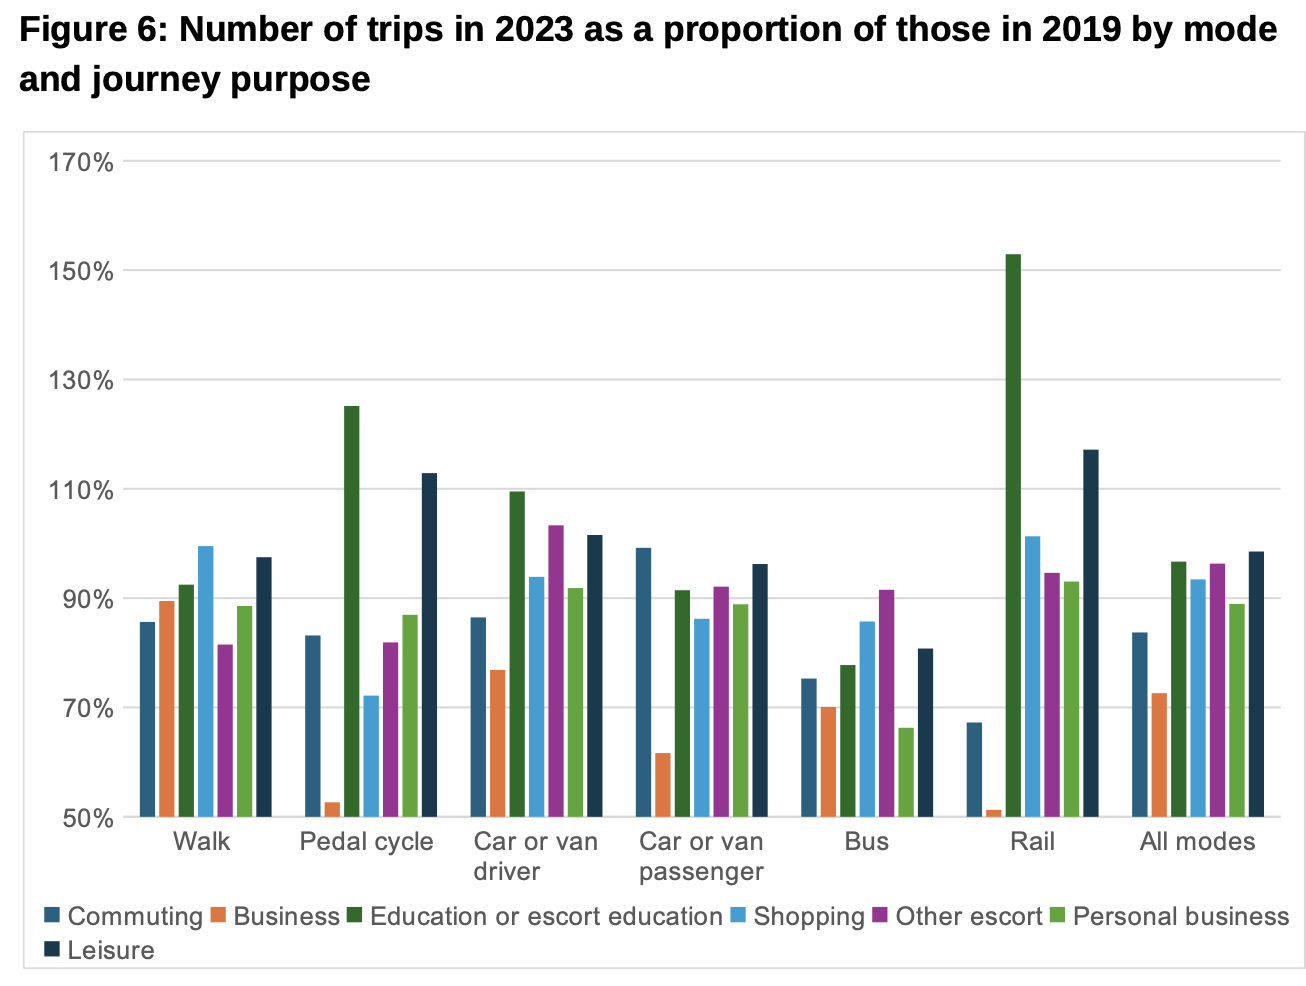
Between 2019 and 2023 there has been a small decline in the overall number of trips taken, just 4%, but this masks considerable variations by mode and journey purpose as shown in figure 6. Commuting trips are down by 16%, which has disproportionately impacted rail, where trips are down by a third, and bus, with trips down by quarter. Business trips are down even more, over a quarter on 2019 levels with rail business trips down by a half - a major factor in the sector’s present difficult financial situation.
As one would expect the number of education trips is virtually unchanged, but there has been a 20% reduction in bus use for these trips. Rail and cycle use have increased significantly for education trips,but the actual number remains very low. Leisure trips are also almost back to pre-pandemic levels with a large increase in rail trips and cycling. Overall across all journey purposes, walking is the only one to see an increase compared to 2019, up 5%, while the distance walked is up an impressive 16%. However cycling was 5% down in 2023 compared with 2019 and bus use by 22% over this period.
As stated above education trips have been unaffected by changing working practices, so the number of trips taken is related to the size of the school age population. However, how children travel to school has changed over time. This data set goes back to 1995 allowing a slightly longer overview of changes over time.
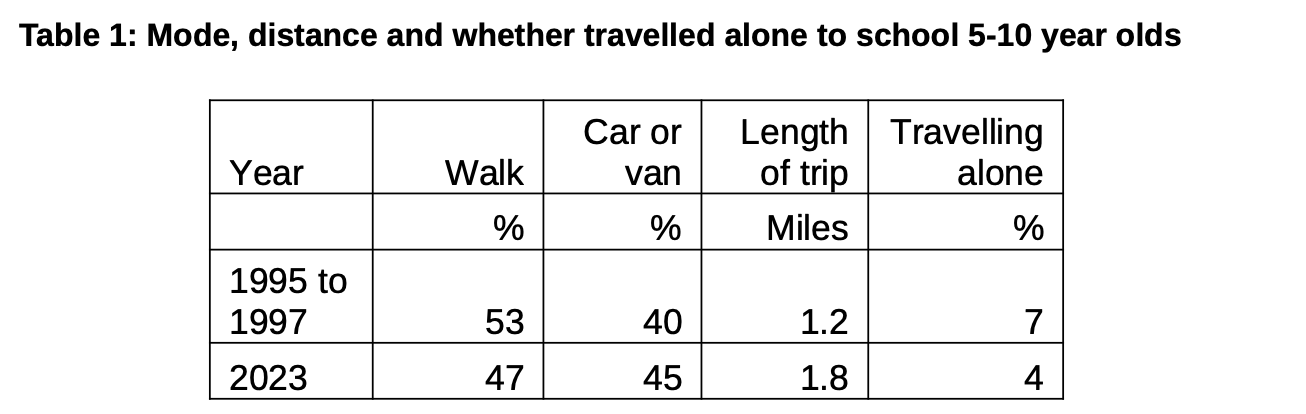
For primary school children there has been a slight reduction in the proportion walking and a subsequent increase in those being driven to school,( table 1). However, there has also been a 50% increase in the distance travelled to school which may be a factor in the reduction in walking. The number of children travelling to school alone has almost halved since 1995, although the numbers were very small to begin with. Other research reported in Baker’s book Children’s Independent Mobility in England 1971-2010 suggests that the proportion of primary school allowed to travel on their own to school fell from the 1970s onward as the number of parents permitting their children to cross major roads on their own fell significantly.
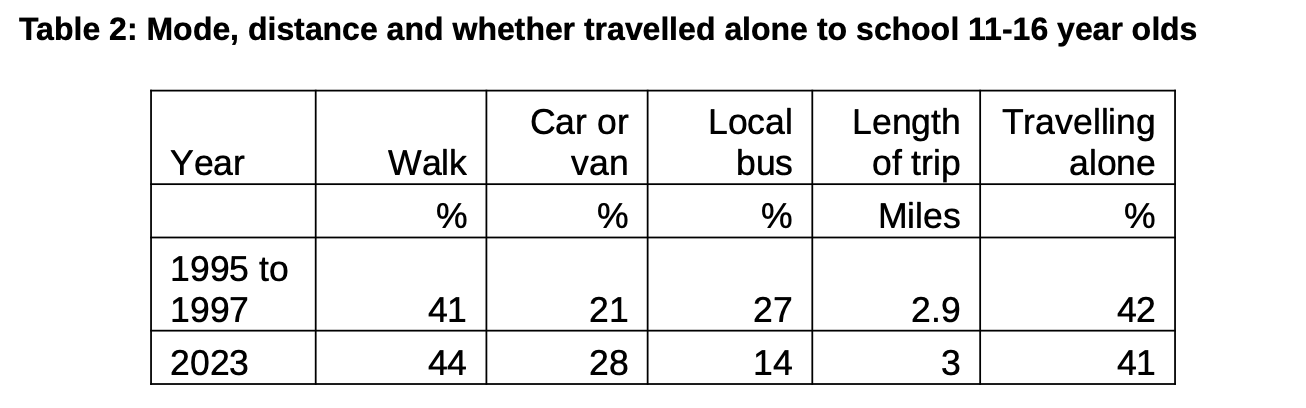
The picture for secondary school children is rather different. Despite virtually no change in trip length, there has been a marked switch from using local buses to travelling by car, with a small increase in the proportion walking, Table 2.
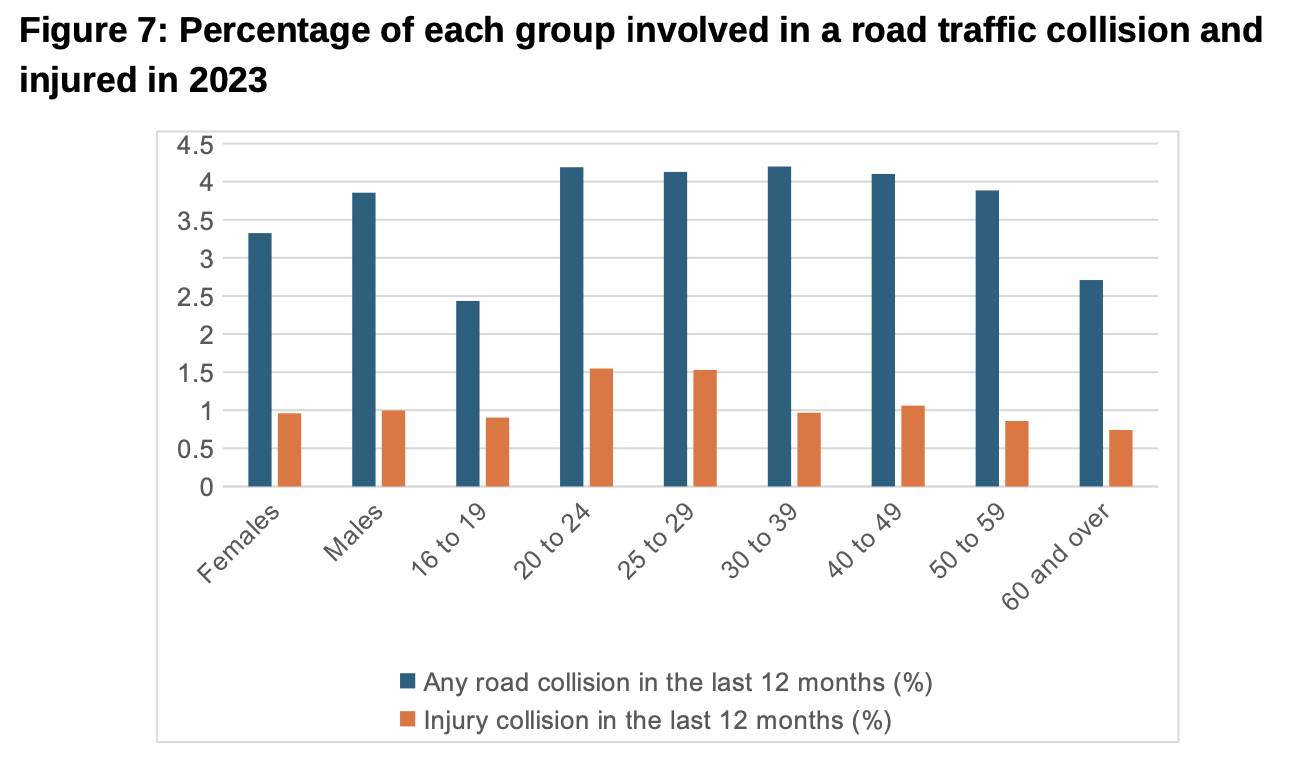
The NTS has data on road casualties too. In answer to the question :Have you been involved in a road traffic collision in the last 12 months? the answer for a surprisingly large number of us is ‘yes.’ I was myself taken out by an electric scooter a few months back, which is the reason why the question resonated with me.
From these answers an estimated 1.6m of over 16 year olds were involved in a road traffic collision in 2023, with nearly half a million sustaining an injury. As figure 7 shows, 20 to 49 year olds are most at risk while 16-19 year olds and the over 60s were less likely to be involved. Injury rates were highest for those aged 20-29. While women were less likely than men to be involved in a collision they were equally likely to be injured. Those aged 50-59 were most likely to sustain an injury if involved in a collision while 16-19 year olds were least likely.
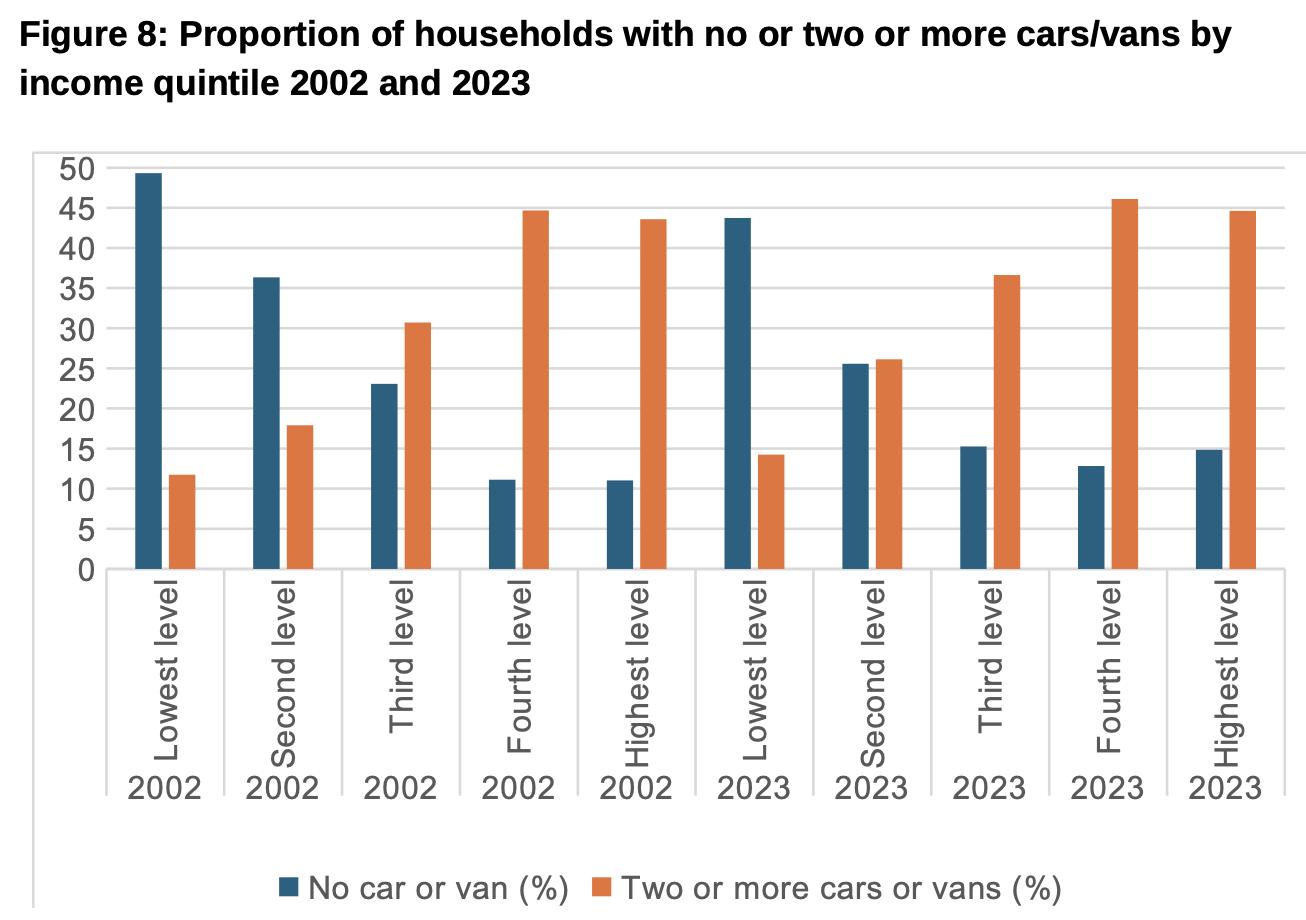
Car ownership is closely correlated to income, so the patterns showed by figure 8 come as no surprise. The proportion of households with no car declines from the lowest to the highest income quintiles, while the number of households with two cars increases. The slight exception is in the highest income quintile where the proportion with two cars is slightly lower than that for the fourth highest income quintile. Between 2002 and 2023 the proportion of households in the three lowest income quintiles without a car declined, but it has marginally increased in the top two quintiles. So while there was a 12 percentage point difference between the third and fourth highest quintiles in the number of households having no car in 2002, that has fallen to just two percentage points in 2023.
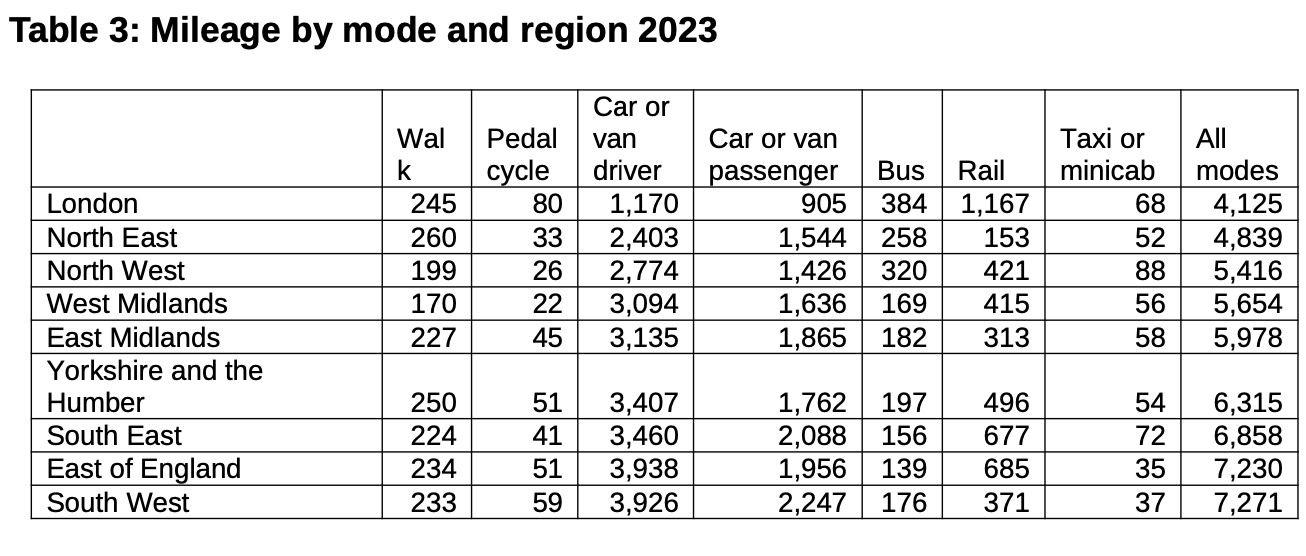
Looking at things geographically, our use of transport varies considerably across the country as can be seen in table 3. The average number of miles travelled per person in the South West and East of England is far higher than the far more urban North East, North West and West Midlands regions. Rather dramatically, those in the North East walk 50% more miles on average than those in West Midlands, while people in the West Midlands also cycle less than elsewhere. Average miles cycled per person in London has more than doubled in twenty years, suggesting that investment in enhanced cycling provision can make a big difference.
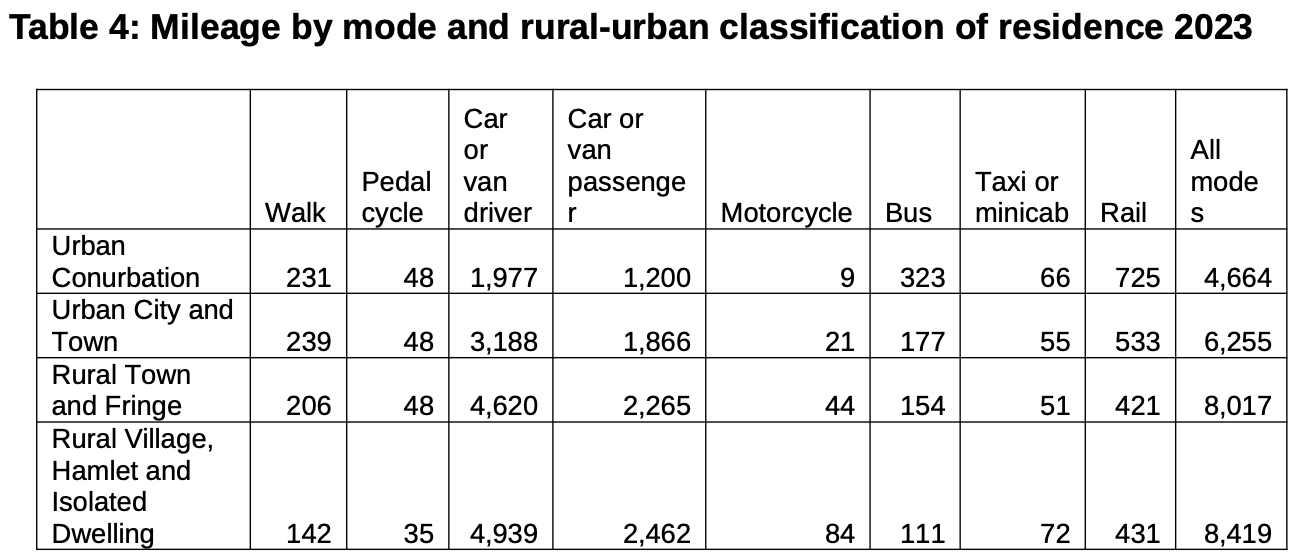
The reasons for many of the regional differences are apparent when the analysis is presented by rural-urban classification of residence as shown in table 4. Those in rural areas travel far greater distances than those in urban areas, and a far higher proportion of that mileage is by car. The lack of public transport is meanwhile clearly manifested in the higher motorcycle and taxi/minicab mileage compared to urban areas. From a transport perspective urban conurbations are far more sustainable - 28% of a much lower total mileage is by public transport, walking or cycling compared to 10% in rural areas. It is also of note that over 50% of car mileage is effectively single occupancy in rural areas compared to 40% in conurbations.
Looking to the future, it is surely of overall significance in many ways to the transport sector that we have steadily been travelling less for some time. The average number of miles we commute has fallen by a quarter since 2002, as more people work from home; business travel has almost halved due to the rise of video conferencing; shopping mileage has fallen by almost a third as we have taken up on-line purchasing and home delivery with alacrity, and that for personal business is down by 20% as more services are now delivered on-line. Only education and leisure trips now generate similar mileage to 20 years ago.
A key question is how much further will these trends of travel shrinkage take us in the future, or will the long awaited arrival of technological changes like autonomous vehicles, or other societal, cultural, economic or demographic changes reverse these downward trends? Or even maybe expedite them…. Either way, we should take some care on the patterns of travel we plan for.
All data is taken from the National Travel Survey 2023
https://www.gov.uk/government/statistics/national-travel-survey-2023
John Siraut is director of economics at Jacobs.
This article was first published in LTT magazine, LTT899, 18 September 2024.
You are currently viewing this page as TAPAS Taster user.
To read and make comments on this article you need to register for free as TAPAS Select user and log in.
Log in