TAPAS.network | 16 October 2024 | Commentary | John Siraut
34 million cars in the UK – but a changing mix of what they are, and who drives them

The number of cars in the UK has continued to grow, but also to change in both the types of vehicle – and who owns them. So has the cohort of licence holders. explores the characteristics of this huge fleet and their drivers, and what it means for transport policy.
THE LATEST Department for Transport vehicle licensing statistics show there were just under 34 million cars registered in the UK at the end of June 2024. That’s a very big number and if they were all parked up together would cover almost 80% of the Isle of Wight. But there are other equally interesting deductions to be made about the significance of this fleet – eg who owns and drives them, and how is the UK car parc changing as we move towards decarbonising our economy?
According to the 2021 Census, 77% of households in England and Wales have access to a car or van. In rural areas like Mid Suffolk this goes up to 90%. At the other end of the scale, in some London Boroughs, like Islington, only about a third of households have access to a car. Outside London, Liverpool and Manchester have the lowest car availability, but still, 60% of households have access to a car.
Car availability and ownership is closely linked to income and household composition. For example, table 1 shows household car availability by type of dwelling. For example, 92% of households in a detached home have access to a car or van. In contrast, only about 50% of those living in purpose-built flats or converted/shared housing have such vehicle access.
Table 1: Household car/van availability by type of household accommodation – England & Wales
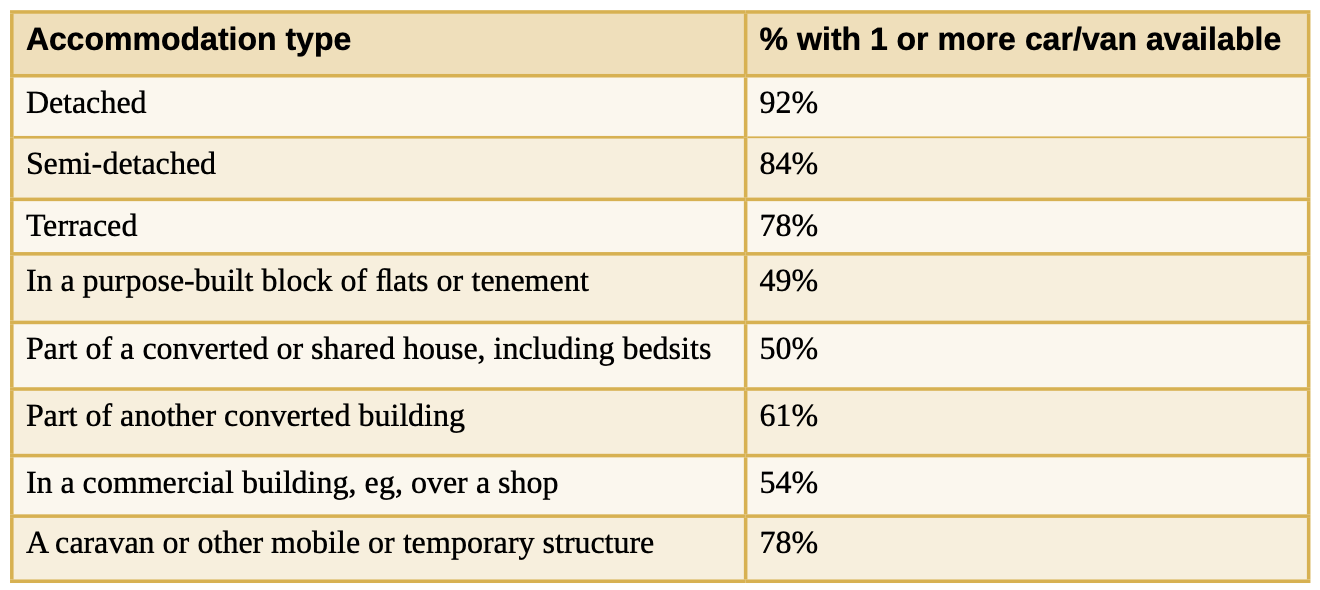
Source: England & Wales 2021 Census
The data for Northern Ireland shows a similar pattern, table 2. That for Scotland is not yet available in the same format.
Table 2: Household car/van availability by type of household accommodation – Northern Ireland
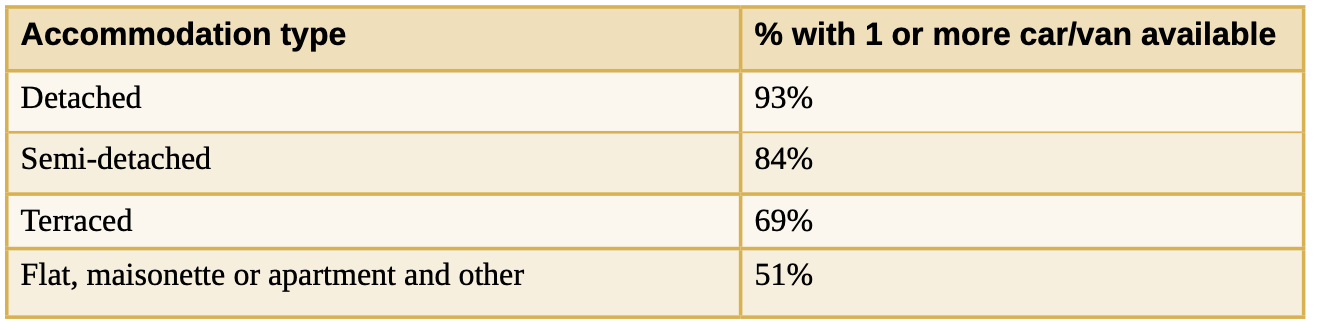
Source: Northern Ireland 2021 Census
Table 3 shows car availability by household composition. Most household types have a car available. Over 80% of two adult households have a car available. However, car availability drops by more than 20 percentage points in single-adult households, including those with children.
Table 3: Household car/van availability by household composition - England & Wales
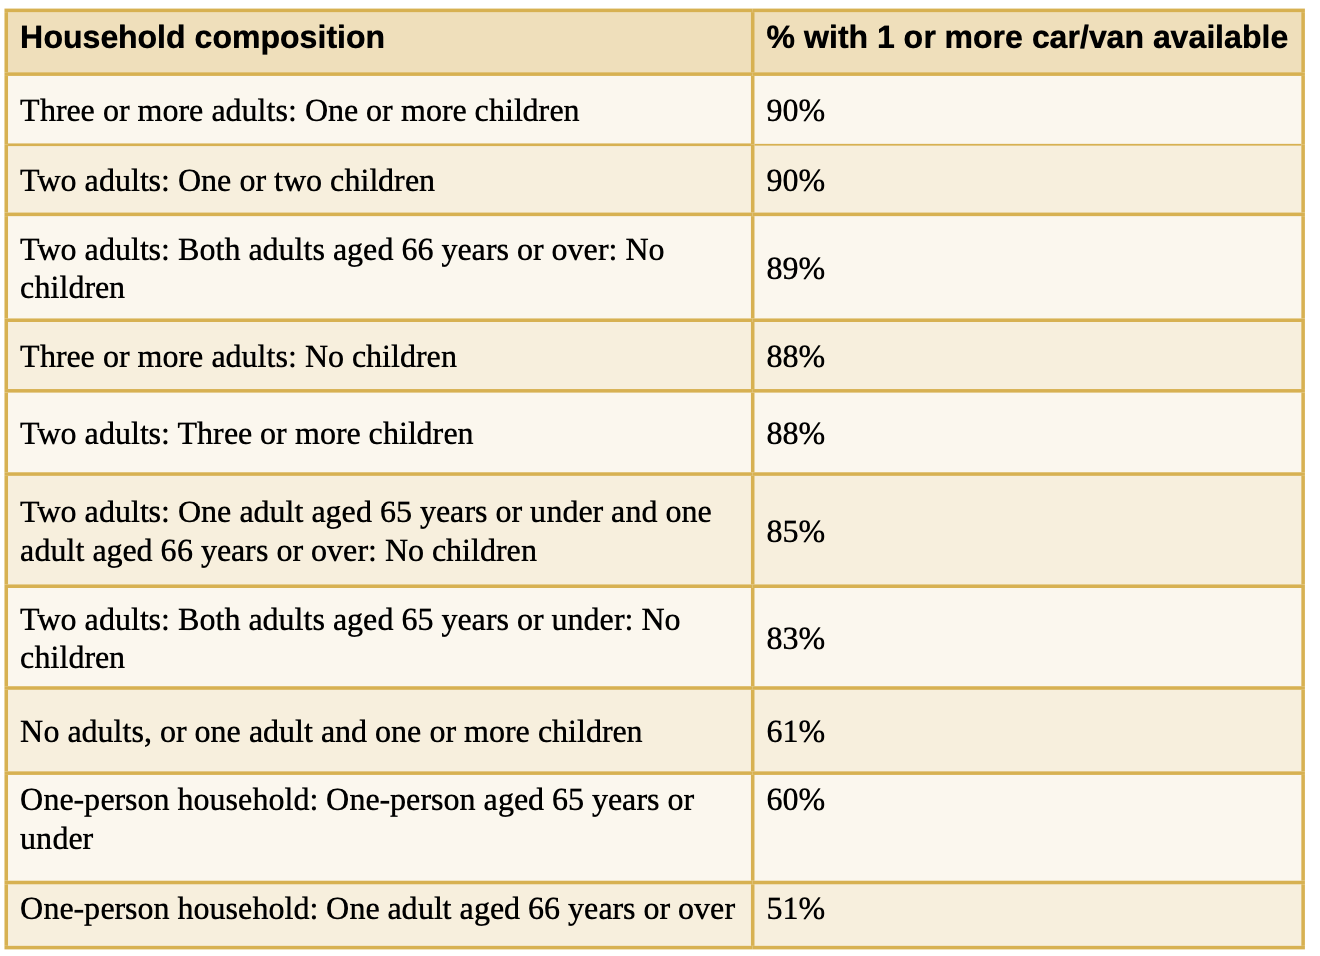
Source: England & Wales 2021 Census
Northern Ireland uses a different set of definitions for household composition, but the data shows a similar pattern to that for England and Wales as can be seen in table 4.
Table 4: Household car/van availability by household composition – Northern Ireland
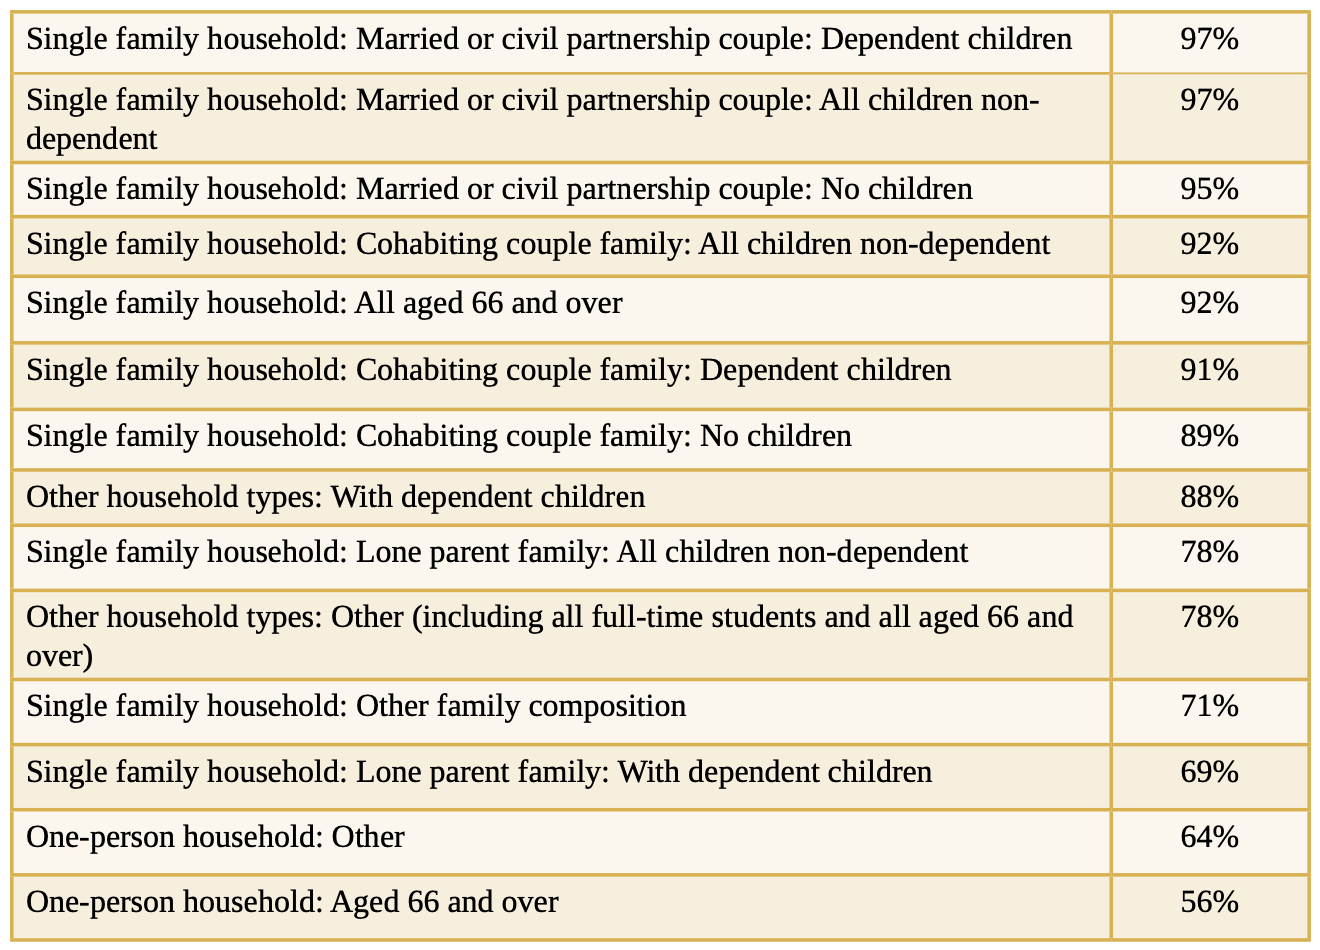
Source: Northern Ireland 2021 Census
It is no surprise, therefore, when combining both England and Wales datasets, the highest car availability (98%) is for households consisting of two adults and one or two children in a detached house. Most households with more than two adults have a car available, regardless of accommodation type. In this category, the lowest car availability is for two adults with one or two children in a purpose-built block of flats, where two-thirds have a car available. The picture is different for single-adult households – accommodation type is a key differentiator. For example, 70% of one-person households aged 66+ years in detached houses have a car available, but this drops to 32% in purpose-built flats. For single-parent households, 77% in a detached house have a car available, compared to 43% in purpose-built flats.
The England National Travel Survey provides data on the proportion of people by gender and age band who hold a full car driving license. In 1975, only a quarter of women held a full driving license. This figure rose to 60% by 2000 and stands at 70% today. The most significant increases have been among older women as shown in figure 1. In the late 1990s, 50% of women aged 60-69 held a full license, which has now increased to around 80%. For women over 70, the proportion has risen from virtually zero in the early 1970s to two-thirds today. However, there has been little change over the last 50 years for younger women. About 30% of women aged 17-20 and 60% of women aged 21-29 hold a full license, similar to the figures from 40 years ago.
Figure 1: Percentage of women holding a full driving license by age band
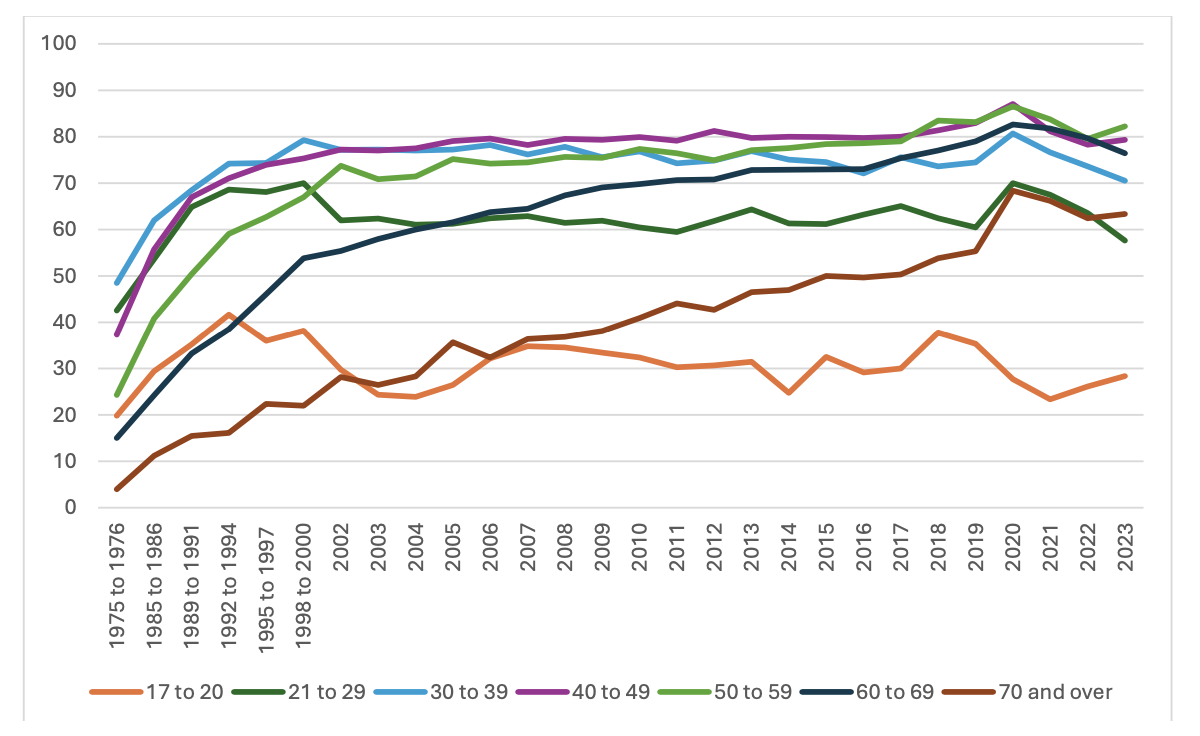
Source: National Travel Survey - https://www.gov.uk/government/statistics/national-travel-survey-2023
The situation for men is quite different as can be seen in figure 2. In the 1970s, 70% of men held a driving license, with this figure rising to over 80% for those aged 30 to 49. Therefore, the increase in the proportion of men holding a license has been less pronounced than for women. The most significant change has been among men aged 70 and over, where the percentage has increased from 30% in the 1970s to 85% today. Similar to women, there has been little change in the proportion of men aged 17 to 20 and 21 to 29 holding a license over the last 50 years, in fact there has been a slight downward trend.
The fall in younger people holding a driving license is generally put down to the tightening up of the driving test, especially the introduction of the written element, and the high cost of motor insurance for younger drivers.
For most age groups, men are more likely to hold a driving license than women. The exception is the 17 to 29 age group, where roughly the same proportion of men and women hold a license. The gap generally widens with age, resulting in a 20 percentage point difference among those over 70 and a 10 percentage point difference overall.
Figure 2. Percentage of men holding a full driving license by age band
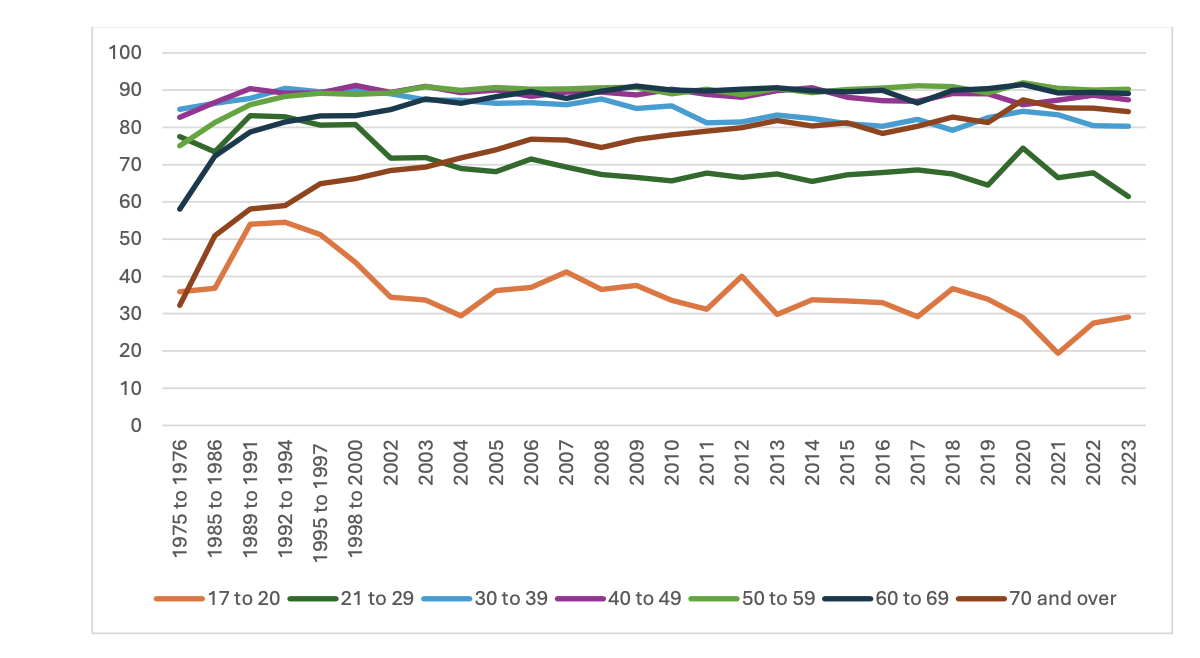
Source: National Travel Survey - https://www.gov.uk/government/statistics/national-travel-survey-2023
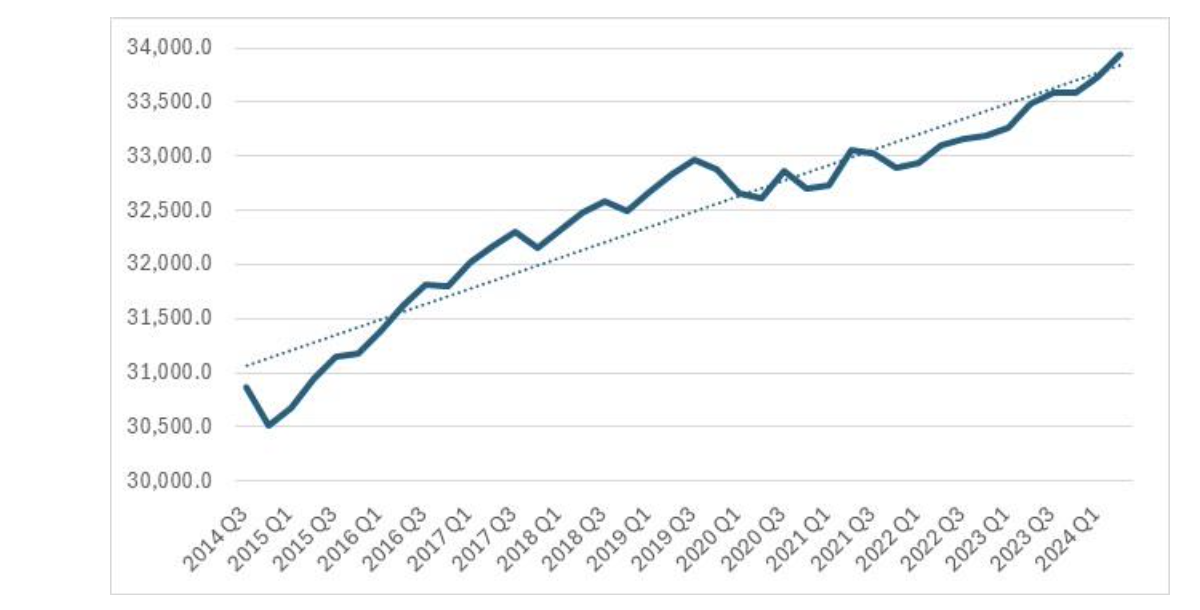
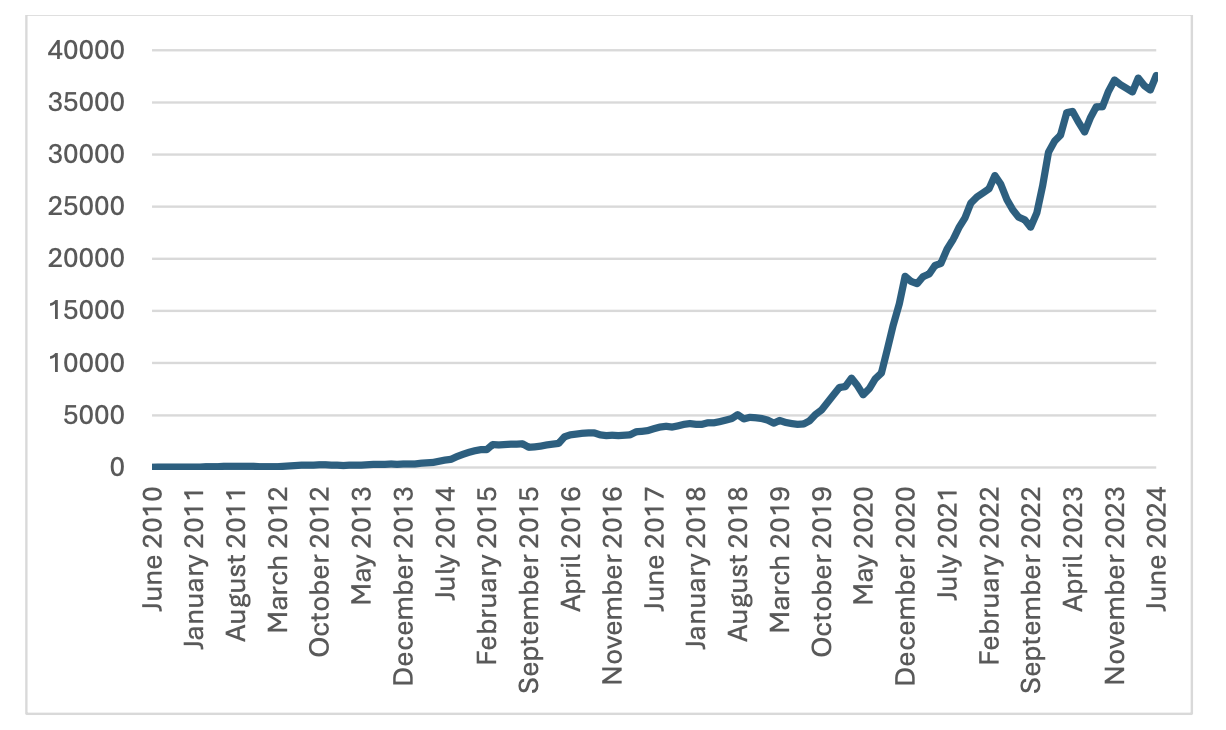
How are these numbers changing ? The number of registered cars in the UK has increased by around 10% over the last decade, reaching nearly 34 million (as shown in figure 3). The trend line shows that this growth slowed during and after the pandemic. This is likely in part due to a shortage of new vehicles and large increases in the price of used vehicles caused by supply chain problems, as much as any change in people’s behaviour.
Figure 3. Number of cars licensed in the UK
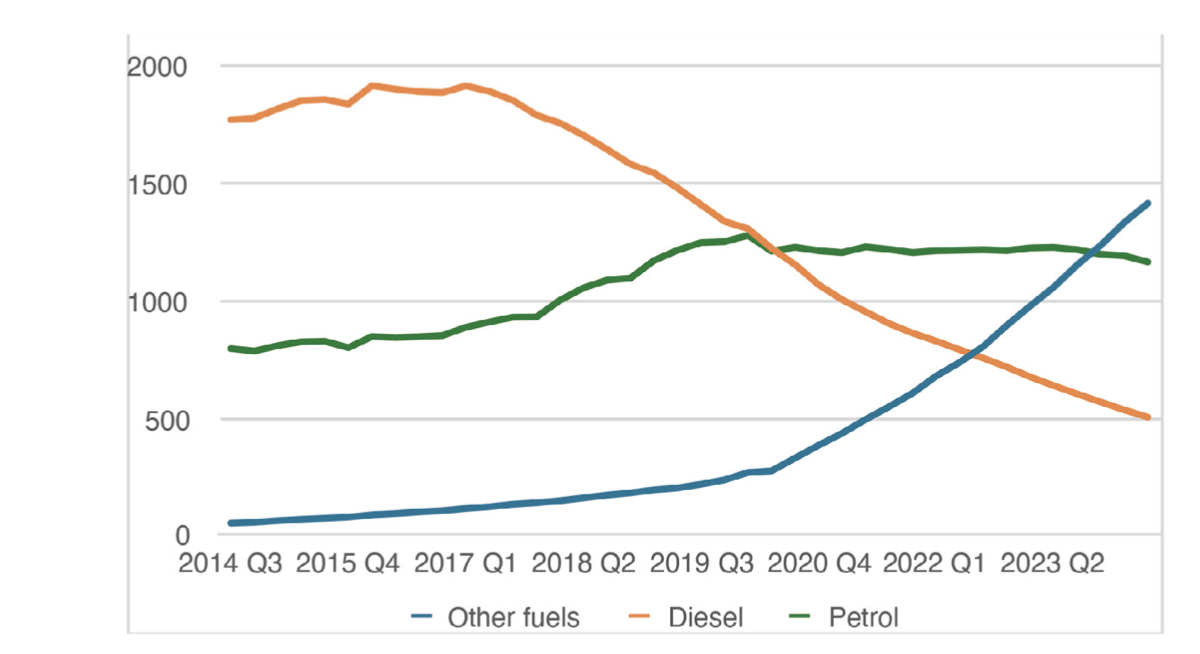
The composition of that car parc is meanwhile changing too- rapidly, in the case of company cars and more slowly with privately owned cars. Figure 4 shows the composition of the company car fleet. Diesel vehicles used to dominate company car fleets, making up two-thirds until 2016, but now they account for just 16%. Since 2020, the number of petrol company cars has flat lined, as alternatively fuelled cars, mainly battery and electric hybrids, have taken off, and are now the largest proportion of the fleet, at 46%.
Figure 4: Number of company cars by fuel type ‘000s - UK
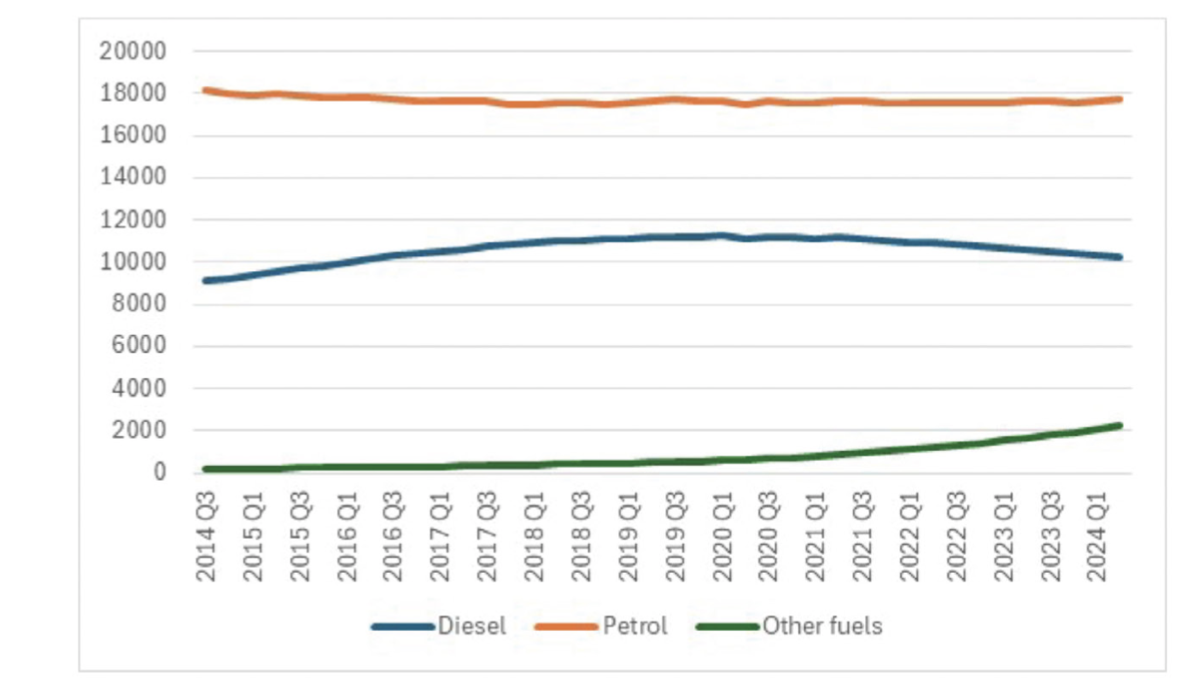
It’s a very different picture for privately owned cars. Here, petrol still dominates, making up about 60% of the total (figure 5), a proportion that has remained stable over the last decade. Diesel cars peaked in 2019 and have since fallen by just over 1 million, but there are still more of them in 2024 than there were in 2016. The number of alternatively fuelled vehicles such as electrics , continues to grow but so far they make up only 7% of the market, unlike the company car fleet.
Figure 5: Number of private cars by fuel time ‘000s - UK
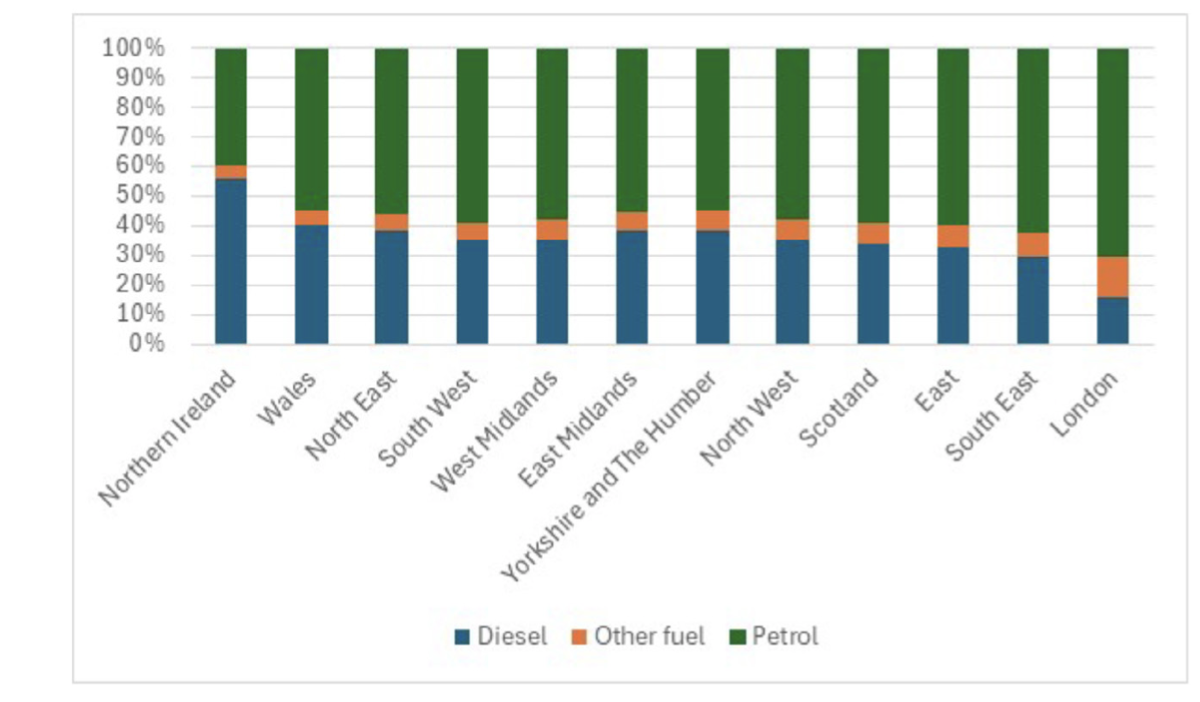
There are significant spatial differences in the make up of the private car market as shown in figure 6. London has around half the proportion of diesel cars compared to the South East and almost double the number of alternatively fuelled cars. Northern Ireland is another outlier with a considerably higher proportion of diesel cars than other UK regions.
Figure 6: Composition of regional private car parc by fuel type – June 2024
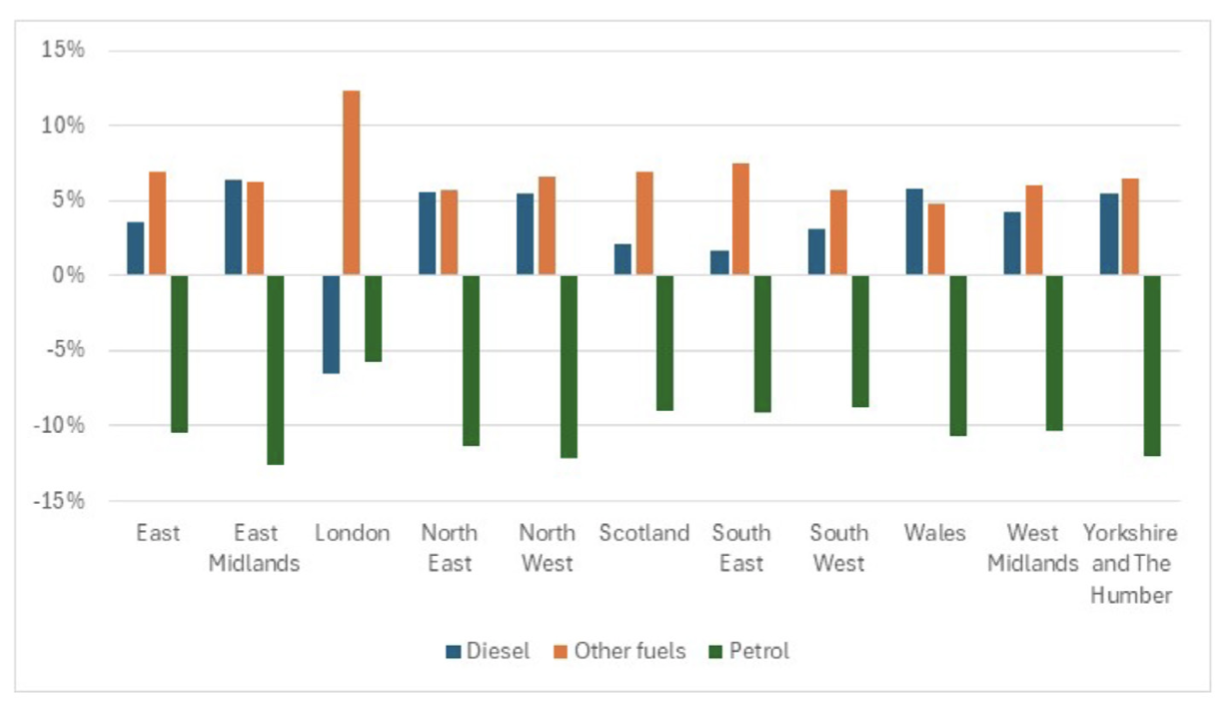
It’s a pertinent question to ask to what extent London’s Ultra Low Emission Zone has had in changing the composition of London’s car parc? Figure 7 shows the change in composition between Q1 2013 and Q2 2024 across the regions. (Comparable data for Northern Ireland is not available for 2013, the date being selected as it predates the then Mayor’s announcement on proposals for an ULEZ.) As can be seen London is a clear outlier. Every region bar London saw an increase in the proportion of diesel cars , while London saw a fall. And it also saw a much bigger increase in the proportion of alternatively fuelled cars.
Figure 7: Percentage point change in composition of regional private car parc by fuel type Q1 2013 to Q2 2024
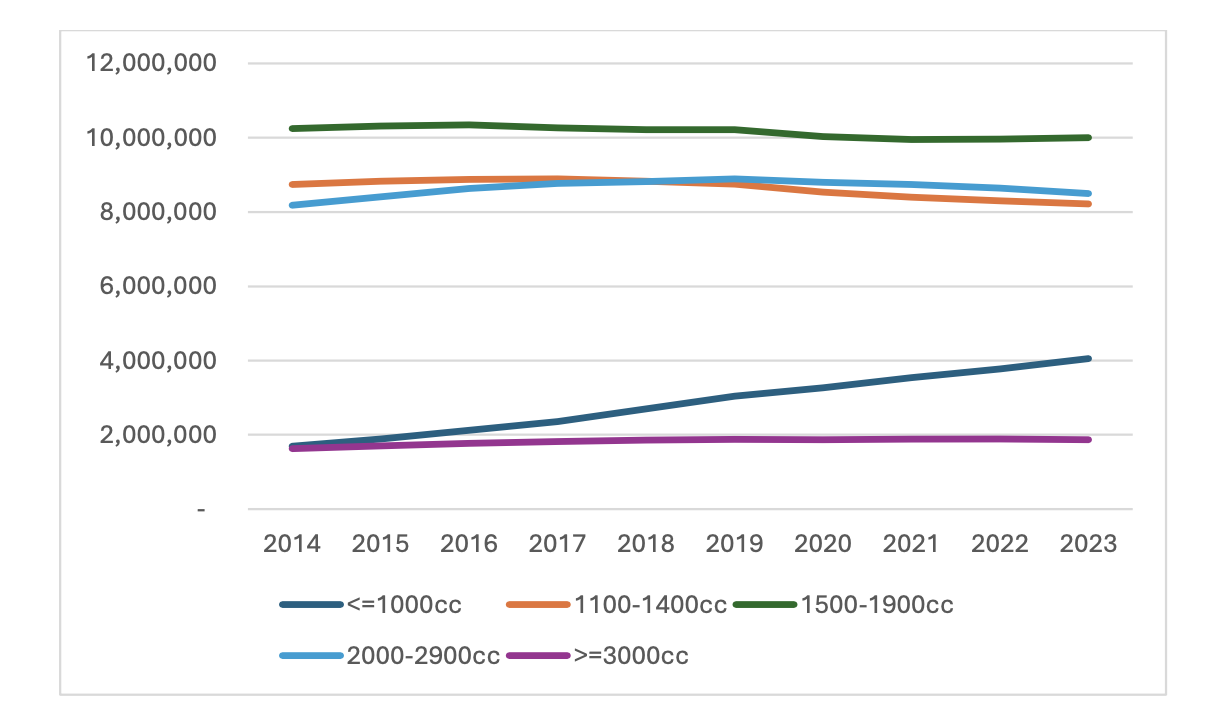
While there is growing concern about the increasing size of cars on our roads, engine sizes have actually been gradually falling as can be seen in figure 8. The number of cars with engine sizes of 1000cc or less as more than doubled in the last decade rising from 6% to 12% of the petrol/diesel parc, while the increase in the number of cars 3000cc or over has been marginal, rising from 5 to 6%. Over the period 2014 to 2023 average engine size has fallen each year from 1747cc to 1682cc.
Figure 8: Number of cars by engine band
Engine size data is only relevant to internal combustion engine cars. The purchase of electric vehicles really accelerated during the pandemic, and has continued to grow rapidly since then, albeit with a few glitches along the way. Figure 9 shows a six-month moving average of new registrations (to remove the impact of the twice-yearly surge in sales when new registration plates are issued) . Over 400,000 electric vehicles of all types i.e. including both hybrid and battery, were newly registered in the 12 months July 2023-June 2024. Despite this large rise ,sales will have to accelerate considerably to reach the present 2035 target of stopping the sale of all non-electric cars, and even more so if that target reverts back to the originally set deadline of 2030, eased by the last Government a year ago.
Figure 9: New registration of all electric cars (including hybrid) – six-month moving average
The growth and scale of the car population suggests that having a car is widely seen as an essential by those who can afford one.
If policy makers want us to move to a less car-dependent society it is clear that we need to move away from building so many low density detached housing developments in which the occupants having a car is seen as unavoidable, and instead make sustainable travel easier for households, especially those with children. Between 2011-2021 we added 700,000 detached, 750,000 semi-detached and 300,000 terraced houses to our housing stock in England & Wales, most of them designed around their occupants having a car .
And in respect of steering the car population away from fossil-fuel and carbon generating models, whilst the decisions of companies and London drivers show that it is possible to significantly change the composition of the car parc, it seems a more proactive approach will be needed to achieve a sustained large-scale shift across the country.
Reference
-
Vehicle registration data comes from https://www.gov.uk/government/statistics/vehicle-licensing-statistics-april-to-june-2024
-
Other references include the England & Wales 2021 Census and the National Travel Survey - https://www.gov.uk/government/statistics/national-travel-survey-2023
John Siraut is director of economics at Jacobs.
This article was first published in LTTmagazine, LTT901, 16 October 2024.
You are currently viewing this page as TAPAS Taster user.
To read and make comments on this article you need to register for free as TAPAS Select user and log in.
Log in