TAPAS.network | 31 October 2023 | Commentary | John Siraut
What is the impact of the £2 fare cap - and could it change the trajectory of bus use?

The introduction earlier this year of a £2 maximum bus fare in England, and its subsequent extension, has the potential to alter the appeal of bus travel to a small but significant audience, believes . He examines who stands to benefit most, what the initial indications of the user response are.
IN HIS SPEECH to the recent Conservative party conference the Prime Minister announced the extension of the £2 cap on English bus fares until December 2024. The fare cap was launched on 1 January 2023 and was originally due to run until 31 March 2023, then extended until 31 October 2023, after which the cap on eligible single tickets was to originally increase to £2.50 until 30 November 2024. It was promoted by the Government as both a help in addressing the so called “Cost of Living Crisis”, and encouraging more people to use buses.
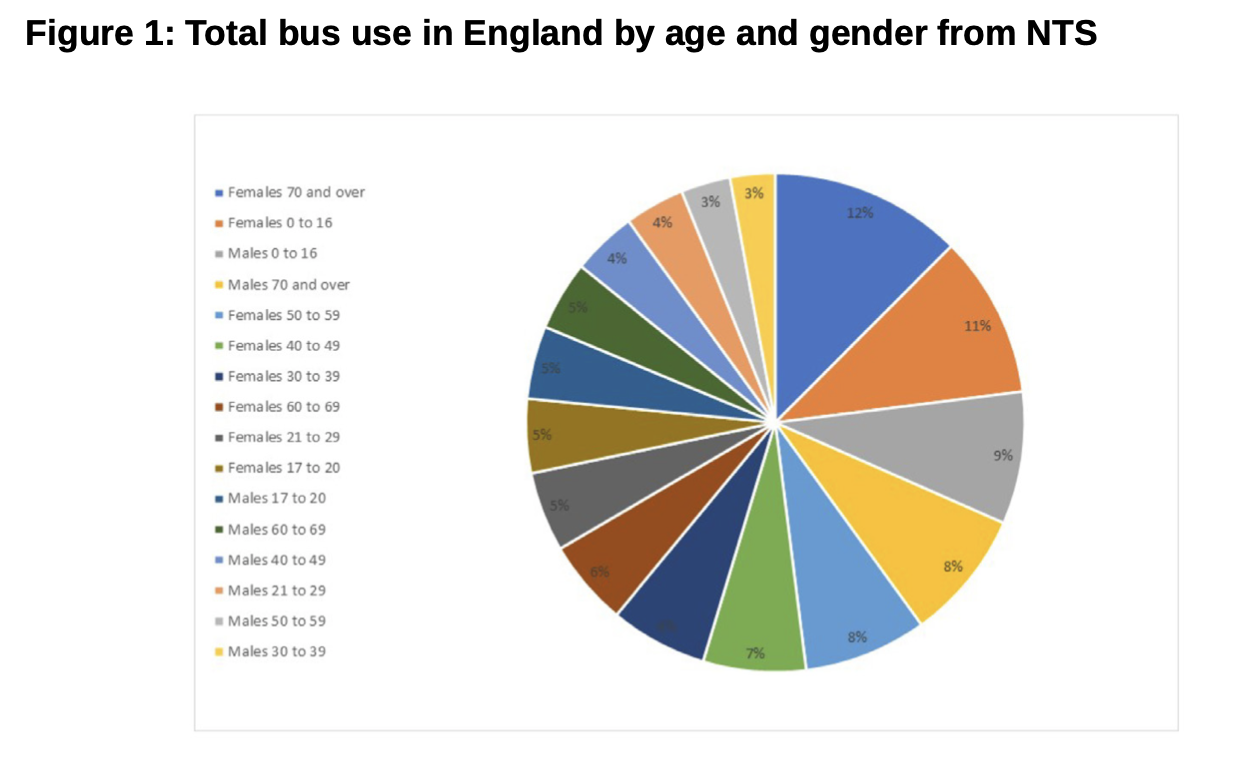
The scheme is not universally available as it voluntary for bus operators, but over 140 have joined representing around 90% of the total English market by patronage. It should be noted that in England’s largest bus market, i.e. London which accounts for just over half of all English bus patronage, single bus fares are already less than the £2 cap level. While in Greater Manchester, Liverpool and West Yorkshire fares had already been capped at £2 under schemes introduced by metro mayors in those areas. In addition many passengers are also entitled to free travel, for example, the nearly 9m holders of older and disabled concessionary travel passes in England. For those making more than two bus journeys a day, or who are daily commuters, a daily or period bus pass may still be cheaper. The 2022 English National Travel Survey provides a rough indication of who travels by bus outside London. As can be seen from Figure 11, just over 40% of bus trips are made by the under 16s and over 70s. Taking all these factors together the proportion of bus users who may benefit from the £2 bus cap is far smaller than the total number of bus users.
The impact of both the fare cap and recent high inflation has reversed the previous recent steady increase in the real cost of bus fares. Figure 22 shows the local bus fares index in constant prices (that is stripping out the impact of inflation) for five areas: Scotland, Wales, London, English metropolitan areas and English non-metropolitan areas. It shows that in all areas, fares increased in real terms by around 10% between 2010 and 2015. Then the impact of London’s fare freeze becomes clear and by 2020 fares there were back at 2010 levels. In English non-metropolitan areas fares continued to rise in real terms until in 2020 and were nearly 25% higher than in 2010.
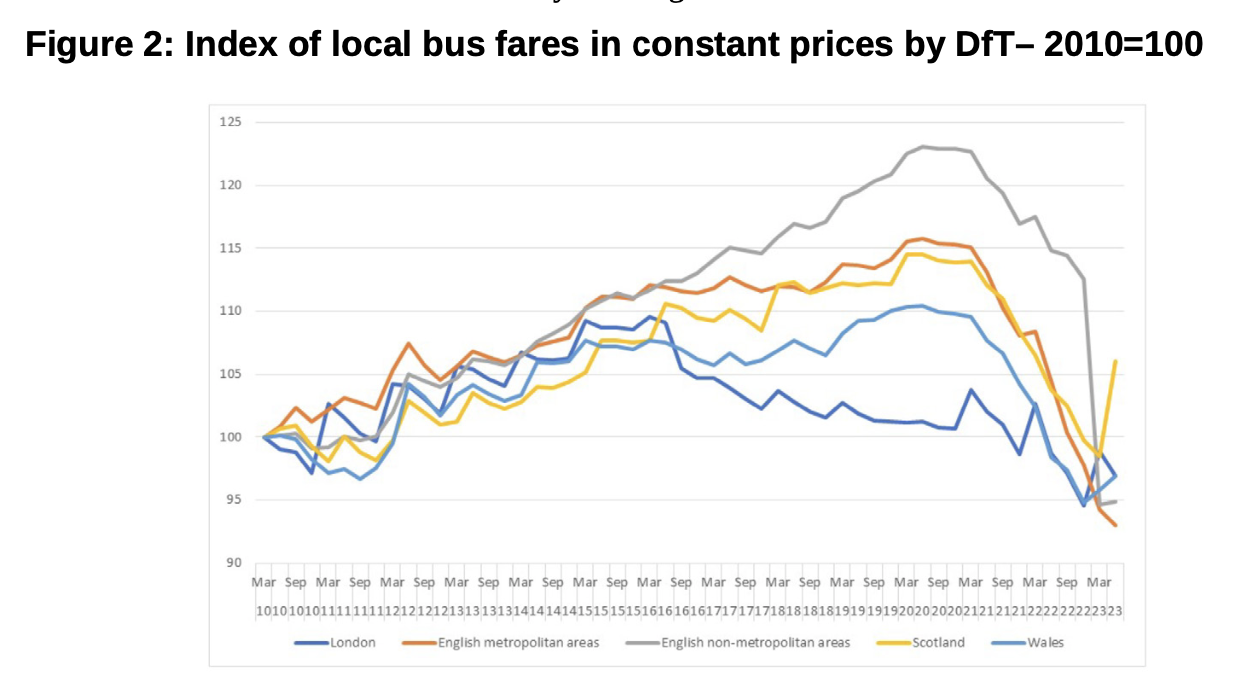
A combination of revenue support during the pandemic, high levels of inflation without corresponding increases in fares and the £2 bus cap has meant large falls in real bus fares since 2020. The biggest falls have been in areas with the highest fares, that is, in English non-metropolitan areas where average fares have fallen by a quarter. While Scotland which has not capped fares, but has generous concessionary schemes, has bucked the trend and is now the only area where fares are now higher than in 2010 in real terms. The £2 bus cap does not operate but there is a 1Bws ticket available across North Wales with a daily charge of £6.50.
Monitoring and evaluation is underway of the £2 fare cap by both the Department of Transport and Transport Focus, the transport users’ body
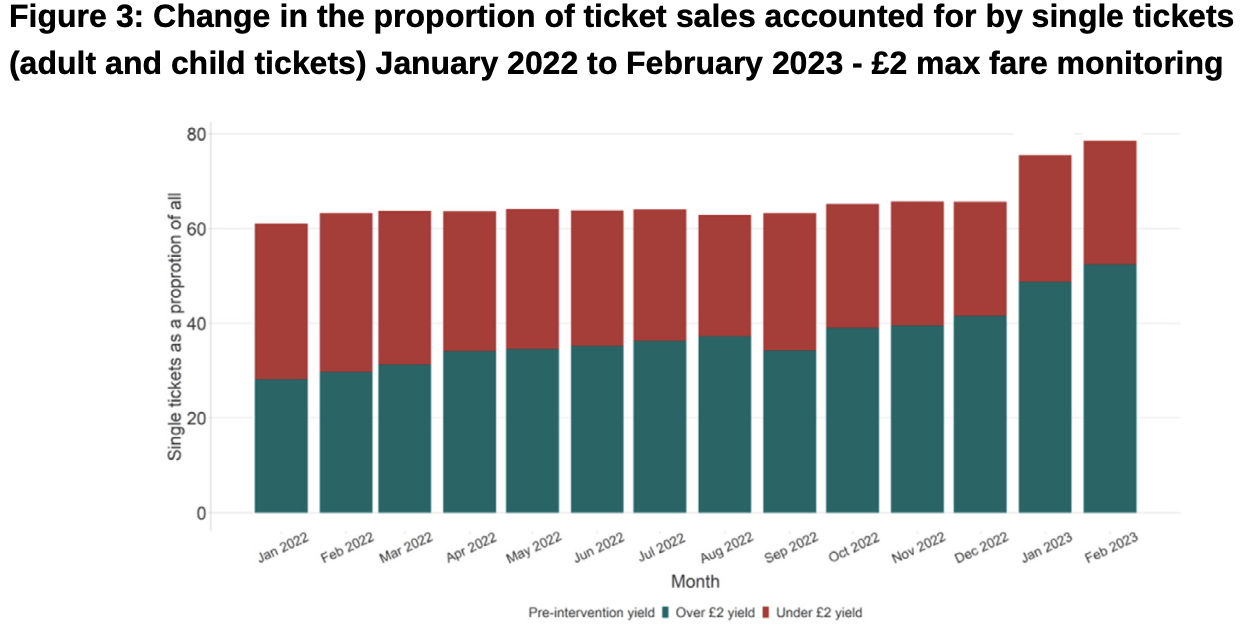
The initial work for the DfT by Frontier Economics and SYSTRA evaluating the impact of the £2 fare cap found that 35% of those surveyed reported making more journeys as a result of the scheme. Of these 76% reported making additional bus journeys at least once per week and 24% reported that their additional bus journeys were less frequent. One impact of the scheme is an increase in the proportion of passengers buying single fares, Figure 33. This may be due to the generation of more trips and or a switch from daily tickets to buying singles where this is now cheaper.
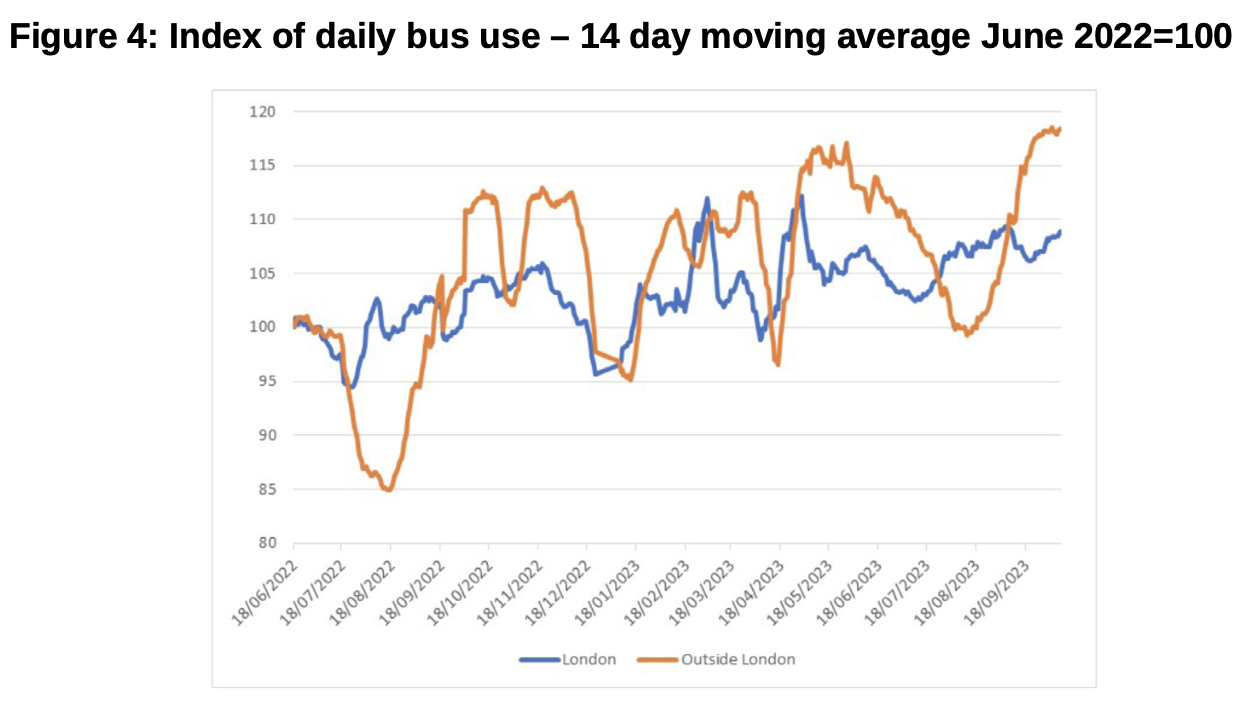
The impact on total bus patronage of the price cap is more difficult to determine. Figure 44 shows an index of daily bus use for London and the rest of England from June 2022 to September 2023, prepared by Jacobs. It uses a 14 day moving average to provide a better indication of longer term trends. It is notable that London bus use is more stable over the period. The impact of the summer holidays and loss of school and college traffic is clear on bus use outside London.
While it is difficult to determine from the chart, the average index value for bus use both in and outside London over the period June to December 2022, is virtually identical. For the period from January 2023, when the £2 price cap was introduced to September 2023, bus use both in and outside London has increased, but the latter has grown by 3% more. Although to complicate matters single bus fares in London increased by 6% in March 2023 which will have negatively impacted demand. However, given around a third of bus passengers travel for free on concessionary passes and as highlighted earlier fares have already been capped in some areas it is likely that the £2 bus cap has had a material impact on bus use outside London.
As well as the DfT commissioned research, Transport Focus, the transport user watchdog, carried out two waves of a survey focused on awareness and impact of the £2 fare cap in January and March 20235. Its survey found only 28% of respondents used a bus at least once a month but that 56% were aware of the £2 cap. Not surprisingly regular bus users were far more aware of the scheme than those who do not use them, with 81% of those who use buses a couple of times a week knowing about the scheme compared to 29% of those who do not use buses and would never consider doing so.
Asked whether the fare cap was making any difference to their use of buses, 11% stated they were making more trips. Again existing regular bus users were the group more likely to make additional trips. Given buses tend to be used by lower income groups and those without cars it is not surprising that it is these groups that have seen the largest benefit from the cap. For example, 21% of those living in a no-car household were making more trips compared to 6% for those living in a two car household, for those with an income of under £21,000, 15% were making more trips compared to 7% for those with an income of over £41,000.
References and links
-
Source: NTS0601: Average number of trips, stages and distance travelled by sex, age and mode: England, https://www.gov.uk/government/statistical-data-sets/nts03-modal-comparisons
-
Source: Department for Transport 2023 - https://www.gov.uk/government/statistical-data-sets/bus-statistics-data-tables#quarterly-bus-fares-statistics
-
Source: Department for Transport, Frontier Economics and Systra: Evaluation of the England’s £2 bus cap https://www.gov.uk/government/publications/evaluation-of-the-2-bus-fare-cap
-
Source: Jacobs based on https://www.gov.uk/government/statistics/transport-use-during-the-coronavirus-covid-19-pandemic
John Siraut is director of economics at Jacobs.
This article was first published in LTTmagazine, LTT879, 31 October 2023.
You are currently viewing this page as TAPAS Taster user.
To read and make comments on this article you need to register for free as TAPAS Select user and log in.
Log in