TAPAS.network | 15 May 2025 | Commentary | John Siraut
How does the public view the deployment of new technology in transport?

Emerging new technologies could significantly reshape the transport landscape in coming years – but are the travelling public ready to embrace their adoption? The Department for Transport conducts a regular technology tracker attitudes survey and takes a look at its findings and what they tell us.
ANY TRAJECTORY of change in transport behaviour is likely to involve elements of the adoption of new travel technologies, and that itself will depend a lot on public acceptance of them. This includes a number of developments in private vehicles such as the switch to EVs and possibilities of automated /driverless cars, and even travel on ‘flying taxis’, not to mention the use of drones for other purposes such as parcel delivery. To assess the views on these possibilities the Department for Transport conducts a regular technology tracker survey to gauge public attitudes towards new transport technologies. This comprehensive survey covers both various aspects of existing car use, and public perception of emerging transport technologies.
Wave 11 of the series (surveys take place at roughly six-monthly intervals) involved a survey of a representative sample of 3,622 adults aged 16+ across England, drawn from Ipsos’ KnowledgePanel. Fieldwork took place between 7th December and 13th December 2023, but the results have only recently been published.
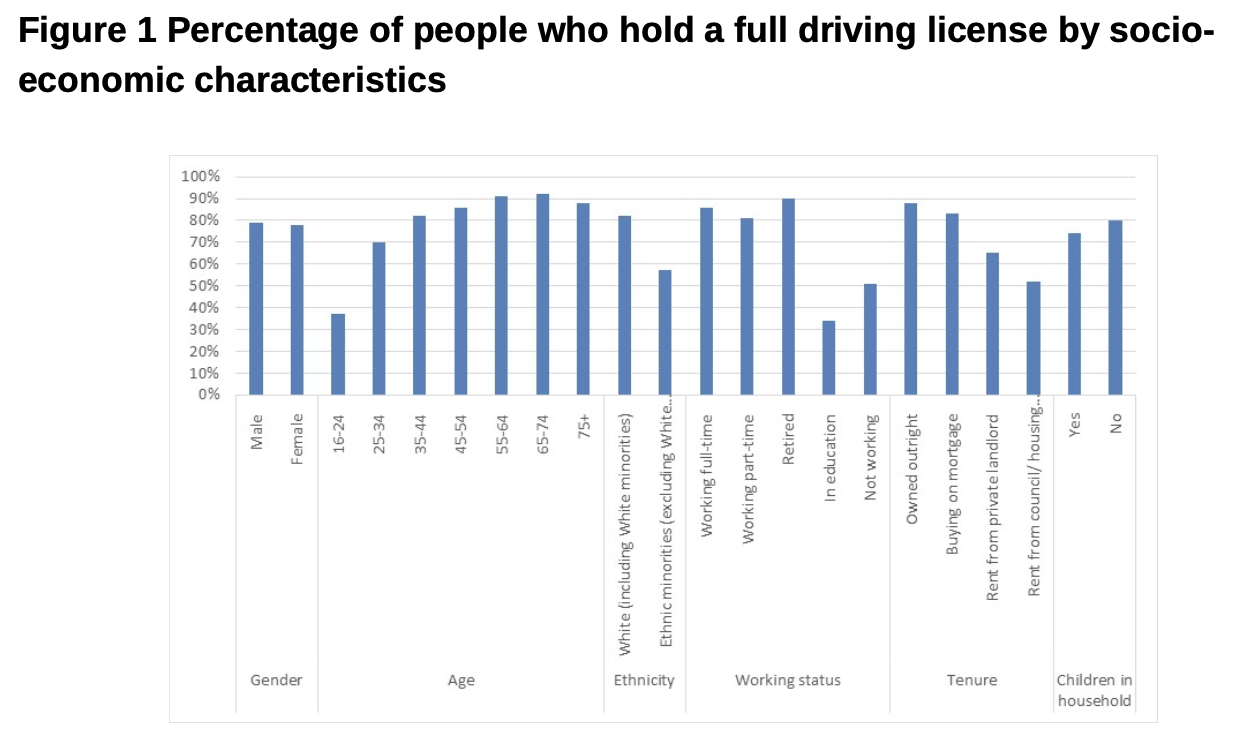
It first sets the scene by revealing that just under 80% of the population aged 16 and over holds a full driving license, with virtually identical figures for men and women. Interestingly, as shown in figure 1, a higher proportion of those over 75 years old possess a full driving license compared to the 45-54 age group. There is a notable disparity based on ethnicity, with individuals from ethnic minorities being 25 percentage points less likely to hold a full driving license than those who are White (including White minorities). Though some of these general statistics are available elsewhere, this survey data allows cross-tabulation between car ownership and other demographic/behavioural issues.
Housing tenure also plays a significant role in driving license possession. Those living in rented accommodation, both private and public, are markedly less likely to have a full driving license compared to individuals who are buying on mortgage or owning their homes outright. Perhaps surprisingly, people without children are marginally more likely to have a full driving license than those with children. Additionally, retirees are more likely to hold a full driving license than those working full-time.
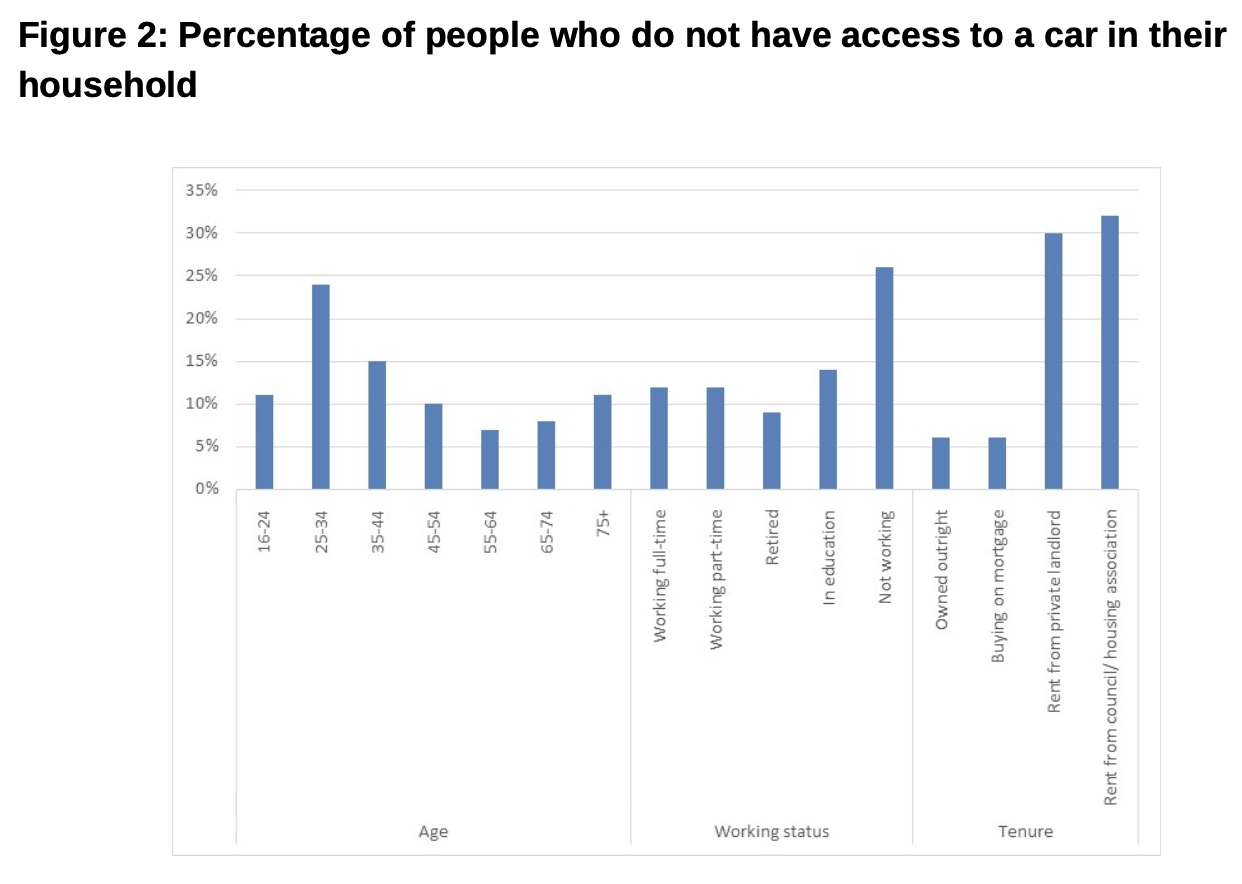
Car availability within households tends to mirror driving license possession. Not surprisingly those without a full driving license are less likely to live in a household where a car is available. The data shows that almost a quarter of 25-34 year olds do not have access to a car in their household, figure 2. This figure rises to nearly a third for people in rented accommodation. At a regional level, 30% of London residents do not have access to a car.
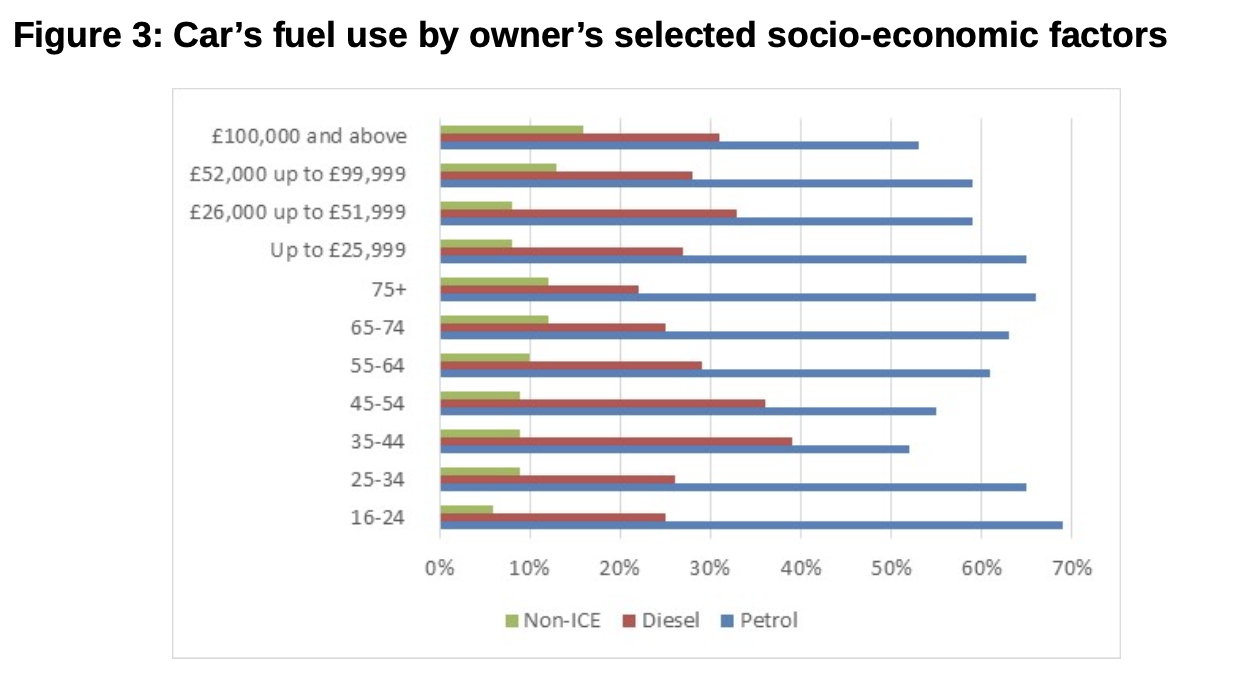
When it comes to emerging new private transport related behaviour, electric vehicle ownership shows a clear correlation with income levels, which is partly related to age, ( figure 3). Put simply, higher income earners are more likely to own an electric vehicle. However, it’s notable that a higher proportion of those aged over 75 have an electric car compared to those aged 45-54.
Continuing diesel car ownership is highest among those aged 35-44 and lowest for those aged 75+ and 16-24. Perhaps significantly, the youngest age group (16-24) is most likely to have a petrol car. Also interestingly, petrol car ownership declines as household income increases. Those with a household income under £26,000 are 11 percentage points more likely to own a petrol car than those with a household income over £100,000.
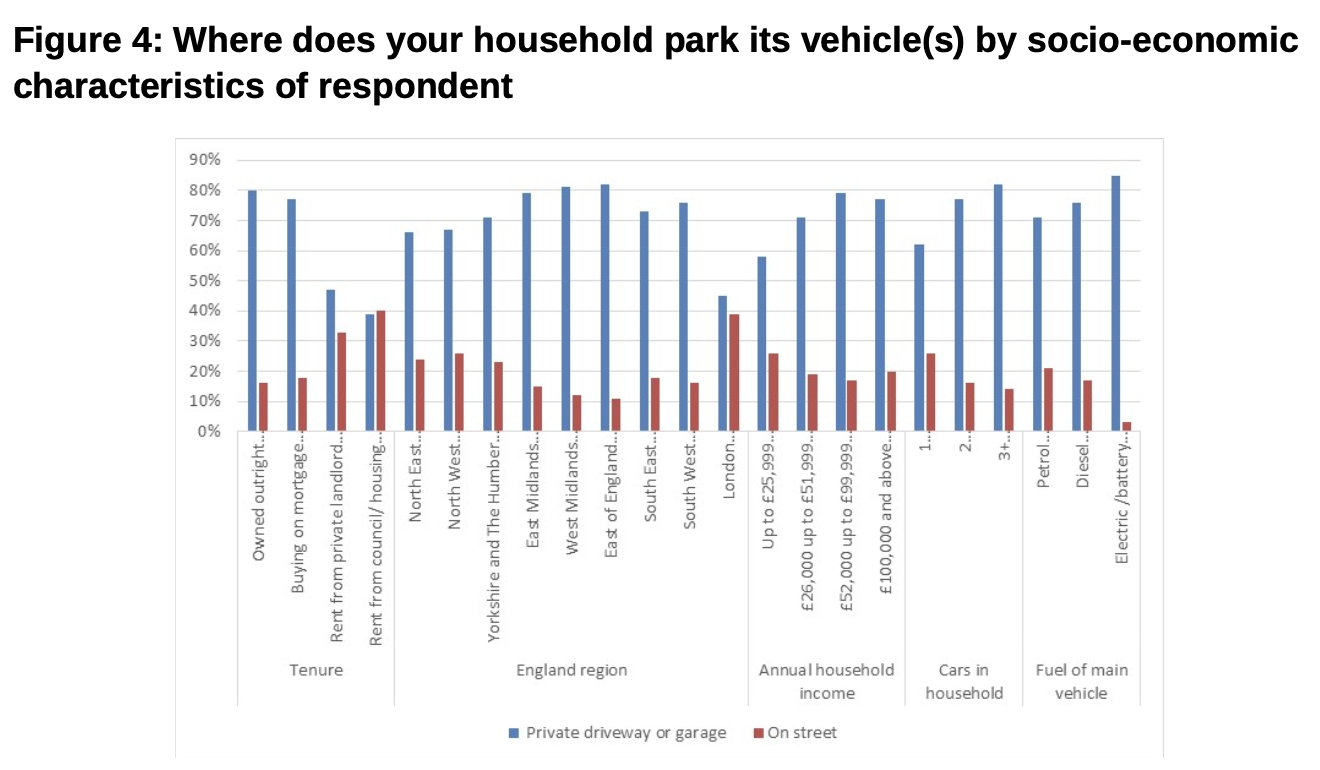
The survey also explored where people park their cars. Figure 4 shows the proportion of respondents who park on a private drive or garage and those who park on street. The remainder tend to park in communal or public car parks. Housing tenure significantly impacts parking availability. Homeowners, whether owning outright or buying on mortgage, predominantly park their cars in private driveways or garages. In contrast, renters, both from private landlords and council/housing associations, show a higher tendency to park on the street, with 33% and 40% respectively doing so.
The type of housing stock in different regions also influences parking choices. Areas with higher proportions of terraced housing, such as the North East and North West, have a higher proportion of people parking on the street. This trend is most pronounced in London, where almost as many people park on the street as on a private drive.
As might be expected, higher incomes generally lead to lower rates of on-street parking. However, those living in households earning over £100,000 have a slightly higher level of on-street parking compared to those in households earning £52,000-£100,000. This anomaly might be due to higher-earning households being more likely to be resident in London, and inhabit areas with housing stock from earlier periods before mass car ownership became the norm – such as Regency,, Victorian and Edwardian terraces, and blocks of inter-war and post war flats with minimal spaces for parking
The number of cars in a household also correlates with parking choices. Households with three or more cars are most likely to use private driveways or garages (82%), compared to those with just one car (62%). However, the 15% of households with three or more cars seems to suggest markedly increased demand for on-street parking space whilst it’s worth noting, on the same topic, that those areas with residential parking permits tend to only allow one car per address.
Owners of electric or battery-powered cars overwhelmingly use private parking (85%), likely due to the need for charging facilities. This suggests that lack of off-street parking could be a significant barrier to the uptake of electric cars.
When it comes to future car purchases, the survey reveals that few people plan to buy cars new, regardless of their socio-economic characteristics. Overall, just 27% of respondents stated they would buy new, 70% second-hand, and 3% were undecided. Even among those with a household income of more than £100,000, only 35% stated they would buy new, while 62% preferred second-hand, and 3% were unsure.
Interestingly, among those whose next car is likely to be electric, 44% stated they would buy new and 52% second-hand. Regarding the fuel type of their next car, 37% stated petrol, 30% hybrid, 13% diesel, and 13% electric only. Given the preference for buying second-hand, and the UK Government’s aim to stop the sale of new internal combustion engine cars by 2030, it is likely to be some time before electric cars make a sizeable inroad into the national car fleet. DfT projections are that it will be 2033 by the time electric vehicles reach 50% of car mileage, a reflection of people’s desire to still buy internal combustion engined cars.
Looking to future technology, respondents were asked how familiar they were with the concept of self-driving cars. Figure 5 shows the proportion of respondents by age and gender who stated they have a great deal or a fair amount of knowledge of self-driving cars or autonomous vehicles (AVs).
There is a notable gender difference, with 33% of males reporting a great deal or a fair amount of knowledge about AVs compared to just 10% of females. However, it’s important to note that men and women tend to respond differently to surveys, with men more likely to state a view on a subject even with limited knowledge, while women are generally more reticent to do so. Therefore, the difference between men and women might be exaggerated.
Age also plays a role in AV awareness. Younger age groups, particularly those aged 25-34 (27%) and 16-24 (23%), report higher levels of knowledge compared to older age groups. This trend gradually declines with age, with only 17% of those aged 75 and above claiming to have a great deal or a fair amount of knowledge about AVs.

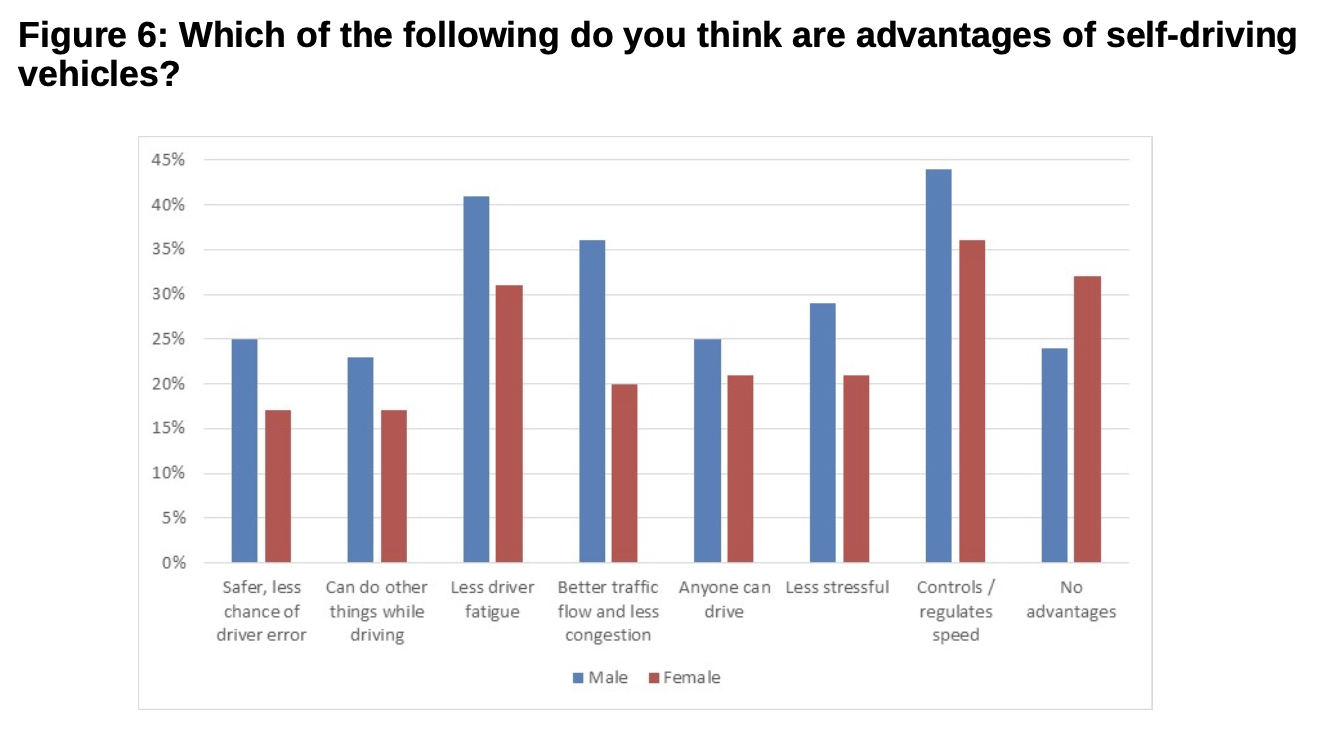
Regarding the perceived benefits of AVs, males generally perceive more advantages compared to females, particularly in areas related to safety, driver fatigue, traffic flow, and stress reduction, (figure 6). Females show more scepticism, with a higher percentage believing there are no advantages to AVs. However, only 3% of males and 2% of females believe there are no disadvantages at all related to AVs.
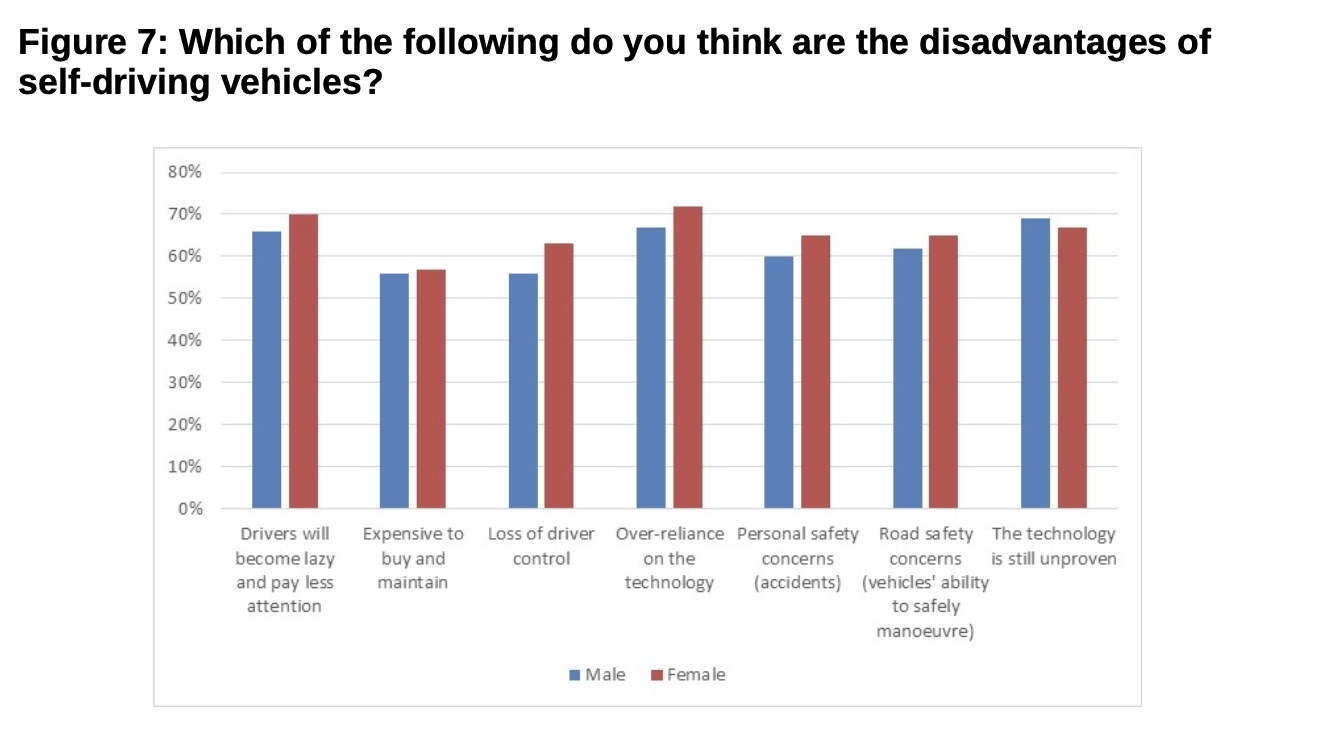
When it comes to perceived disadvantages of AVs, women were more negative than men, but the differences are relatively small, (figure 7). Overall, the perception of AVs is far more negative than positive across both genders.
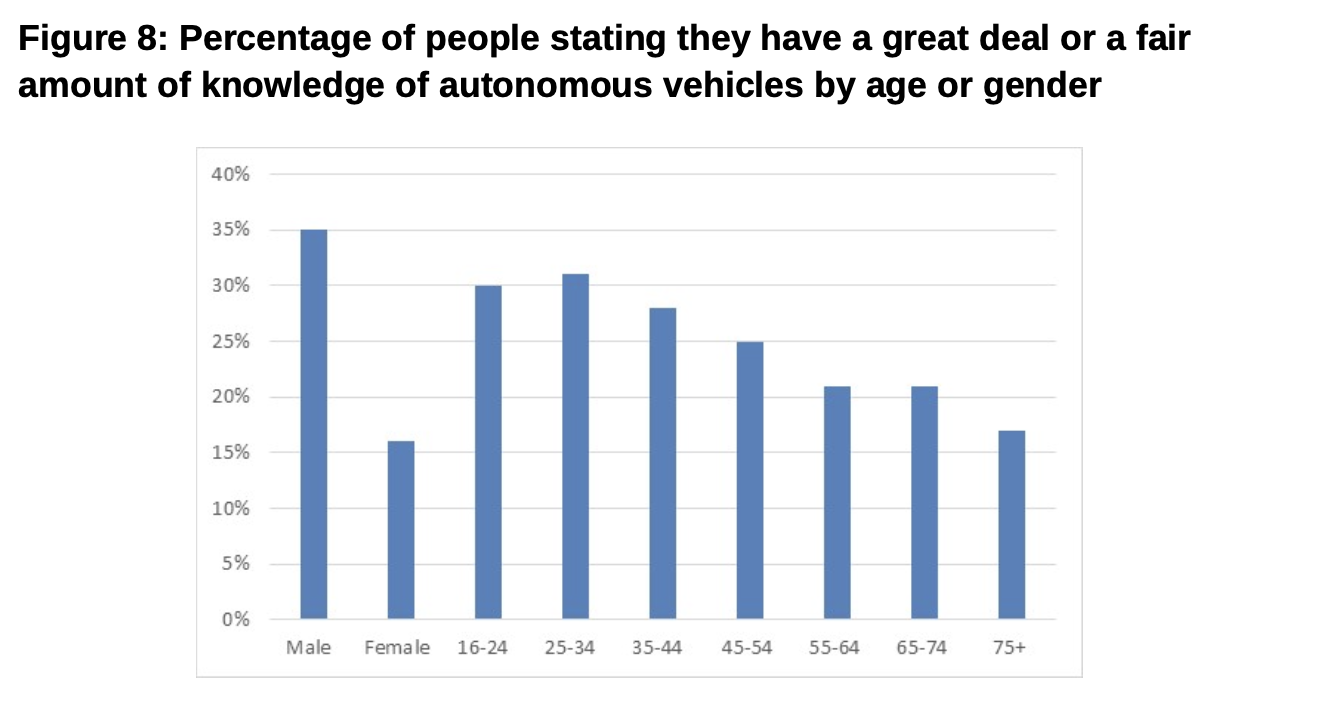
Claimed knowledge about drones shows less of a gender difference compared to AVs, but the age profile follows a similar pattern, (figure 8). It is highest amongst males at 35per cent
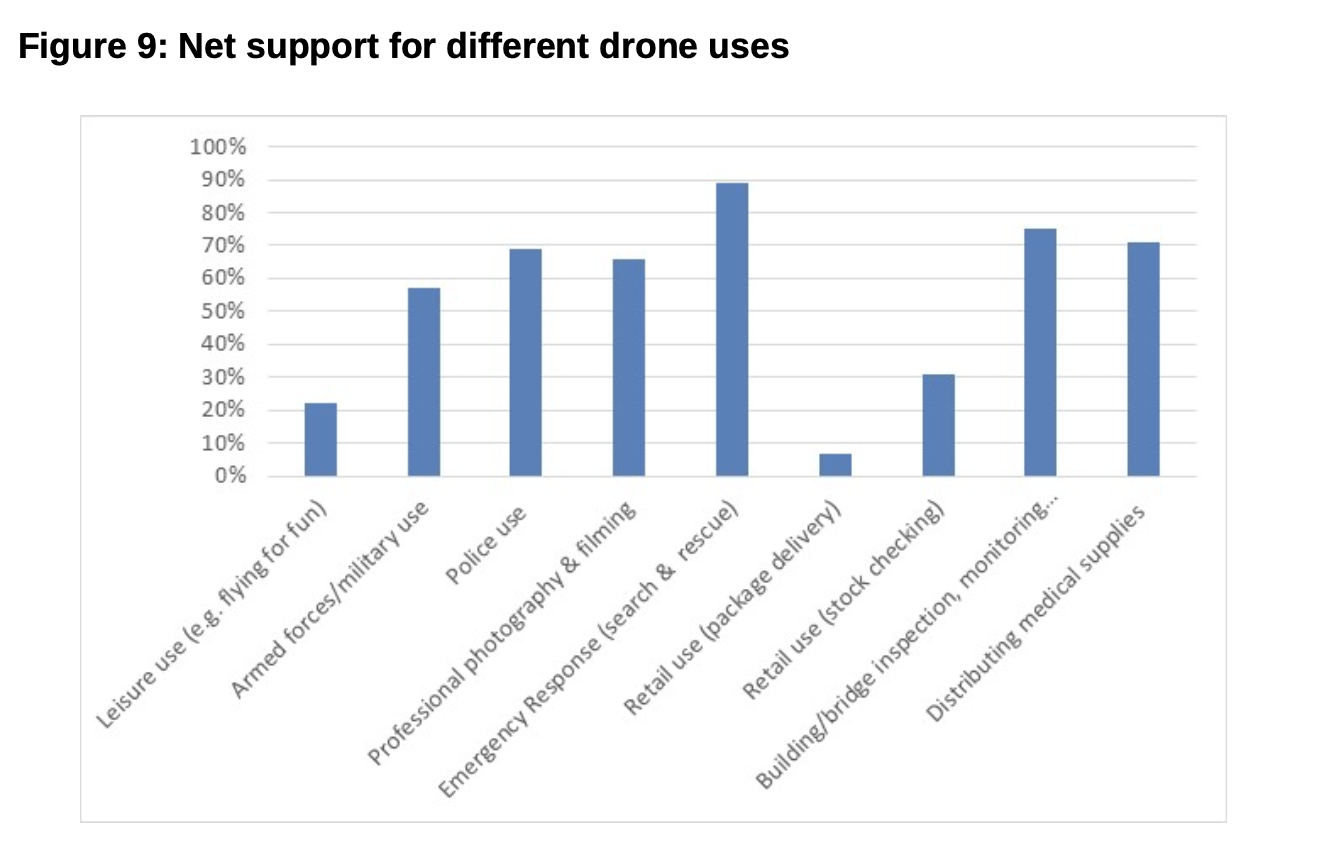
Support for various uses of drones is generally high as can be seen from figure 9, the highest level being for deployment by the emergency services . But a significant exception is package delivery, which gains very limited positivity. However, there are significant differences in support for this activity based on region, gender, age, and earnings.
For instance, there is net support of -1% for drone package delivery in the North East compared to +15% in London. Male support is at +13% but only +2% for women. Among age groups, 65-74 year olds show -6% support, while 25-34 year olds are at +18%. Income also plays a role, with those having household incomes over £100,000 showing +16% support, compared to just +2% for those earning under £26,000.
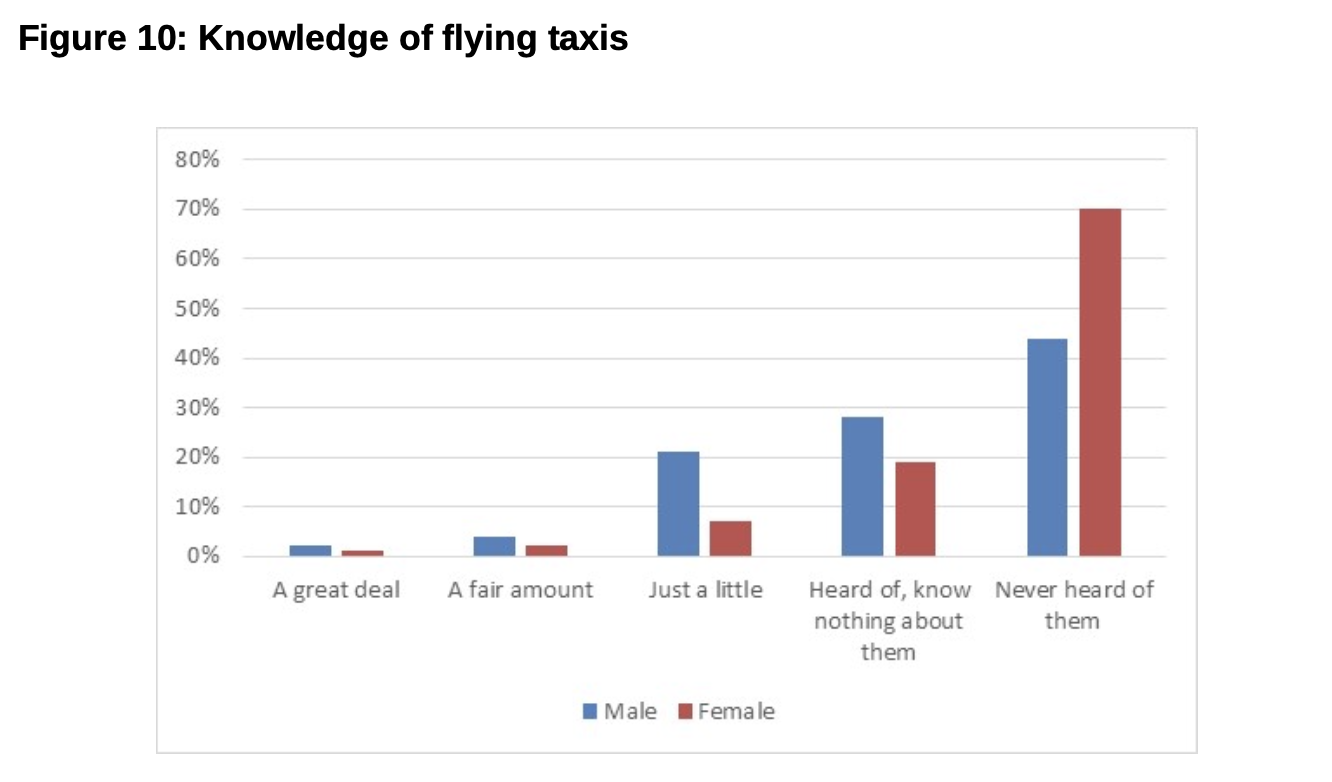
While respondents had some knowledge of AVs and drones, the concept of ‘flying taxis’ remains virtually unknown to the public as shown in figure 10.
When asked about their willingness to use a flying taxi service, the response was negative across both genders and all age groups, ( figure 11.) Those aged 35-44 were the most willing to consider using them, but even in this group, less than 30% said they were very or fairly likely to use them, compared to over 50% who were very or fairly unlikely to do so.

Knowledge and acceptance of new technologies like autonomous vehicles and drones vary significantly across demographic lines, the Department for Transport’s technology tracker survey underlines. Younger, male, and higher-income individuals generally show more familiarity and positive attitudes towards these technologies. The concept of flying taxis, being the newest and most unfamiliar, faces the most scepticism across all demographics.
The disparities in knowledge and acceptance across different demographic groups also underscore the importance of policy measures to ensure equitable access and understanding of new transport technologies.
As the transport sector continues to evolve, ongoing monitoring of public attitudes may prove crucial in guiding robust policy decisions and industry developments. This survey thus provides some interesting insights for policymakers, industry leaders, and researchers.
-
All data is sourced from Department for Transport: Transport and transport technology: public attitudes tracker: wave 11.
https://www.gov.uk/government/publications/transport-and-transport-technology-public- attitudes-tracker
John Siraut is director of economics at Jacobs.
This article was first published in LTT magazine, LTT915, 15 May 2025.
You are currently viewing this page as TAPAS Taster user.
To read and make comments on this article you need to register for free as TAPAS Select user and log in.
Log in