TAPAS.network | 1 August 2023 | Commentary | John Siraut
Post-Pandemic travel patterns show some change – but commitment to the car remains strong
Significant changes in travel behaviour followed the arrival of the COVID 19 pandemic, and transport professionals have faced the challenge of determining how long term and stable they will be when adjusting their forecasts and approaches to planning for future demand. New survey results just published give some indications of the way the patterns are evolving – and what people think about their travel choices. examines the data, and provides some thoughts on the key messages.
THE DEPARTMENT FOR TRANSPORT has recently published some important work it commissioned researching public attitudes, needs and behaviours regarding travel following the pandemic, and in response to other challenges, such as the rising cost of living, and people’s thoughts about climate change. The surveys were undertaken in England in November 2022 by Ipsos, and the results appear in the Our Changing Travel research report. This article analyses some of the eight mega-bytes of data set out in 1,476 excel worksheets that was published alongside it. Some interesting insights into matters like ticket purchases, perceived relative cost of car and public transport travel, and willingness to change behaviours are included in the findings.
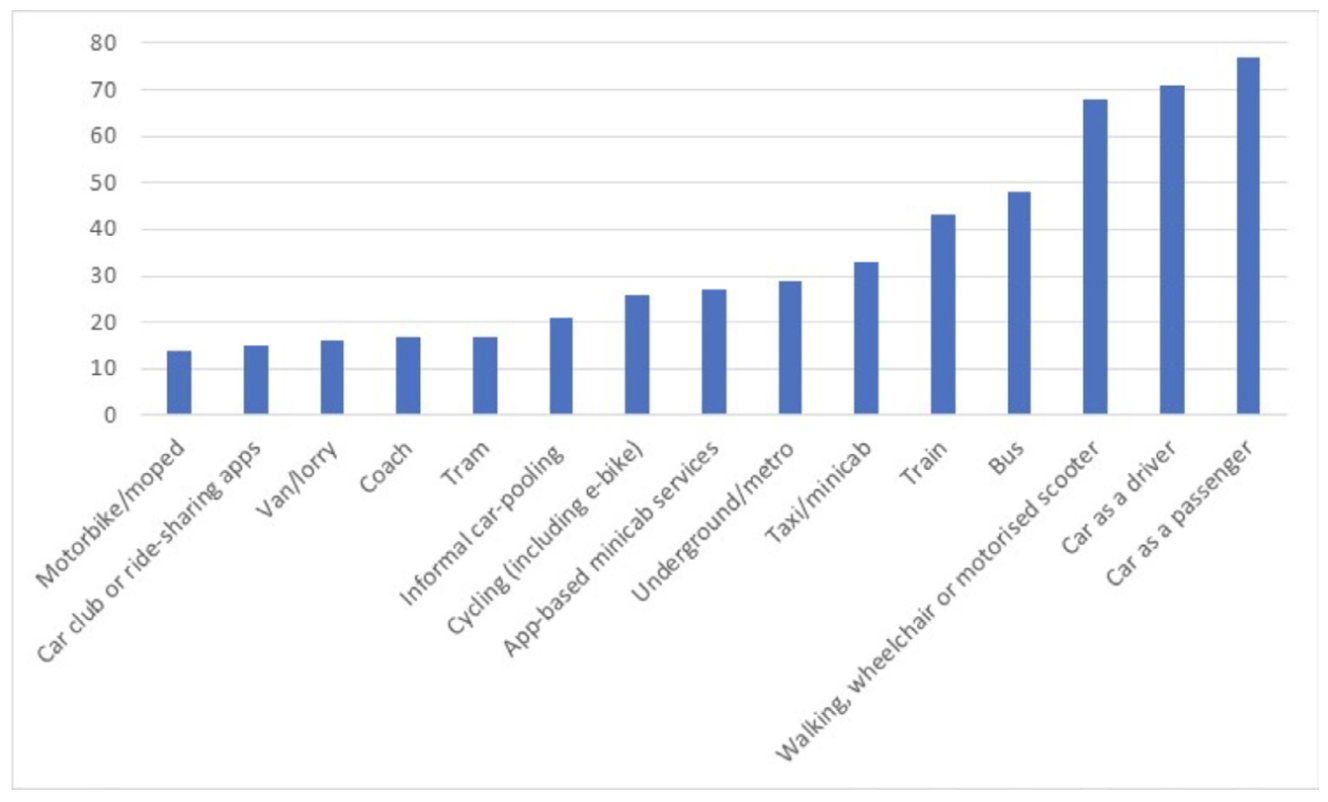
The research begins by examining the various modes of transport being used by people. Figure 1 (see next page) presents the distribution of individuals who used each of the fifteen specified modes at least once within a four week period in October to November 2022. It is perhaps worth noting that these modal choices embrace the ever wider range offered by new mobility concepts and the deployment of innovative technologies. The predominant mode of transport remains travel by car, either as a passenger or a driver. Walking is combined with wheelchair and motorised scooter use in the data and only includes journeys where respondents travelled all the way to their destination by these modes, but it is still a bit surprising that fewer people said they did this than drove a car. Almost half of respondents had used a bus, and a surprisingly high 43% reported using a train. More people said they had used a traditional taxi/minicab than an app-based minicab service, while around 17% said they had used a tram, and the same amount a coach, which in both cases seems very high. The coach figure may tally with recently reported buoyant passenger figures from the main inter- urban coach operators.
Figure 1: Proportion of people using selected modes of transport at least once a 4 week period Oct-Nov 2022
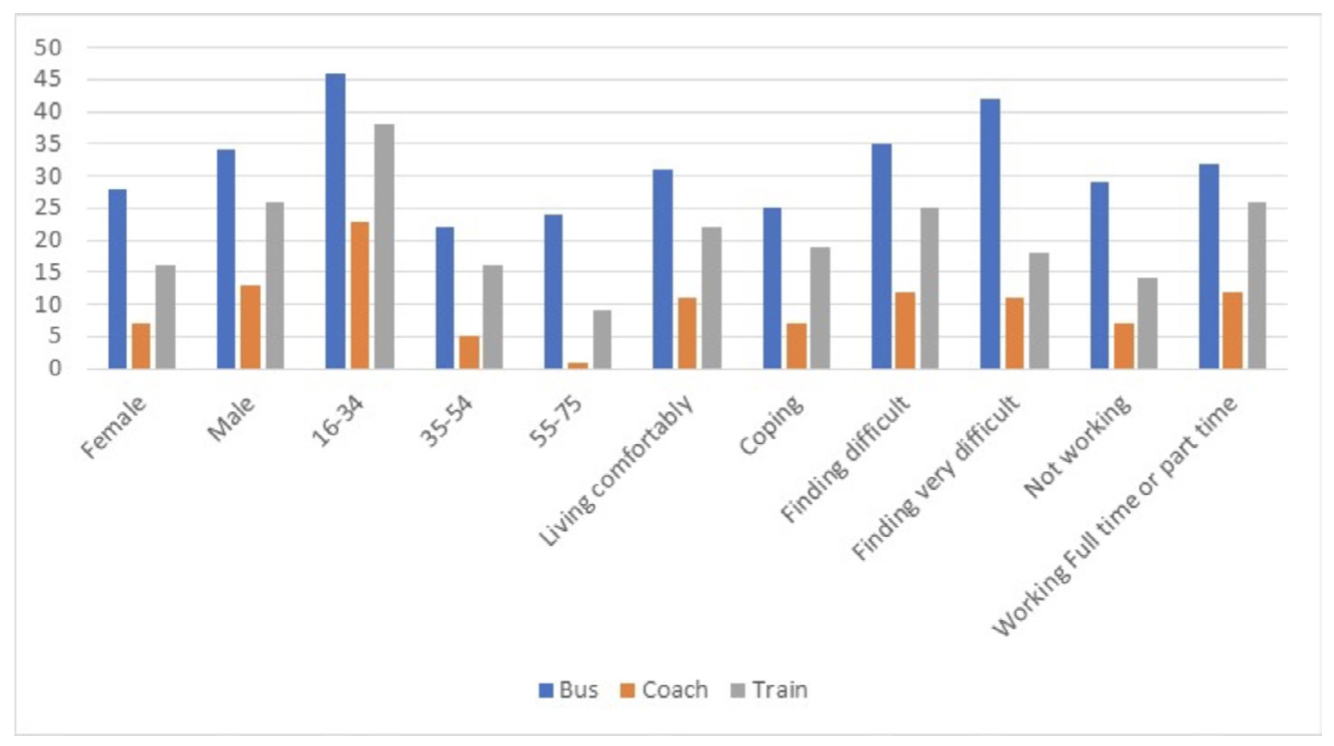
It is unusual to get such detailed data on coach use, with figures 2 and 3 comparing the characteristics of those who used bus, coach and or train services at least once a week. In total 31% of respondents said they used a bus at least once a week, 21% a train and 10% a coach. Figure 2 shows that the proportion of people using each mode decreases markedly by age, except for bus use where the impact of free travel for senior citizens is apparent. While more bus trips in total are made by women than men, more men use the bus at least once a week. It is no surprise that those finding it very difficult to cope with the cost of living crisis are more likely to use the bus than those living comfortably, but there is not much difference in rail and coach use of both groups. Coach use is heavily skewed towards the younger age group with almost a quarter of aged 16-34 travelling by coach compared to just 1% of those aged 55-75.
Figure 2: Proportion of people travelling at least once a week by bus, coach and or train by characteristics
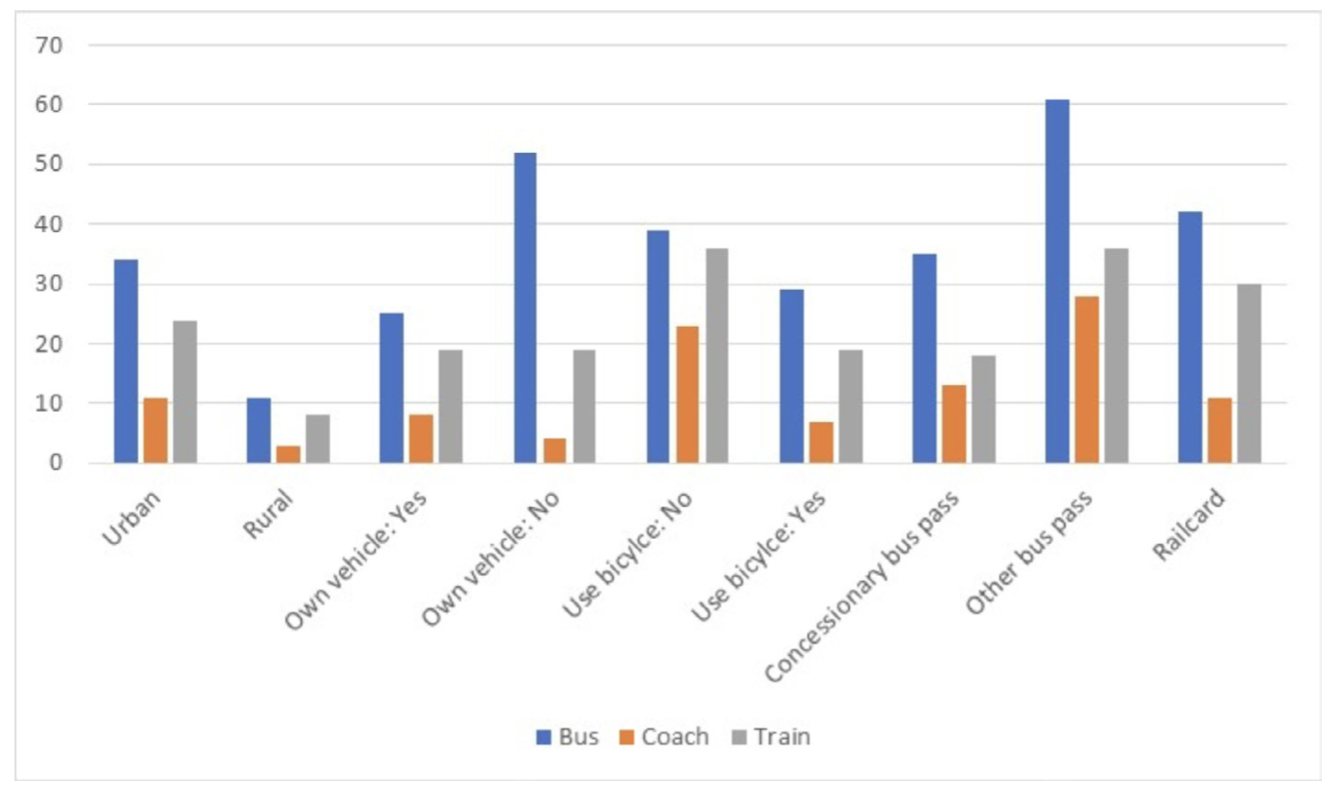
Not surprisingly people living in urban areas are far more likely to use each mode of transport than those in rural areas, as shown in figure 3. It is also not surprising that buses are far more regularly used by those without a private vehicle available than those who do have one. However, it is perhaps more unexpected for car owners to be more than twice as likely to be regular coach users than those that do not. In contrast it is to be expected that bicycle users are less likely to be regular bus users than non-bicycle users. Railcard users are also very regular bus users, and use coaches on a regular basis to the same extent as the average population.
Figure 3: Proportion of people travelling at least once a week by bus, coach and or train by characteristics
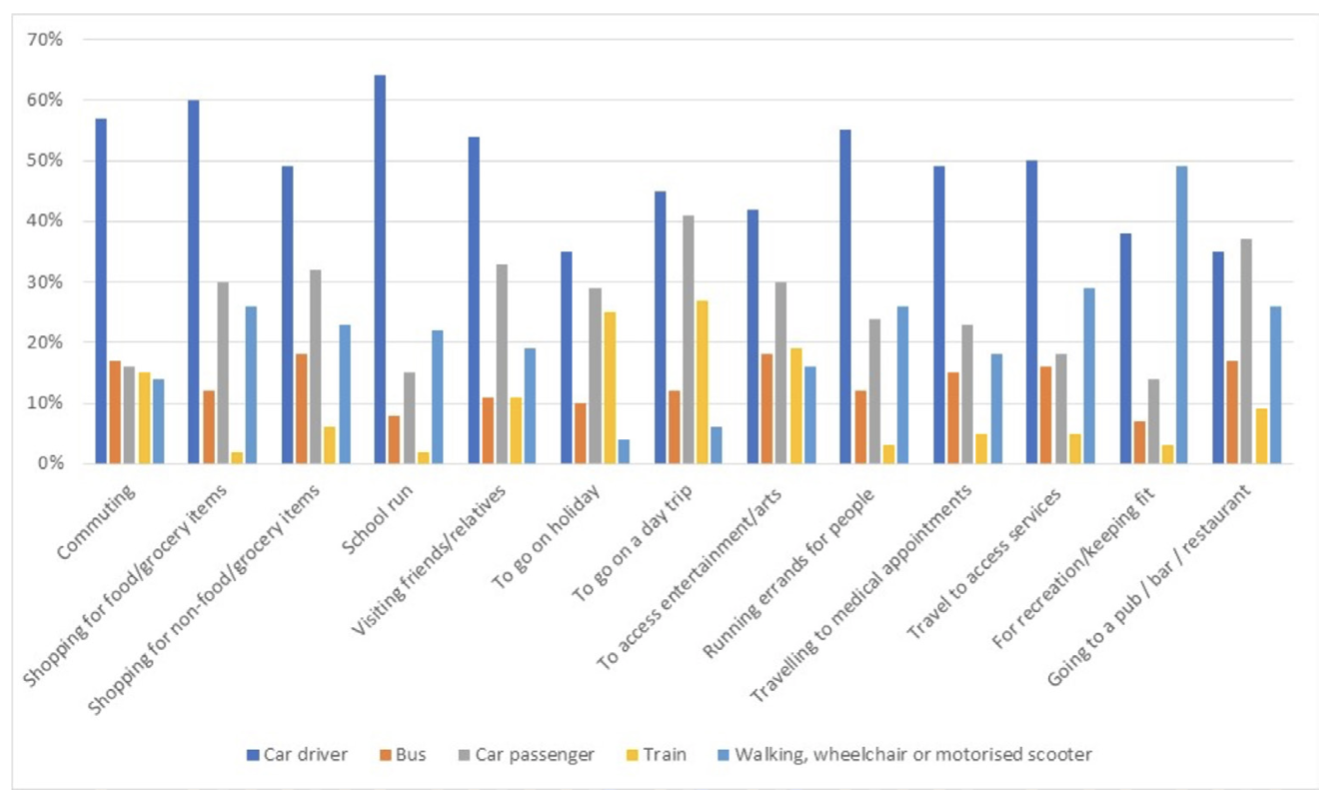
With regard to journey purpose the data not surprisingly shows the dominance of car travel for virtually all journey purposes, figure 4. However, there is also quite a bit of switching between modes amongst travellers as the totals for all journey purposes are well over 100, highlighting that people will use different modes at different times for the same journey purpose. Levels of bus use is relatively constant across all journey purposes, while train use is not surprisingly highest for day trips, holidays and commuting. Walking is most common for exercise, leisure and shopping and disappointingly low for the school run, where at primary school level journey lengths tend to be quite short outside rural areas and walking is possible, though clearly not adopted, presumably by the decision of parents rather than the children themselves.
Figure 4: Proportion of people travelling at least once in a four week period in Oct-Nov 2022 by journey purpose and mode
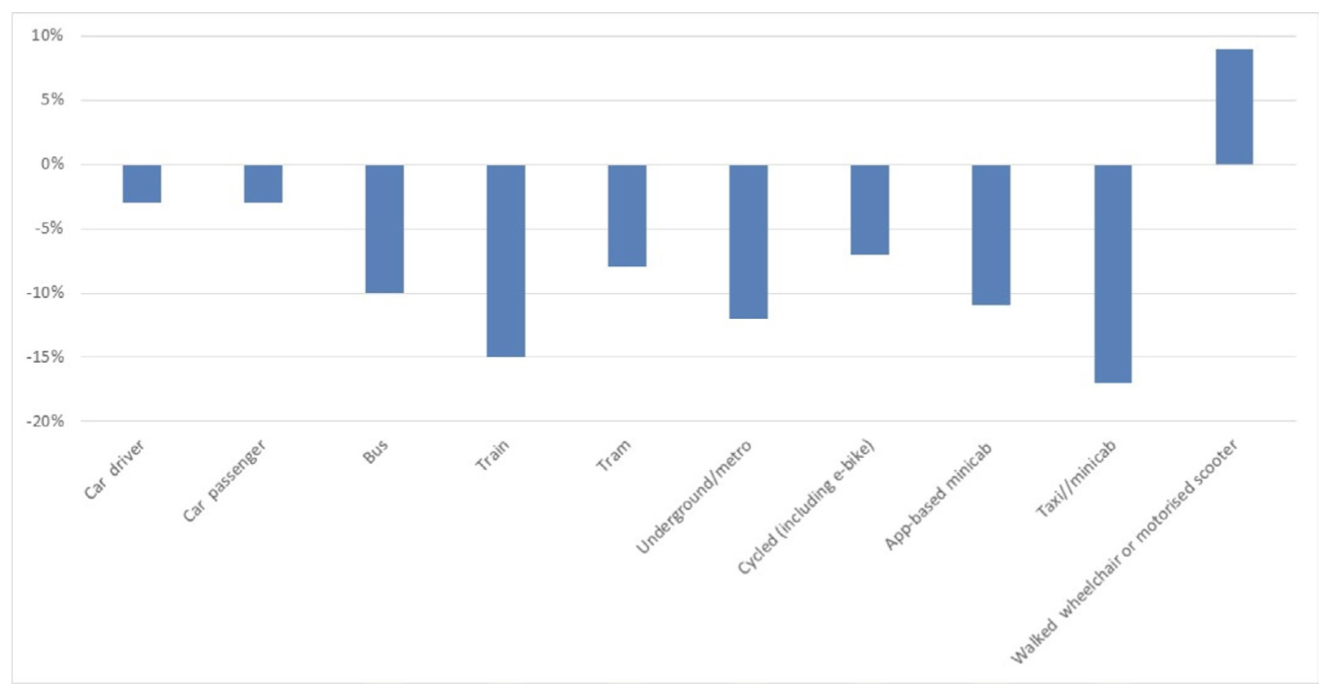
When asked how they have changed their frequency of use of each mode compared to the situation pre-COVID 19, it is clear that people have reduced the amount of travelling they are doing. Working from home, increases in internet shopping, the availability of home takeaway food deliveries, and the use of streaming services for entertainment have all clearly impacted on the amount of travel we do. Figure 5 shows the net change (that is, the proportion of people who said their use of a particular mode has increased, minus those who say it has decreased). So we see taxi/minicab down by 17%, train use down by 15% and bus use by 10%. Cycling and car use are also down, only walking is up.
Figure 5: Change in mode use between Oct-Nov 2022 and pre-COVID 19
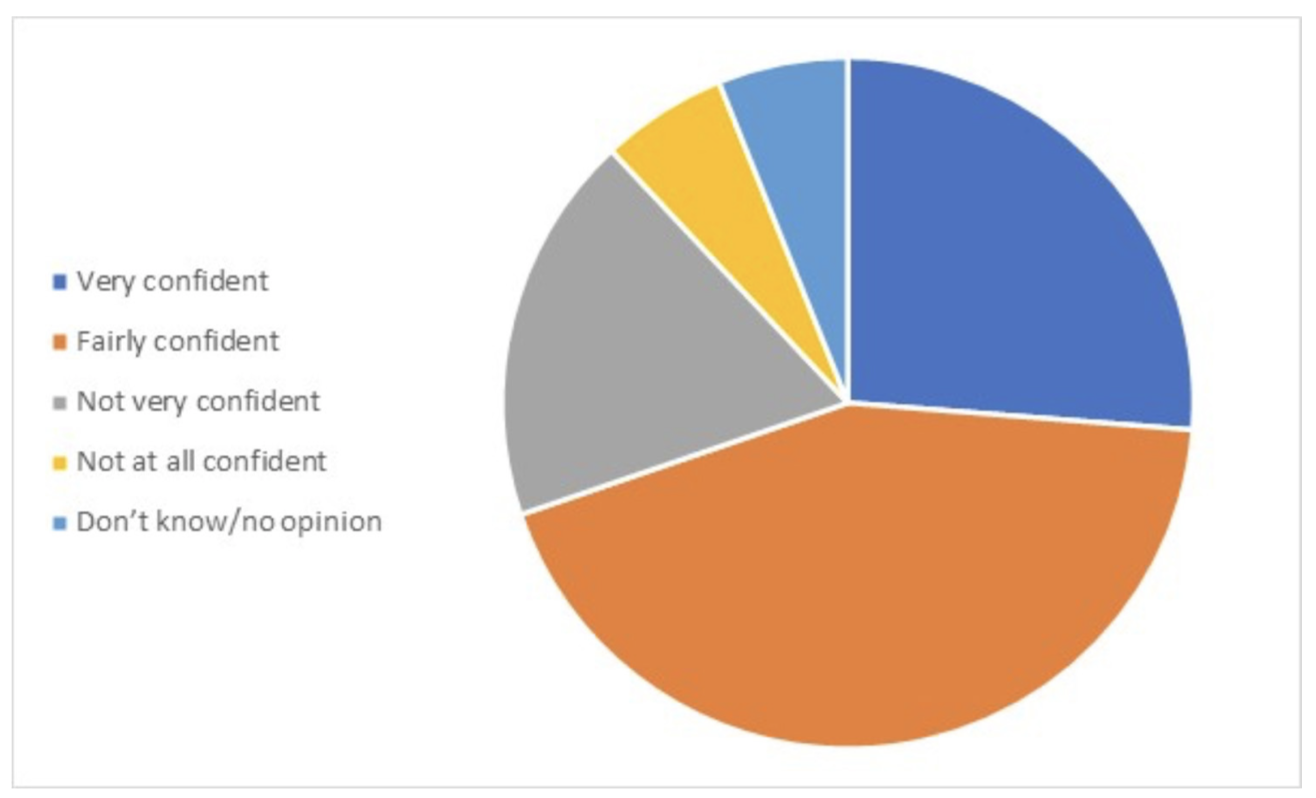
Very pertinent to the present debate about rail station ticket office closures, train users were asked how confident they were that they got the best priced ticket possible for the journey they made. As figure 6 shows only a quarter were very confident, with just over 40% only fairly confident. A quarter of respondents were not very or not at all confident that they had brought the best priced ticket.
Figure 6: How confident are you that you got the best priced train ticket possible for the journey you made?
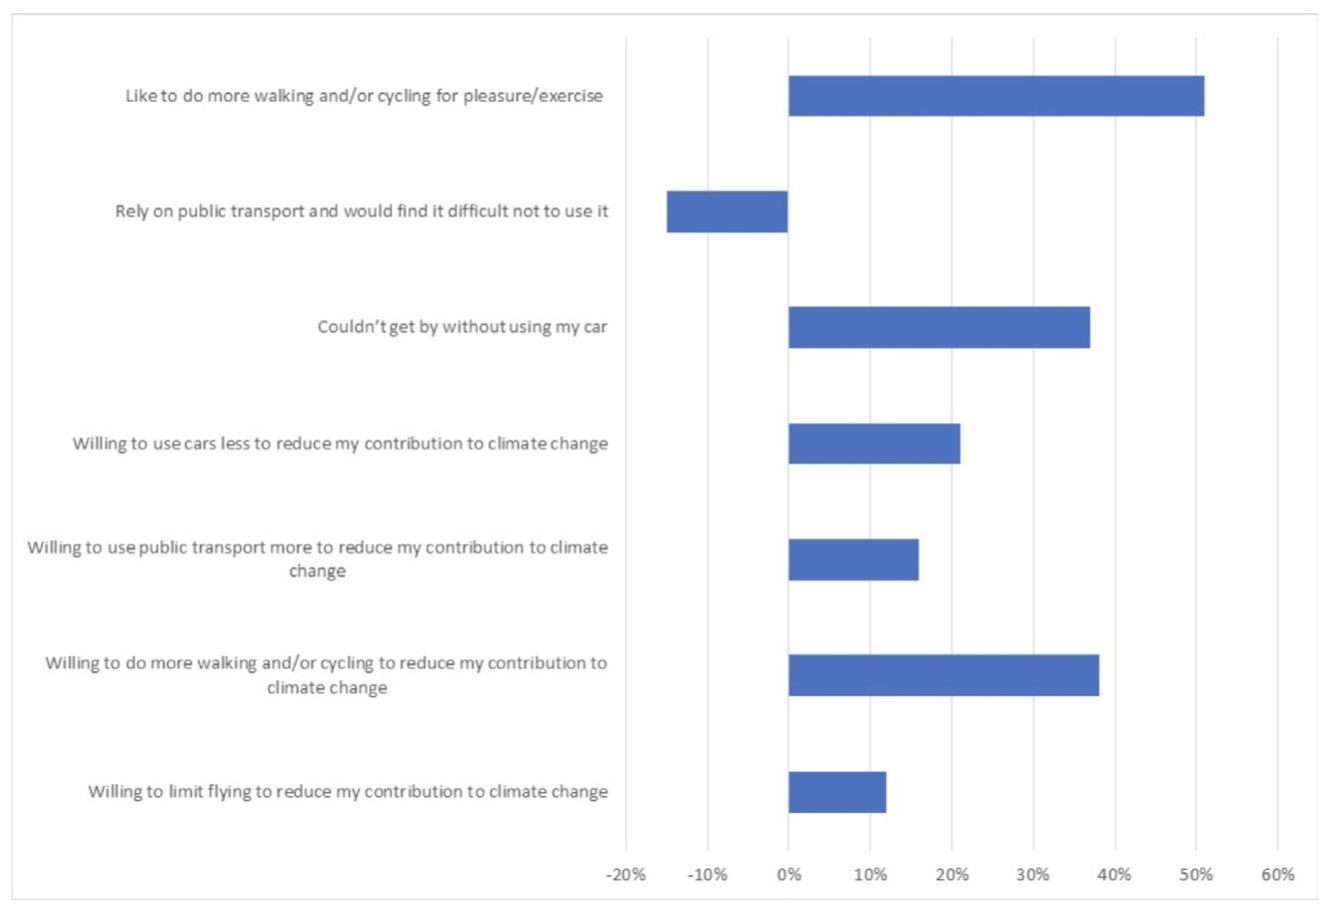
In terms of peoples’ claimed willingness to change their behaviour to address climate change the results show that on average people are not prepared to make major changes, as illustrated by figure 7. Nearly a net 40% of people say they are dependent on their car, only a net 10% are willing to reduce their flying and 20% to reduce their car use. On the other hand people say they are not dependent on public transport and are willing to walk more. When asked for the journeys they make, if they find it cheaper to travel by car than use public
transport, 47% agree and only 16% disagree highlighting a key reason why people will not switch modes.
Figure 7: Net agreement with the following statements
Overall, the data suggests that while total travel has declined in the wake of the pandemic, we have become more dependent on the car. Alongside this, people seem generally unwilling to significantly change their travel behaviours to address climate change, though there seems some disposition to do more walking and cycling.
References
The data reviewed in this article and charts can be found at:
https://assets.publishing.service.gov.uk/government/uploads/system/uploads/attachment_data/file/1165693/our-changing-travel-how-people_s-travel-choices-are-changing.pdf
John Siraut is director of economics at Jacobs.
This article was first published in LTT magazine, LTT874, 1 August 2023.
You are currently viewing this page as TAPAS Taster user.
To read and make comments on this article you need to register for free as TAPAS Select user and log in.
Log in