TAPAS.network | 16 December 2021 | Commentary | Phil Goodwin
£400 per household per year to achieve net zero? A bargain, surely? But...

points to new data that exposes the ‘absurdities’ of treating the carbon impact of the road programme, and its individual schemes, as trivially insignificant
IT WAS A PLEASURE to visit the Smart Transport conference last week, to give a talk with the challenging title of ‘The cost of achieving net zero’. I was one of three speakers in the opening ‘plenary’ slot, sharing the platform with transport minister Trudy Harrison, who gave an enthusiastic speech mainly focused on cycling, and Lord Deben, conservative member of the House of Lords and Chair of CCC, the Climate Change Committee, who gave a speech marked by its simple, direct, comprehensible honesty about how humanity has created the conditions for a future which will proceed under higher global temperatures than have ever experienced during human history.
Well, when I say, ‘shared the platform’, it wasn’t quite like that, as the minister was able to answer a few questions but then had to leave, and Lord Deben sent a pre-recorded video. In the same sense I’ve ‘shared a platform’ with many eminent politicians over the years, including several secretaries of state of whom few actually realised that I was there at all. I can’t say I mind. One of the life lessons I learned from my daughter’s time at drama school was that it’s the important audience there in the theatre that you are talking to, not the unimportant empty seats.
Anyway, my title was ‘The Cost of Achieving Net Zero’ and I built this round a recent ‘Fiscal Risks’ report from the Office for Budget Responsibility (OBR), which referred in turn to the work of CCC[1].
The headline figure was a suggested total Government expenditure of £1.4 trillion from 2020 to 2050, which would be 2% of GDP, of which £1tn is offset by cost savings, so a net cost of £12bn a year, less than 1% of GDP, or £400 per household a year.
Now, at first sight, this does seem to be remarkably cheap, and stunningly good value for money.
‘Tipping point’ effects
There are caveats of course, including some criticisms that the figure doesn’t allow for the embedded carbon in imports, which is large and seems to be getting larger.
But the main comment one must make is that the figure has little meaning unless it is compared with the economic (and social) costs of failing to meet the carbon targets, and – much more important – failing to hold back global climate change from the trajectory that it is still currently on. Figures for that are much more elusive, but at a global level the OBR cited an estimate that with a global average temperature rise of 4°C, one might be talking of a 23% fall in global GDP, over 20 times larger. Other figures are available, larger or smaller, but all of them are massively higher than the cost of meeting net zero.
And the other aspect of the OBR report was its recognition of non-linear or ‘tipping point’ effects not included in such calculations, such as Antarctic ice melt. In a strange, perverse way, it is almost a relief to see in print – from this most august representative of financial prudence – its recognition of the likelihood of extreme events, conflict, war, mass migration, disease patterns, civil unrest, governance breakdown, insurance failures, systemic financial crises, and economic instability. Figures were not estimated for the costs of these, now is it clear what that would mean, but their reality now must be recognised.
Then I went on to discuss the topics that I have written much on in TAPAS, LTT magazine and other places over the last year, on weaknesses in the way in which the appraisal methods we use understate the importance of carbon emissions and what to do about them. I won’t repeat that here except to note one very important development which – at long last – may counter the absurdities of treating the carbon impact of the road programme, and its individual schemes, as being trivially insignificant. That still remains the formal position of Highways England, now retitled ‘National Highways’. The new element is the repercussions of the new BEIS – and DfT – recommended values per tonne of carbon in appraisal, much higher than the old ones.
Even if it is argued the
new carbon values were right ‘at the time the calculations were done’, there is no doubt that they were too low to apply for the future years, from now to 2050 and beyond
For the promoter of any substantial road scheme it is remarkably easy to update the values – less than a second of computer time, I’d say – and I’m quite sure that within a day or two of the new values being published in September there were some swift calculations to see what it does to the appraisal of schemes in the pipeline, out of intense curiosity, not to mention professional responsibility. But none of the results of those calculations have been published, or even leaked out. There is a pretty complete lockdown on discussion of the effects, apart from a rather grumpy message or two from National Highways that they were thinking of using the new values, in future, for the future appraisal of future schemes. That’s not a defensible position, and every day I await an announcement that, of course, all the appraisals will be republished with the new values.
Meanwhile, inevitably, those outside the charmed circle of promoters’ consultants have started to do their own calculations. It’s not quite as easy for outsiders without access to the models, because you need a spreadsheet of estimated carbon outputs, year by year, for the entire appraisal lifetime of a scheme, which is not usually published. Given those figures, you can use a nice little ‘carbon calculator’ tool provided by the DfT.
Revising carbon values
By great good fortune, however, there is an easy short cut which does not require the full spreadsheet. It’s common for the official appraisal to report a figure for the total tonnes of carbon emitted over the 60-year appraisal period, and a total appraisal value of that carbon discounted to the base year for appraisal.
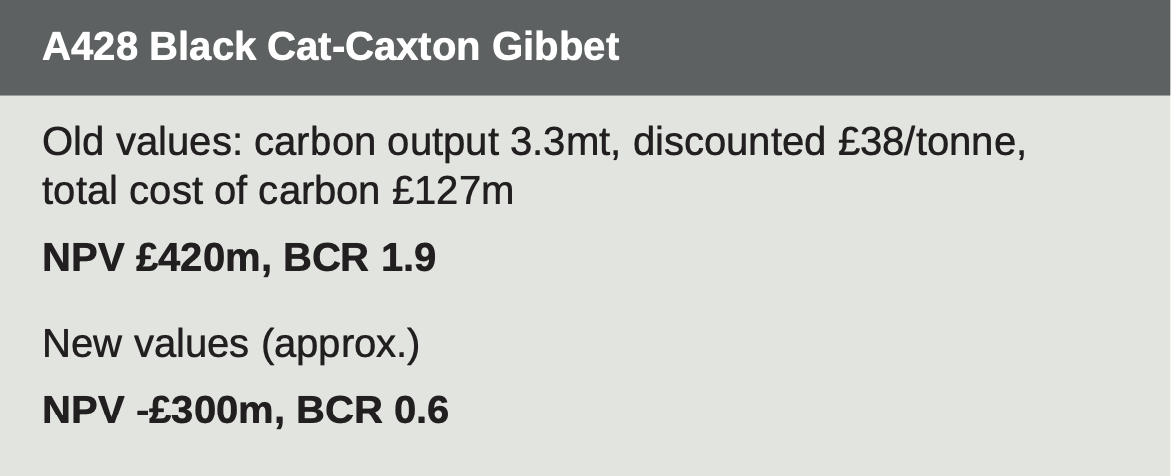
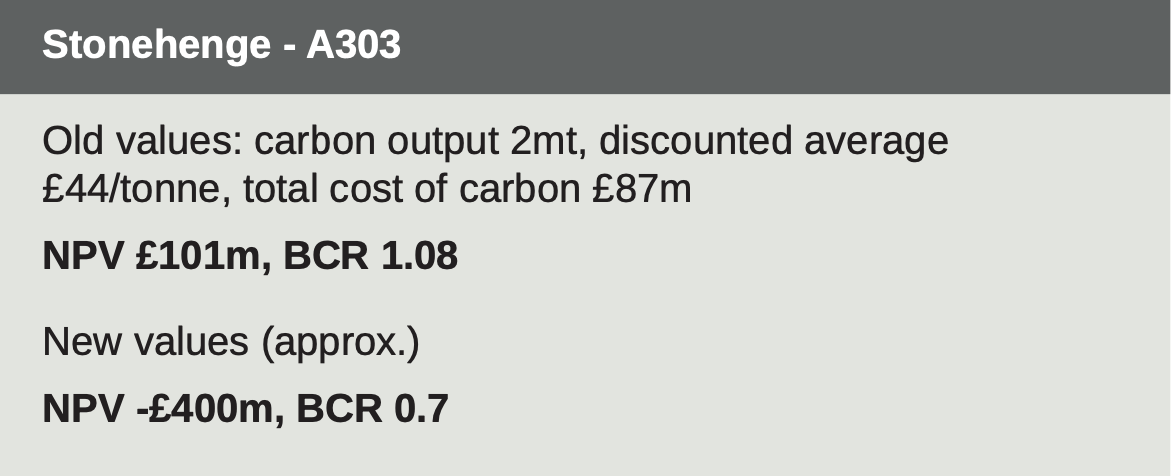
Using those two numbers, the simple question is, how much would it be with the new values? That’s equivalent to estimating the overall weighted, discounted average under the old values, uprated by the weighted discounted average amount they have increased. You can only get an approximate figure. I’ve done that now for two schemes (Stonehenge, and a stretch of the A428 in Cambridgeshire) and in both cases the new carbon values alone are enough to turn a previous figure with a positive net present value and a benefit cost ratio in the range 1 to 2, to a negative net present value and a BCR of under 1. That is to say, the schemes cost more than their benefits.
I reported that at the conference, and so far it’s triggered at least half a dozen other such exercises, now under way, of calculations by people interested in schemes in their own area. I think there are about 20 for which such calculations would be possible and expect to see activity on this in the new year. The crazy thing, of course, is that such exercises should not be necessary at all. There is no good reason why National Highways, or the DfT, or planning inquiries in process, should not publish the results for all schemes in the current programme, worked out swiftly and exactly with information they already have, and open these up to examination. This would avoid the need for confusing arguments about errors in the short-cut methods – there certainly will be some (the changes will probably need to be bigger, as I have not yet taken into account carbon beyond 2050).
Arithmetical confusion
The new carbon values are an acceptance that the previous ones were too low. Even if it is argued they were right ‘at the time the calculations were done’, there is no doubt that they were too low to apply for the future years, from now to 2050 and beyond – which all currently proposed schemes depend on. And transparency requires that the public is entitled to know the results.
One sentence in my talk was the following: “One tonne of CO2 emitted this year, does 29 years of damage by 2050, so early reductions in carbon are much more powerful than late reductions.” This relates to a suggestion the Transport Planning Society’s Keith Buchan has been making since 2008, that carbon should be valued not in tonnes, but in tonne-years over which their effect on climate is relevant.
I find this a very attractive idea and am wrestling with what it implies for discounting and values: it might be a way to cut though the arithmetical confusion and work directly on the metrics that matter, and reinforces University of Leeds’ professor of transport and energy
Jillian Anable’s work on transport cost budgets, which give an indication of urgency: savings made soon are much more powerful than savings made later.
Meanwhile, I revert to my long-term irritation about the ways in which ‘measurement’ can distort, rather than clarify, importance. For years, congestion was said to cost the economy increasing figures of around £20bn a year, based on a clearly defined but utterly misleading calculation of multiplying the existing amount of traffic by the time they would spend if all vehicles travelled at the free-flow speed of roads, a clearly defined but utterly misleading quantity. Now, the dominant result of such calculations, using a different indicator, is by a commercial company Inrix, which gets exactly the same press coverage for its total of £6.9bn, and nobody – nobody at all – is saying how good it is that we have saved £13bn a year.
The numbers only really serve to colour-in a qualitative statement: congestion is important. By contrast, carbon impact has been ‘measured’ using an entirely different arithmetic, expressing the tonnes of carbon attributed to road schemes as a percentage of all the carbon emitted by everything in the whole economy, producing inherently small numbers, like 0.1%, or 0.01% (nobody cared which).
The numbers only really serve to colour-in a qualitative statement ‘carbon output from road schemes is insignificant’. The tables above come a little closer to comparing congestion and carbon on a similar basis. Except for the scale of consequences.
You can download my slide presentation for the conference if you want, and contact me by email if you’d like to do similar calculations for a scheme in your own ar.
References:
Phil Goodwin is Emeritus Professor of Transport Policy at UCL and UWE, and Senior Fellow of the Foundation for Integrated Transport.
This article was first published in LTT magazine, LTT836, 16 December 2021.
You are currently viewing this page as TAPAS Taster user.
To read and make comments on this article you need to register for free as TAPAS Select user and log in.
Log in