TAPAS.network | 22 January 2026 | Expert View | Ian Brooker
Strategic in Theory, Invisible in Practice: Freight Blindness in Transport Planning

Up to a quarter of traffic on the highway system is goods vehicles. Their economic value to the shippers and carriers – and the nation – is huge. Yet the attention freight gets in the transport planning process is inconsistent and incomplete says . He considers the reasons for this oversight and what should be done about it, looking at how, in major schemes like the A417 Missing Link and Lower Thames Crossing, freight is central to the narrative, but peripheral to the analysis.
Introduction – The Disconnect
Freight runs the economy, but you wouldn’t know it from reading most transport business cases. The recent approval of the Lower Thames Crossing has been framed as a victory for freight, yet it also reveals how uneven and poorly developed our understanding of freight actually is. At the other end of the spectrum, the A417 ‘Missing Link’ – a much smaller but nationally important scheme – mentions freight repeatedly, but barely analyses it. These are not anomalies. They are part of a pattern that has persisted across my thirty years working with local, regional and national government as a logistics advisor: freight is strategically important, yet operationally almost invisible. And this freight-blindness has consequences far beyond the schemes that reveal it.
The challenge of freight for transport planners has been recognised. For example, National Infrastructure Commission’s Future of Freight – Interim Report (December 2018) coined the phrase ‘freight blindness’. The report stated that both government and local authorities often have little understanding of why and how to plan for freight, leaving the needs of the freight system far down the priority list. Policymakers and planners are unable to take account of, or plan effectively for, the needs of freight.
The very welcome first ever national freight strategy, Future of Freight: A Long Term Plan (DfT 2022) had as one objective “raising the status of freight” across government and transport planning and acknowledged that freight has historically lacked a clear, joined-up framework and that policy, planning and data need upgrading.
It is encouraging that the new government has committed to updating the strategy, though details of its scope and content are not yet public.
Criticisms are also made of freight planning at a more local level. For example Transport for the South East – Freight, Logistics and Gateway Review (2020) found patchy and often weak treatment of freight in local transport plans.
Despite national strategies like Future of Freight, when you drill down into an individual road scheme (A417, A428, etc.), freight barely appears in the strategic case and is thinly modelled.
The same pattern recurs at every scale – strategy recognises freight, but projects rarely understand it.
One of the most persistent weaknesses in major transport projects is not the absence of freight expertise, but the way it is used: introduced early to satisfy scope requirements, then progressively squeezed as programmes tighten and priorities shift.
This is not a criticism of the many brilliant transport planners across the country, particularly those that I have worked with! They would be the first to say that they find freight ‘difficult’. This article considers the importance of freight, why freight is challenging, looks at a couple of highways project case studies to identify what’s missing, and then proposes some improvements.
Before looking at how these blind spots play out in real projects, we should remind ourselves why freight matters so profoundly – and why it is so difficult for the planning system to grasp.
Why Freight Matters
What distinguishes freight from passenger transport is not volume or mode – it is consequence. A delayed commuter is an inconvenience. A delayed HGV is a broken supply chain potentially affecting hundreds or thousands of people down the line. This distinction matters, because most of our planning tools – models, appraisals, consultations – are built around traveller assumptions: predictable demand, average journey times, segmented values of time. Freight is none of these things. It is volatile, commercial, time-critical and deeply sensitive to disruption.
At a national level, the logistics sector is a major part of the economy. In 2025 Logistics UK estimated that the logistics sector generates £170 billion for the UK economy annually. Efficient logistics are an important driver of economic growth. Another recent study, Effect of Freight Transport Service Performance on Global Market Competitiveness (Fikru, Eyakem (2021), finds that “freight transport service performance” significantly affects a country’s global trade competitiveness.
The aforementioned Future of Freight long term plan from 2022 repeatedly frames freight as a cross-modal national priority, and emphasises the need for a coherent national freight network.
The report Economic Role of National Highways (National Highways, 2024) meanwhile states plainly: “Road is the primary mode of transport for freight in the UK and is anticipated to remain so.” It stresses the need for reliable connections from ports/airports/railheads to “major settlements and national distribution centres”.
As a final example, Value of Road Freight Travel Time (DfT, 2025) well reported and analysed in LTT by Graham James in an article now also on TAPAS, contains the line: “the UK’s road network carries 81% of the country’s freight by distance-weighted volume. It is therefore the circulatory system that underpins economic activity and growth.”
So freight is important, is it not? We have to then ask why is it difficult to address its needs properly?
Why Freight Is Difficult
The key challenges are lack of data, heterogeneity, and dynamism.
Most movements on any transport network are cars/passengers. Millions of people making individual decisions on movement depending on who they are and where and why they are travelling. Segmenting those individual decisions out into a few typologies, transport planners have a sophisticated understanding of how decisions are influenced by mode, cost, and time. This is backed by masses of data, ranging from car and passenger counts to traffic surveys, census and land use planning data. Millions of pounds have been spent developing transport models that predict how different types of people will travel under various scenarios, including investment in roads or changes in train services, and calculating their journey times and real and imputed costs and benefits to the user.
As a result, key investment decisions are based on using these models to estimate appropriate economic costs and benefits. Other factors are important, such as consultation with affected parties and vast environmental statements, but it’s the business case that ultimately influences the strength of the argument for proceeding with a project or not.
Compared with passenger traffic, freight is far more challenging to model. This is because decisions on whether to move goods, where to move them to, and how to move them, are extremely complicated and fragmented. Fragmented in that not only do supply chain decisions differ by commodity (a truck of stone vs a truck of supermarket goods) they may also differ by shipper or carrier, nature of destination, time of day (or even time of year), movements in the markets for the contents, and the weather. Not to mention the users’ business models. Two supermarket chains may have significantly different supply chain strategies. Particularly now, the sector is always innovating and changing.
Harder still, freight includes the light goods vehicle sector – vans etc – which is growing rapidly, but about which there is even less useful data. Who knows what is inside all those white vans?
So freight covers everything from an articulated lorry trunking parcels down a motorway, through a skip on a truck heading to recycling, to an e-cargo bike making a last mile delivery to an office.
Perhaps the most difficult question to answer is also the most important: what is the economic value of the efficient movement of all this transfer of goods? This could range from just looking at employment and GVA for freight businesses, to assessing the economic activity generated, or simply acknowledging the opposite extreme: if there was no freight, the economy would collapse!
Freight Data
Data for passenger/car movements includes a wide range of sources from traffic counts, the census and surveys. For freight we have traffic counts – but they don’t provide detail on commodity or origin /destination (OD), and we have the Continuing Survey of Road Goods Transport (CSRGT) which populates various DfT statistical reports (e.g. Domestic road freight statistics, United Kingdom, DfT 2025). The CSRGT is very useful, but it is a high level survey. For example, CSRGT includes commodity carried, vehicle type, payload, and county level origin and destination of HGVs, but the sample size is too small to cross reference any of these values.
CSRGT data is used by the Great Britain Freight Model (GBFM) (Great Britain Freight Model version 5 – 2022, DfT 2022) which forecasts overall freight demand and high level OD flows of HGVs and rail freight. The GBFM informs regional traffic forecasts, but by that stage this is simply provided as a range of growth factors.
For rail freight data the situation is different in that every train is tracked and its contents known. For road movements a wealth of data exists within private sector freight businesses, including increasingly sophisticated supply chain planning and tracking models. Generally, of course, that data is not available publicly.
Freight Modelling
The heterogeneity of freight makes it very difficult to come up with useful values for transport models such as a Freight Value of Travel Time. The challenges were well explained by Phil Goodwin in his commentary for LTT and now on the TAPAS Network The deep flaws in how we model freight https://tapas.network/55/goodwin.php and by John Siraut in his LTT/ TAPAS Network commentary: UK Goods movement and freight traffic flows – a key transport activity deserving greater understanding https://tapas.network/53/siraut.php. Both were published in April 2024.
Phil Goodwin pointed out that “freight and logistics are highly dynamic sectors of our modern economy, and yet, most surprisingly, are not treated as such in transport planning analysis.”. Whatever infrastructure is proposed, the volumes of freight in a model don’t change, nor do assumed origins and destinations for freight. In reality, infrastructure changes do materially impact supply chain decisions such as the delivery network.
Goodwin calls for new research to: “develop a better, measurable, understanding of the nature of these variable demand responses, adapt modelling tools to cope with them, and thereby improve the economic, social and environmental appraisal of changes in infrastructure projects and policy.” He points out that businesses themselves have a sophisticated understanding of their supply chains through “detailed, elaborate, evidence-led models of the distribution of goods”.
As a final piece of evidence, current transport appraisal counter-intuitively assigns a very low value to freight travel time – effectively just the value of the driver’s time. There is no value assigned to the travel time of the goods on a lorry. This anomaly was at last addressed as the DfT recently attempted to provide better understanding of the freight value of time (The Value of Road Freight Travel Time, DfT, October 2025). Unfortunately the original approach used (Stated Preference) was not very helpful in identifying detailed values, but the report did at least propose significant increases to the value of time for freight based on some of the survey findings combined with other industry sources.
So at a national level, the Great British Freight Model mentioned earlier has proved to be a useful ‘top down’ model of freight demand, modal share, and routing. This is used to produce freight traffic forecasts by road type and region which are key inputs into transport models. The DfT is working on a modernised freight model. I sympathise with the challenge! The DfT has recognised the challenges of freight and has commissioned research into the economic value of freight and, as referenced above, the value of travel time for freight.
I do, however, sometimes wonder how useful these economic models of freight can actually be. Alternative, arguably better, approaches would include adapting private sector logistics models, or developing ‘bottom up’ models on a commodity by commodity basis.
Two Case Studies
To examine more closely how the theory, practice and consequences of what I have been describing here play out in real transport planning situations, I have taken a more detailed look at two current case studies.
These have been chosen not as a criticism – they simply illustrate the features of typical existing approaches.
A417 Missing Link
I’ve chosen this as an example of a relatively small but strategically significant investment, addressing a poorly performing gap in an otherwise high quality link route.
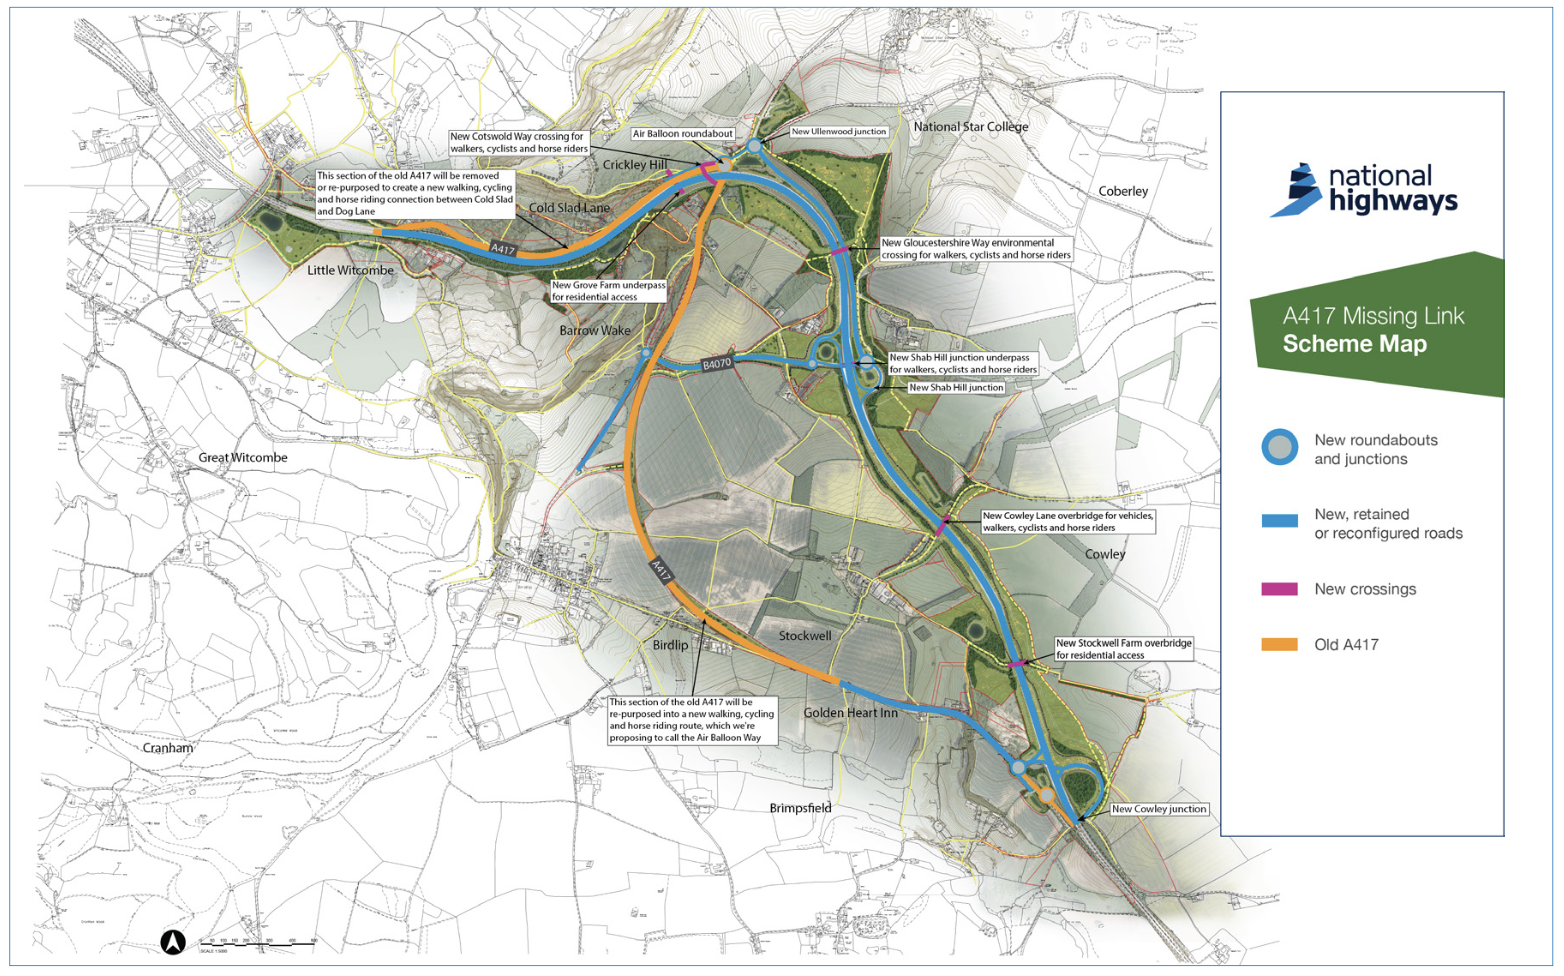
Figure 1: A417 Missing Link - National Highways
As many readers will know, this proposal addresses the single carriageway gap in the otherwise dual carriage way A417/A419 route that links Gloucestershire, and other areas, to the South and cities such as Reading. The link will provide 4 miles of new dual carriageway connecting the existing A417 Brockworth bypass with the existing A417 dual carriageway south of Cowley. The current route includes a section of 10% gradient which will be eased under the new scheme to 8%.
Throughout National Highways’ documentation for the Development Consent Order application there is emphasis on the key role the corridor plays for freight. For example: “The route serves an essential role, connecting the ports and airports of the south-east to the west Midlands, mid and north Wales, and north-west England.” (National Highways Full Business Case). The documents talk about the various freight routes linked together by the corridor, and about the impact of the hill on reliability and HGV trips.
Within the business case it is difficult or impossible to see how this strategic freight role is reflected in the numbers. Freight benefits are not separated from non freight benefits. ‘Business User Benefits’ are mentioned, but include both business car users and freight. The Wider Economic Impacts of the scheme are assessed using the DfT’s WITA tool TAG Unit A2.1. As I understand it WITA, first published in 2019 and revised in May last year, mainly estimates the agglomeration benefit (of businesses and communities being closer together) without direct reference to freight.
The project went through several extensive rounds of consultation, but these were aimed at local residents and people or businesses impacted by the project. I could not find any evidence of direct engagement with likely business users of the link, nor the wider logistics sector. The numerous mentions of freight in the consultation exercise all concerned the ‘problem’ of extra freight traffic, notably whether HGVs should be required to use the crawler lane on the new hill.
The scheme had a strong BCR and broad local support and is being built, so does this matter?
I think so. Shouldn’t we learn from our experiences? The issue is that freight features strongly in the narrative, faintly in the modelling, and almost disappears by the evaluation stage. Taking more account of freight and freight benefits might have strengthened the economic case for the link, but more importantly it might have resulted in a scheme the detail of which takes more account of freight needs. For example, a decision was made to increase the gradient on the new link from 7% to 8%. Clearly this has impacts on HGVs and, potentially, on resilience.
A417 is not an anti-freight scheme – it is just yet another ‘freight-blind’ one.
Lower Thames Crossing (LTC)
This new strategic link, downstream on the Thames between Essex and Kent, may be controversial because of its huge cost and impact, but to logisticians it could be seen as meeting an obvious need. The Channel crossings via Dover and the Channel Tunnel handle around half of all UK trade to and from the EU, but the key route from the Channel ports to the main UK logistics hubs and population centres is dependent on a single Thames crossing point on the M25 at Dartford. Actually designated as the A282, this now comprises three companion crossings. The first tunnel opened in 1963, followed by the second in 1980, and the Queen Elizabeth II Bridge in 1991. This current capacity, though extensive, is intensively used and highly vulnerable to congestion and disruption.
I should acknowledge that I was involved in this new project, delivering a small report for LTC looking at the economic impacts on the freight sector. So I know that National Highways did make significant efforts to understand freight impacts.
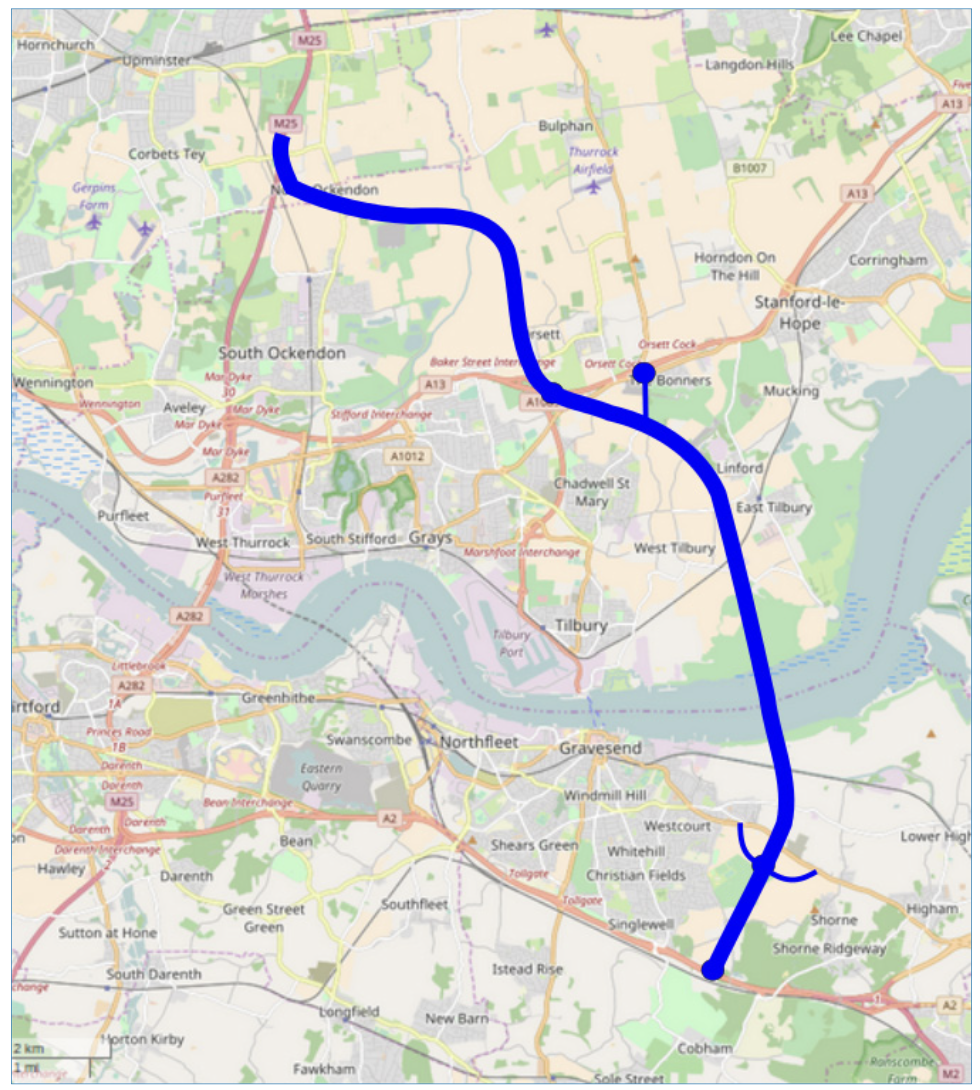
Figure 2: The planned route of the Lower Thames Crossing
Freight is mentioned profusely in all documents justifying the need for LTC, including supportive video interviews with key freight decision makers from major businesses such as Asda. Heavy and light goods vehicles currently represent 25% of journeys through the crossings at Dartford, and this is predicted to rise to 34% by 2041, indicating the importance of the new crossing to businesses and freight. The LTC is also important for local freight – opening up journeys between Kent and Essex, and avoiding the gridlock that impacts extensive areas both sides of the Thames when any of the Dartford Crossings are unavailable.
The business case refers to a survey that found that 73% of business respondents said that traffic congestion at Dartford affects their activities. Approximately 60% thought their enterprises would grow, and almost 50% said that they could employ more people if the problem of congestion at the crossing were to be addressed.
By any measure, this is a significant freight project.
In the Business Case the strategic case mentions the importance of freight. The economic case provides a breakdown of the direct benefits of the scheme, the vast majority of which are down to business user benefits – again, the proportion of this which falls to freight users is not explicitly stated. Wider Economic Benefits increase the value of benefits by a significant 37% to 50%. The WITA approach was used, and as mentioned earlier, therefore potentially freight agglomeration benefits have not been considered.
Alongside the conventional WebTAG appraisal, the Lower Thames Crossing business case refers to a “complementary appraisal” using Spatial Computable General Equilibrium (SCGE) modelling and advanced econometrics, intended to capture the project’s wider or ‘transformational’ economic impacts. While SCGE methods are increasingly used to explore economy-wide effects beyond standard transport benefits, the published documentation does not clearly explain how freight movements, logistics costs or supply-chain behaviour were represented within this modelling. I can’t find any information on the SCGE modelling, which is part of the challenge!
My own involvement was to work alongside an economist to test the proposition that LTC would transform supply chains in the region and hence create growth. We interviewed logistics businesses, property developers, and regeneration agencies. Most agreed that LTC would reduce the impact of the Thames as a barrier to logistics, ultimately leading to amalgamation of distribution hubs either side of the river. But quantifying the benefits was complicated by the challenge of getting decision makers to think through a new post-LTC paradigm, and by the need for suitable investment in feeder roads between the crossing and development sites which would not be part of the LTC project.
So in the case of the LTC, the importance of freight was recognised, and the project team went to some length to understand the impacts and benefits for freight. However, the modelled freight benefits are, again, hard to see in the business case, and the truly transformative impacts of the scheme as far as freight is concerned could not be quantified.
Again, the scheme is approved, and set to be built, (if the government can find the money!) so does this matter? Again I certainly think so.
Firstly, a scheme of this significance for freight should surely be able to clearly identify the freight benefits and impacts. Secondly, could better understanding of freight have resulted in a different design? For example, a link from LTC to the Port of Tilbury was dropped from the scheme. This was presumably to reduce cost, but could undermine some of the freight benefits. Would there have been a different design if freight impacts were better understood?
In addition, perhaps there should be proper consideration of whether some kind of priority for freight vehicles could be built into the scheme, for example dedicated lanes or junction management technology, to protect capacity for its major intended users.
Freight, the missing system capability
This article has hopefully shown that freight is not marginal to the transport system, nor is it absent from national policy. Government strategies, National Highways documents and industry evidence consistently recognise freight as central to economic performance and network purpose. Yet at project level – where schemes are designed, appraised and delivered – freight remains weakly understood and inconsistently treated. The result is not hostility to freight, but something more subtle and persistent: a planning system that is well equipped to represent passenger travel, but poorly equipped to understand supply chains.
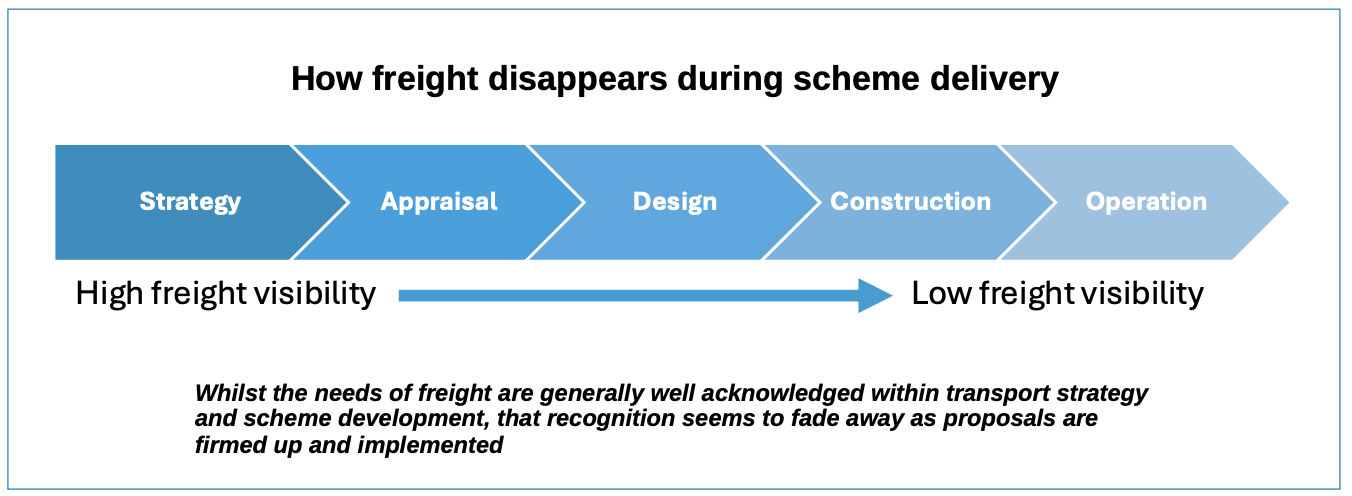
Freight considerations, as the diagram above seeks to represent, are often recognised at strategy and appraisal stages, but become progressively less visible as projects move into detailed design, construction and operation. The most significant impacts on freight – reliability, disruption and diversion – typically emerge at these later stages.
The case studies illustrate this clearly. In the A417 Missing Link, freight appears frequently in the objectives narrative, but rarely in the analysis, and is almost entirely absent from consultation and design decisions beyond basic traffic modelling.
In the case of the Lower Thames Crossing, freight is central to the justification for the scheme, and sophisticated modelling has been deployed to capture wider economic impacts – yet it remains unclear how freight behaviour and logistics decisions were explicitly represented within that analysis, or how far freight considerations shaped downstream design and operational choices. These are not anomalies. They are symptoms of a significant wider structural issue.
Two more specific action points are worth identifying too.
a) Reliability is crucial for freight, but overlooked
One consequence of this freight-blindness is that reliability and disruption – the aspects of the network that matter most to freight – are consistently overlooked or undervalued in overall modelling and appraisal practice. Appraisal frameworks focus on average journey times under normal operating conditions, while freight businesses experience the network through variability, unplanned closures, diversion routes and incident recovery. Yet the cost of significant unreliability is rarely captured explicitly in business cases, and almost never treated as a core project challenge.
b) Vital freight sector expertise and input is marginalised
Freight expertise is commonly commissioned early in scheme development to inform strategic appraisal, but then treated as a discrete task rather than a continuous project capability. By the time freight problems become visible, key design and operational decisions have usually already been locked in.
A more freight-literate planning system would not require perfect data or ever more complex models. It would require a clearer understanding of how freight actually uses the road network, a willingness to treat disruption and resilience as critical outcomes, and a commitment to retaining freight-aware capability throughout the life of a project team. Without that shift, freight will continue to be recognised in policy but undervalued in practice – and the costs will continue to be borne quietly by businesses – and the national economy - rather than visibly by the project sponsors.
So what would a freight-literate planning system look like?
I’ve already mentioned that the DfT has proposed to increase freight values of time, and that research has been commissioned to refine TAG methodologies and provide more comprehensive appraisal of road freight-related economic impacts, explicitly to strengthen transport investment business cases.
But I’ve also described how modelling of freight can be challenging, and cannot be relied on as meaning that freight needs and opportunities have been fully accounted for. More needs to be done – and some of this can be implemented quite rapidly.
Rather than a long list, my recommendations in this regard are best understood as four linked pillars, moving from diagnosis to delivery.
1. Treat improved journey reliability as a core outcome of new investment
If there is one area where freight-blindness has the greatest real-world cost, it is the treatment of disruption. Major transport projects are typically appraised as if the network always operates normally, yet freight businesses experience the system most acutely when it does not do so: during incidents, roadworks, unplanned closures and poorly functioning diversion routes.
Appraisal frameworks and project objectives should therefore place greater emphasis on reliability, resilience and recovery – not simply on average travel times. This could include explicit consideration of the economic costs of major delays, the suitability of diversionary routes for freight vehicles, and the speed of incident clearance on freight-critical corridors. These are not peripheral issues just for freight users; they are central to how the network supports economic activity.
2. Operationalise continuous freight recognition through a ‘freight visibility’ scorecard
Freight input in schemes should not be treated as a one-off analytical task, confined to early appraisal stages. Instead, a freight understanding capability needs to be embedded throughout the project lifecycle, alongside traffic engineering, operations and asset management. One practical way of achieving this would be through the use of a simple freight ‘visibility scorecard’ applied at key project gateways.
Such a scorecard would not replace modelling or appraisal, but would act as a prompt and accountability tool, asking whether freight demand, reliability risks, diversion routes, construction impacts and operational arrangements have been explicitly considered and signed off. By making ‘freight visibility’ a recurring requirement, rather than an early-stage assumption, a scorecard approach would help ensure that freight considerations are not progressively squeezed out as projects move from strategy to delivery (see panel below).
Having such a scorecard would act as a prompt and accountability tool, asking whether freight demand, reliability risks, diversion routes, construction impacts and operational arrangements have been explicitly considered and signed off. By making ‘freight visibility’ a recurring requirement, rather than an early-stage assumption, a scorecard approach would help ensure that freight considerations are not progressively squeezed out as projects move from strategy to delivery.
3. Adapt the TAG system to ensure freight visibility in appraisal
Freight is often represented in business cases only indirectly, through HGV proportions of overall traffic, or generic business user benefits. Where freight is economically significant for any scheme, it should be treated more explicitly.
A careful look at the way freight is treated across the whole DfT Transport Analysis Guidance documentation is needed.
This does not require abandoning WebTAG, but it does require greater clarity and transparency about how freight benefits are identified, valued and tested. Simple tools – such as the freight visibility scorecard – could help ensure that freight demand, reliability risks and operational constraints are systematically considered, rather than disappearing as projects move from strategy to delivery.
4. Reflect the needs of freight in Design and Operations
Finally, project design – and network management too – should reflect the way freight actually experiences the road network. This includes greater attention to diversionary route quality, rest and recovery facilities, and real-time information during incidents and closures. In many cases, relatively modest investment in resilience and operational performance may deliver greater freight benefits than large-scale capacity enhancements.
My final point is to stress that this article should not be seen as an argument for more road building. It is a plea for better understanding of a key category of traffic, and how it is catered for within transport policy, in the wider national interest.
What is a Freight Visibility Scorecard?
A freight visibility scorecard is a simple, light-touch tool to be used at key stages of a transport project to ensure that freight considerations remain visible from appraisal through to delivery.
Rather than replacing modelling or formal appraisal, it acts as a prompt and accountability check, asking whether freight demand, reliability and disruption risks, suitability of diversion routes, construction phasing impacts, and operational recovery arrangements have been explicitly considered and signed off.
Applied at project gateway points, a scorecard helps prevent freight issues being addressed early and then progressively squeezed out as schemes move towards detailed design and construction. Its purpose is not to add process, but to make a known blind spot harder to ignore.
Freight Visibility Scorecard – core prompts
-
Freight capability – Is freight expertise identified and retained throughout the project lifecycle?
-
Role of freight – Is freight understood as supply-chain activity, not just traffic?
-
Reliability & disruption – Are variability, incidents and closures treated as economically significant?
-
Construction impacts – Are freight impacts during construction and transition considered early?
-
Diversion routes – Are diversion routes suitable for freight in practice, not just in theory?
-
Operations & monitoring – Are freight impacts reflected in operational objectives and KPIs?
References and Links
The data reviewed in this article and charts can be found at:
Department for Transport (2018). Future of Freight: An Interim Report. National Infrastructure Commission.
https://www.ukwa.org.uk/wp-content/uploads/2019/01/Future-of-Freight-Interim-Report-2.pdf
Department for Transport (2022). Future of Freight: A Long Term Plan.
https://assets.publishing.service.gov.uk/media/62b9a2ec8fa8f53572e3db68/future-of-freight-plan.pdf
Department for Transport (2025). The Value of Road Freight Travel Time.
https://www.gov.uk/government/publications/value-of-road-freight-travel-time
Department for Transport (2024). Transport Analysis Guidance (TAG): Unit A2.1 Wider Economic Impacts.
https://www.gov.uk/government/publications/webtag-tag-unit-a2-1-wider-economic-impacts
National Highways (2024). The Economic Role of National Highways.
https://nationalhighways.co.uk/media/h5vdavdy/role-3-jan-24_clean_v2-fin.pdf
Transport for the South East (2020). Freight, Logistics and Gateway Review.
https://transportforthesoutheast.org.uk/app/uploads/2020/11/Freight-logistics-and-gateway-review.pdf
Goodwin, P. (2024). The deep flaws in how we model freight. TAPAS Network.
https://tapas.network/55/goodwin.php
Siraut, J. (2024). UK goods movement and freight traffic flows – a key transport activity deserving greater understanding. TAPAS Network.
https://tapas.network/53/siraut.php
James, G. (2025). Revised values of travel time savings for road freight: what the new TAG says - and what it could mean
https://tapas.network/103/james.php
Logistics UK (2025). The Economic Value of Logistics.
https://logistics.org.uk/media/press-releases/2025/june/uk-s-170-billion-logistics-sector-is-unsung-hero-o
National Highways (2023). A417 Missing Link Full Business Case.
https://assets.publishing.service.gov.uk/media/649d6dbb06179b00113f7530/national-highways-a417-missing-link-full-business-case.pdf
National Highways (2024). Lower Thames Crossing Development Consent Order and Business Case documentation.
https://nationalhighways.co.uk/our-roads/lower-thames-crossing/news-and-media/document-library/dco-documents/
DfT (2022) Great Britain Freight Model version 5 – 2022 updates
https://www.gov.uk/government/publications/great-britain-freight-model-version-5-2022-updates
DfT (2025) Domestic road freight statistics, United Kingdom: 2024 Updated 9 July 2025
https://www.gov.uk/government/statistics/road-freight-statistics-2024/domestic-road-freight-statistics-united-kingdom-2024
Ian Brooker is Director of Polaris Logistics Consultancy. His career spans rail freight business development in the 1980s and more than 35 years advising the public sector and logistics businesses on freight demand and economics, rail freight and urban logistics.
This article was first published in LTT magazine, LTT930, 22 January 2026.
You are currently viewing this page as TAPAS Taster user.
To read and make comments on this article you need to register for free as TAPAS Select user and log in.
Log in