TAPAS.network | 13 December 2023 | Commentary | John Siraut
ORR reveals huge new rail origin-destination data matrix

In a surprise move, the Office of Rail and Road has published a major new data resource about rail travel. TAPAS's regular contributor of analysis of transport statistical information, , takes an initial look at what is available, and what it reveals
AS REPORTED in the issue of LTT magazine, (LTT882), in a welcome and unexpected development, the Office of Rail and Road has made publicly available the full 2021-22 rail origin and destination matrix which underpins two annual datasets that it regularly publishes – its Estimate of Station Usage, and its Regional Rail Usage. This was done without explanation or fanfare, but is a significant and valuable step. Click on the quality of data tab, and it gives itself 4.75 out of 5.
This is a massive dataset providing an estimate of the number of journeys between each pair of stations on the network, roughly a 2500x2500 matrix. And we must emphasise ‘estimate’ as the journeys are not monitored but assessed from ticket sales data, and involve a series of assumptions, - such as the frequency of use of season tickets - and are also impacted by the increasing use of split ticketing. There are also issues of data interfaces with rail activity covered by tickets sold and used within the major metropolitan transport authority areas, and especially Transport for London
The dataset reports an equal number of journeys between stations A to B as in the direction of B to A. There are therefore a possible 3.25 million unique station to station flows but over 2.5 million have had no journeys recorded between them.
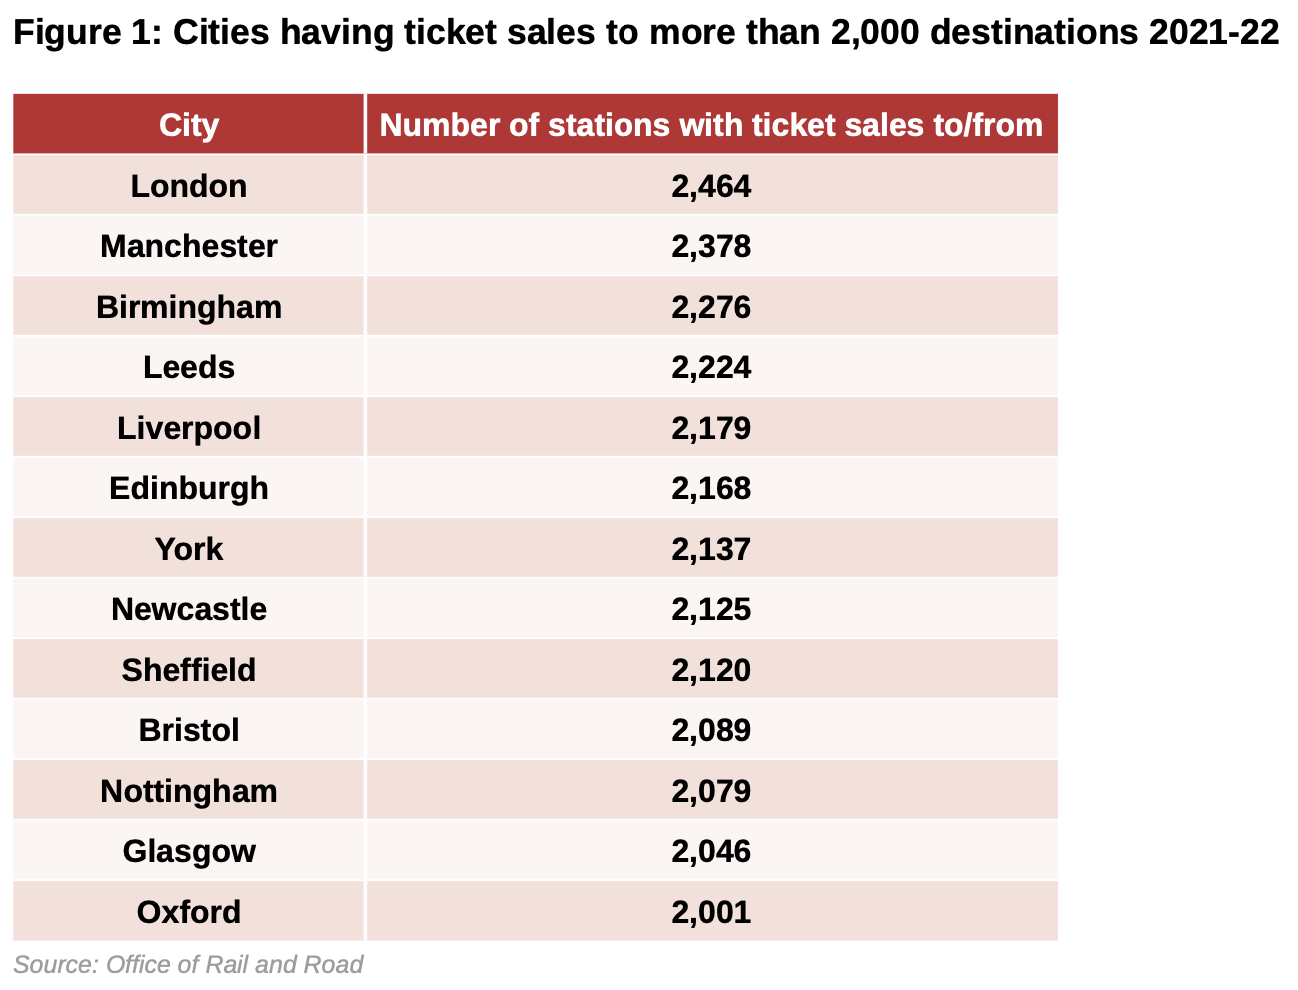
However, for our major cities the dataset indicates most had recorded trips to over 80% of stations across the network, as can be seen in figure 1. Not surprisingly, London comes top of the list but Manchester was not far behind and 14 cities recorded journeys to more than 2,000 stations on the network.
The inter-city routes from London with the most passengers are set out in figure 2. It is notable that London to Manchester outperforms London to Birmingham even though three different operators compete on the latter. London to Edinburgh is almost three times the size of the London to Glasgow market. Meanwhile the number of journeys to Leeds and Liverpool are broadly comparable in size despite the former having twice the rail frequency of service of the latter.
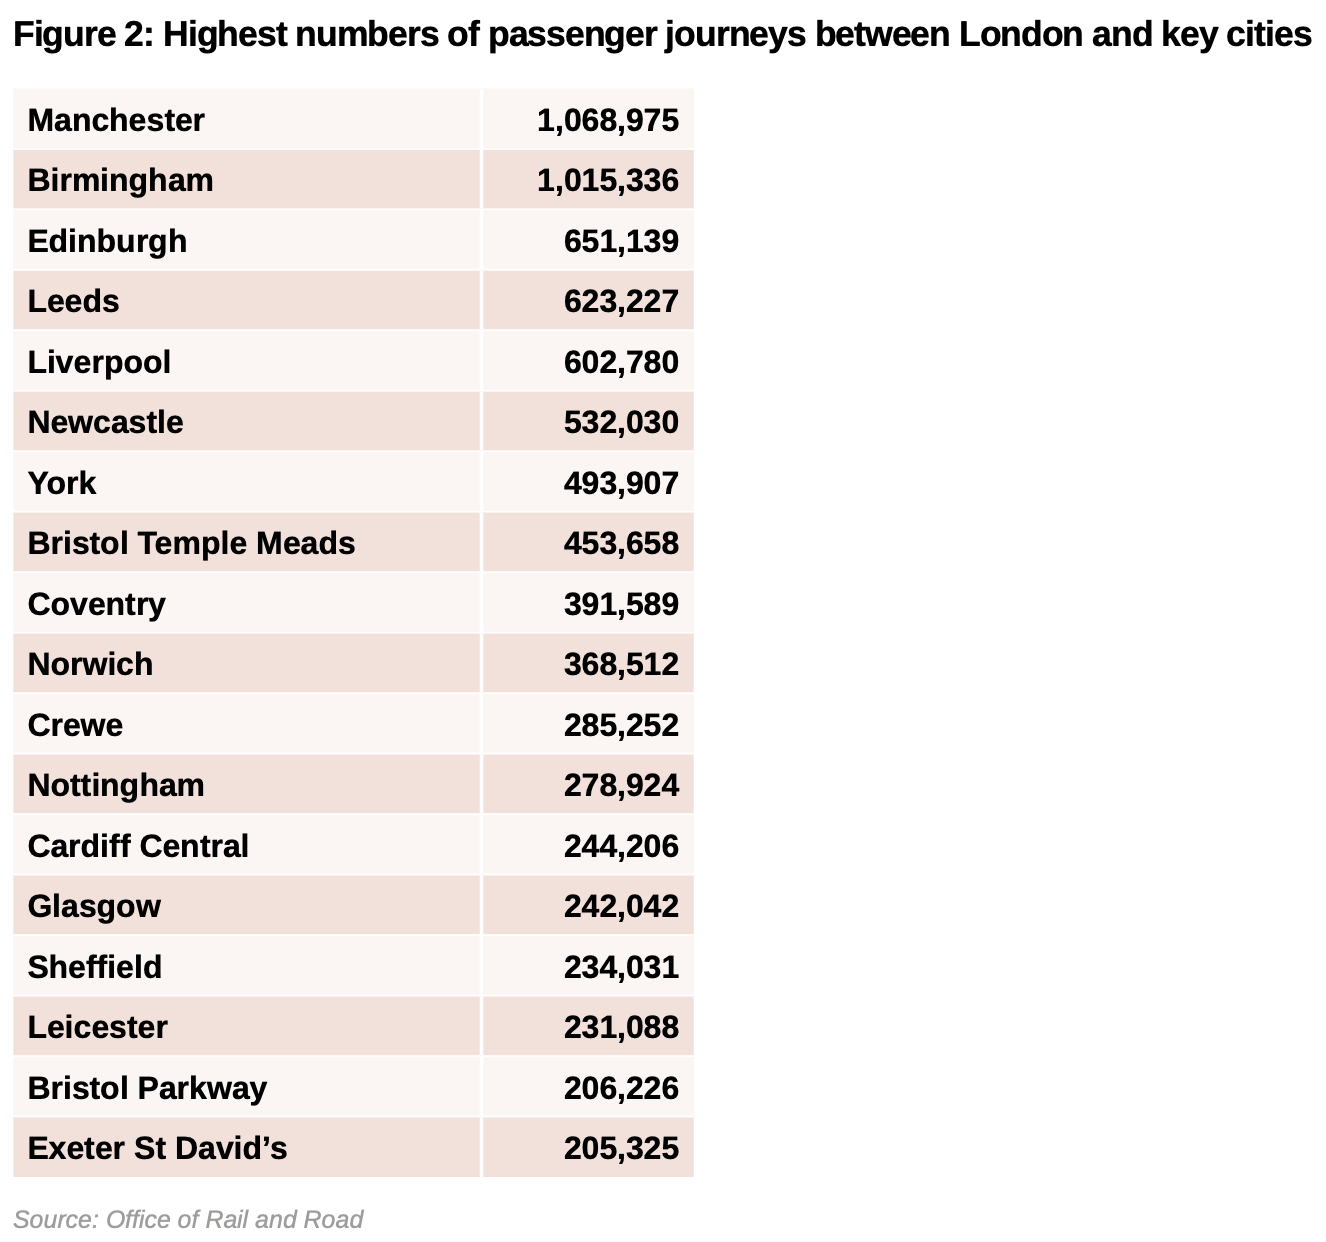
Figure 3 shows the largest flows on journeys of greater than an hour outside London. This partly reflects some slow journey times rather than real long-distance routes. Far higher journey flows are achieved on city- to- city flows between northern cities which are less than an hour apart.
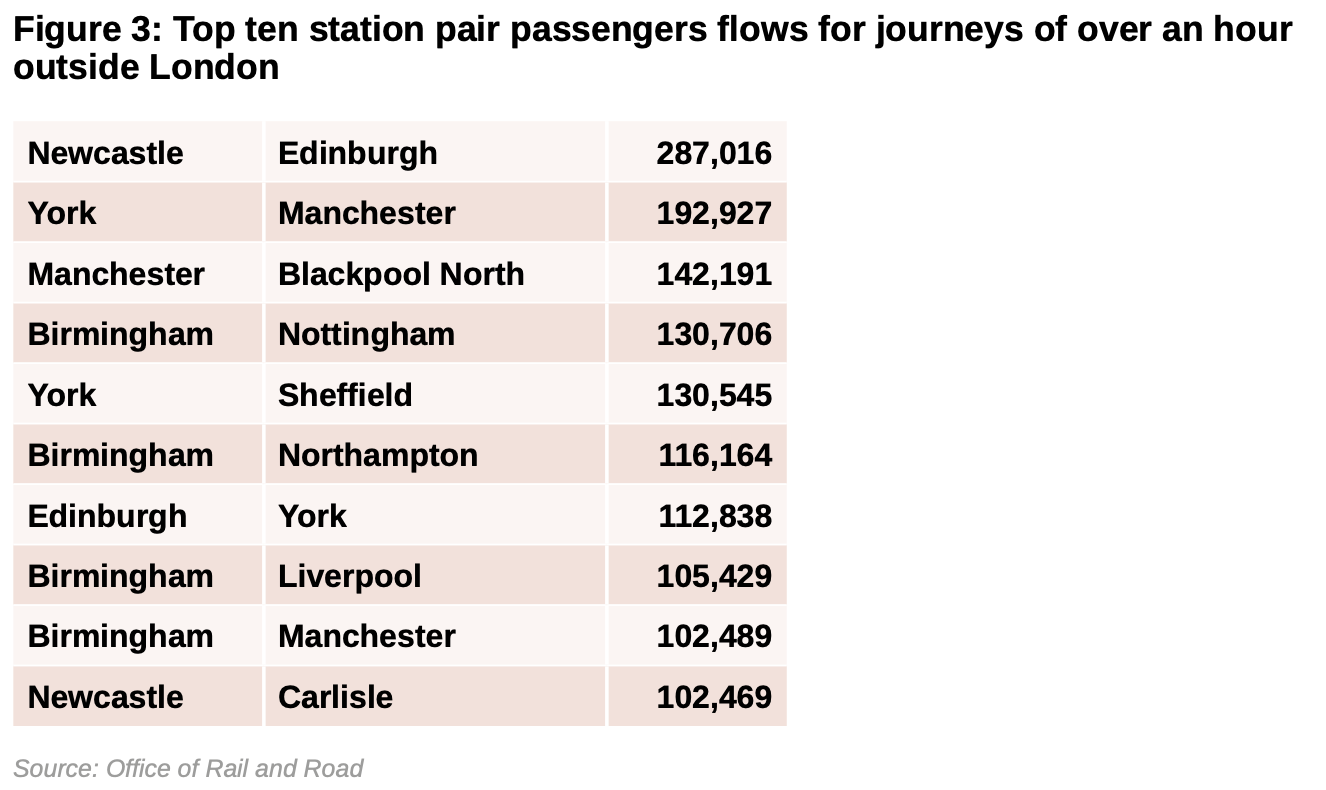
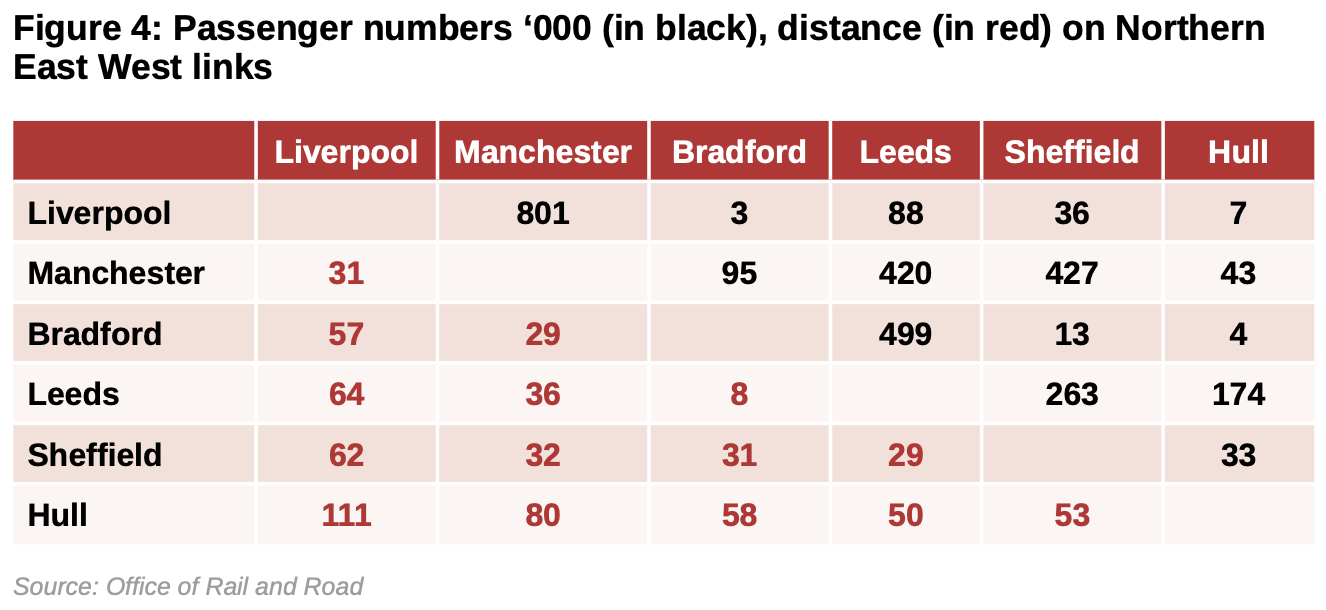
Figure 4 interestingly considers the size of the TransPennine market which is the focus of the Northern Powerhouse Rail scheme. The figures in black are the number of passenger journeys in thousands and those in red, the distance between the cities in miles. The market is dominated by Liverpool to Manchester with over 800,000 journeys (although it is notable that this is smaller than the numbers travelling between London and Manchester). Slightly more people travel between Manchester and Sheffield than Manchester to Leeds which probably reflects the poor road connections on the former route.
The very low passenger numbers travelling to Bradford from Liverpool and Hull doubtless reflects the city’s poor rail service and the reason for its lobbying for a new station to be served by faster and direct TransPennine services.
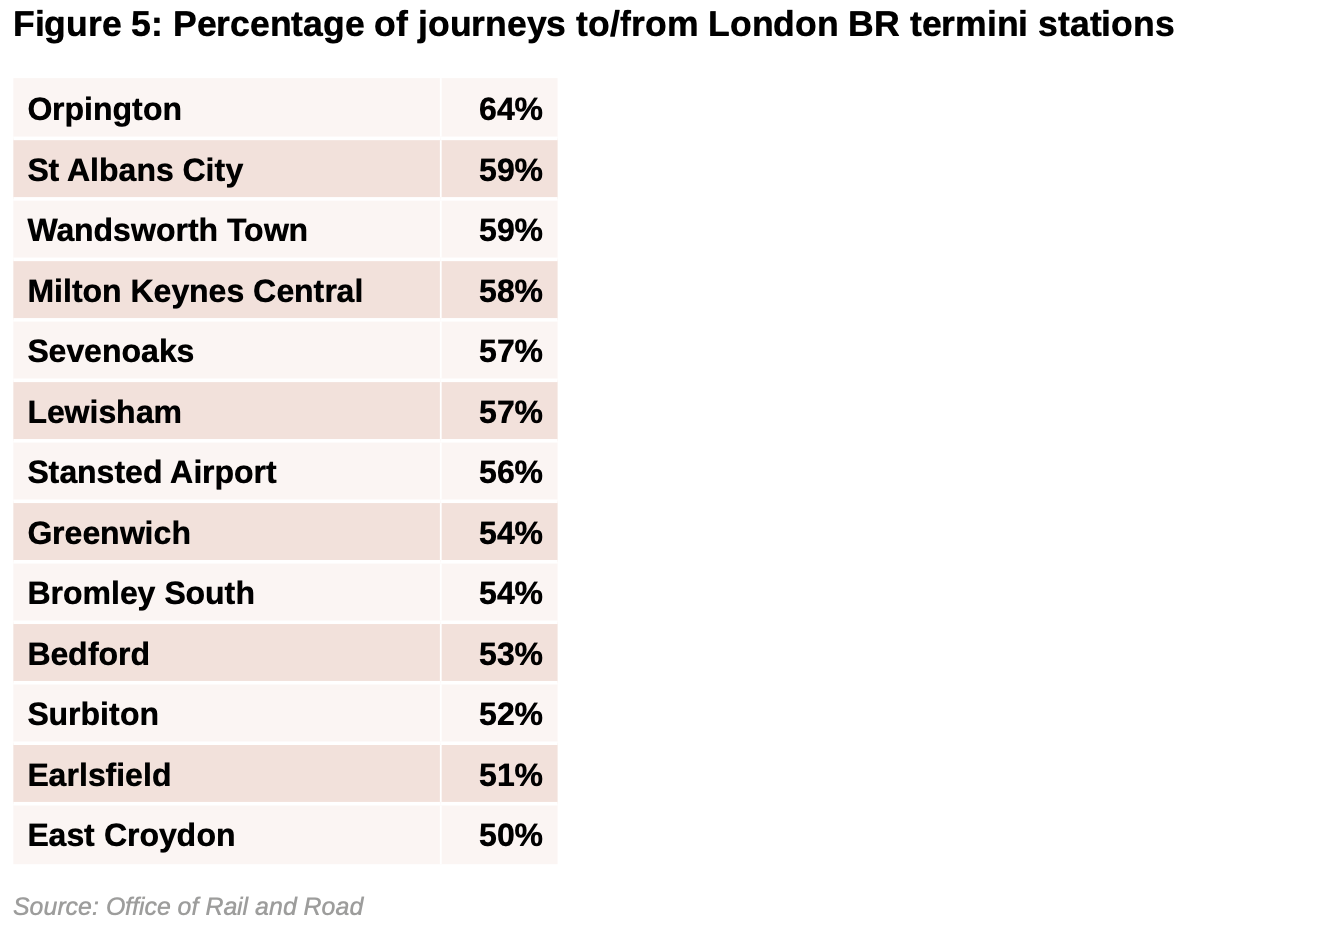
The dataset reveals that many stations in the London area and wider South East are dominated by flows into central London. Figure 5 shows for those stations used by more than 1 million passengers the percentage of trips to London BR stations (that is, Blackfriars, Cannon Street, Charing Cross, City Thameslink, Euston, Fenchurch Street, King’s Cross, Liverpool Street, London Bridge, Marylebone, Moorgate, Old Street, Paddington, St Pancras, Vauxhall, Victoria, Waterloo, and Waterloo East). In all cases over 50% of journeys are to these central London stations. For smaller London stations the figure reaches over 90%.
Finally, figure 6 compares flows from Glasgow and Edinburgh to Scotland’s major cities. Over 800,000 journeys were made between these two cities themselves. Edinburgh is by far the biggest market for trips to Aberdeen, Dundee and Inverness, while Glasgow is the biggest market for trips to Perth and Stirling.

The dataset indicates that there were 29 journeys that possibly made full use of Britian’s longest daily train journey between Penzance and Aberdeen, but only three journeys between Penzance and Inverness, and two to Fort William.
It’s good to see greater transparency in the rail sector, as provided with this data, which should hopefully lead to more informed discussion about rail’s role in the British transport market. There are other issues that might usefully be also addressed in terms of both improved rail data collection, and publication, but this at least makes a welcome start.
John Siraut is director of economics at Jacobs.
This article was first published in LTTmagazine, LTT882, 13 December 2023.
You are currently viewing this page as TAPAS Taster user.
To read and make comments on this article you need to register for free as TAPAS Select user and log in.
Log in