TAPAS.network | 6 February 2023 | Commentary | Greg Marsden
The route to Net Zero: DfT assumptions look well off course

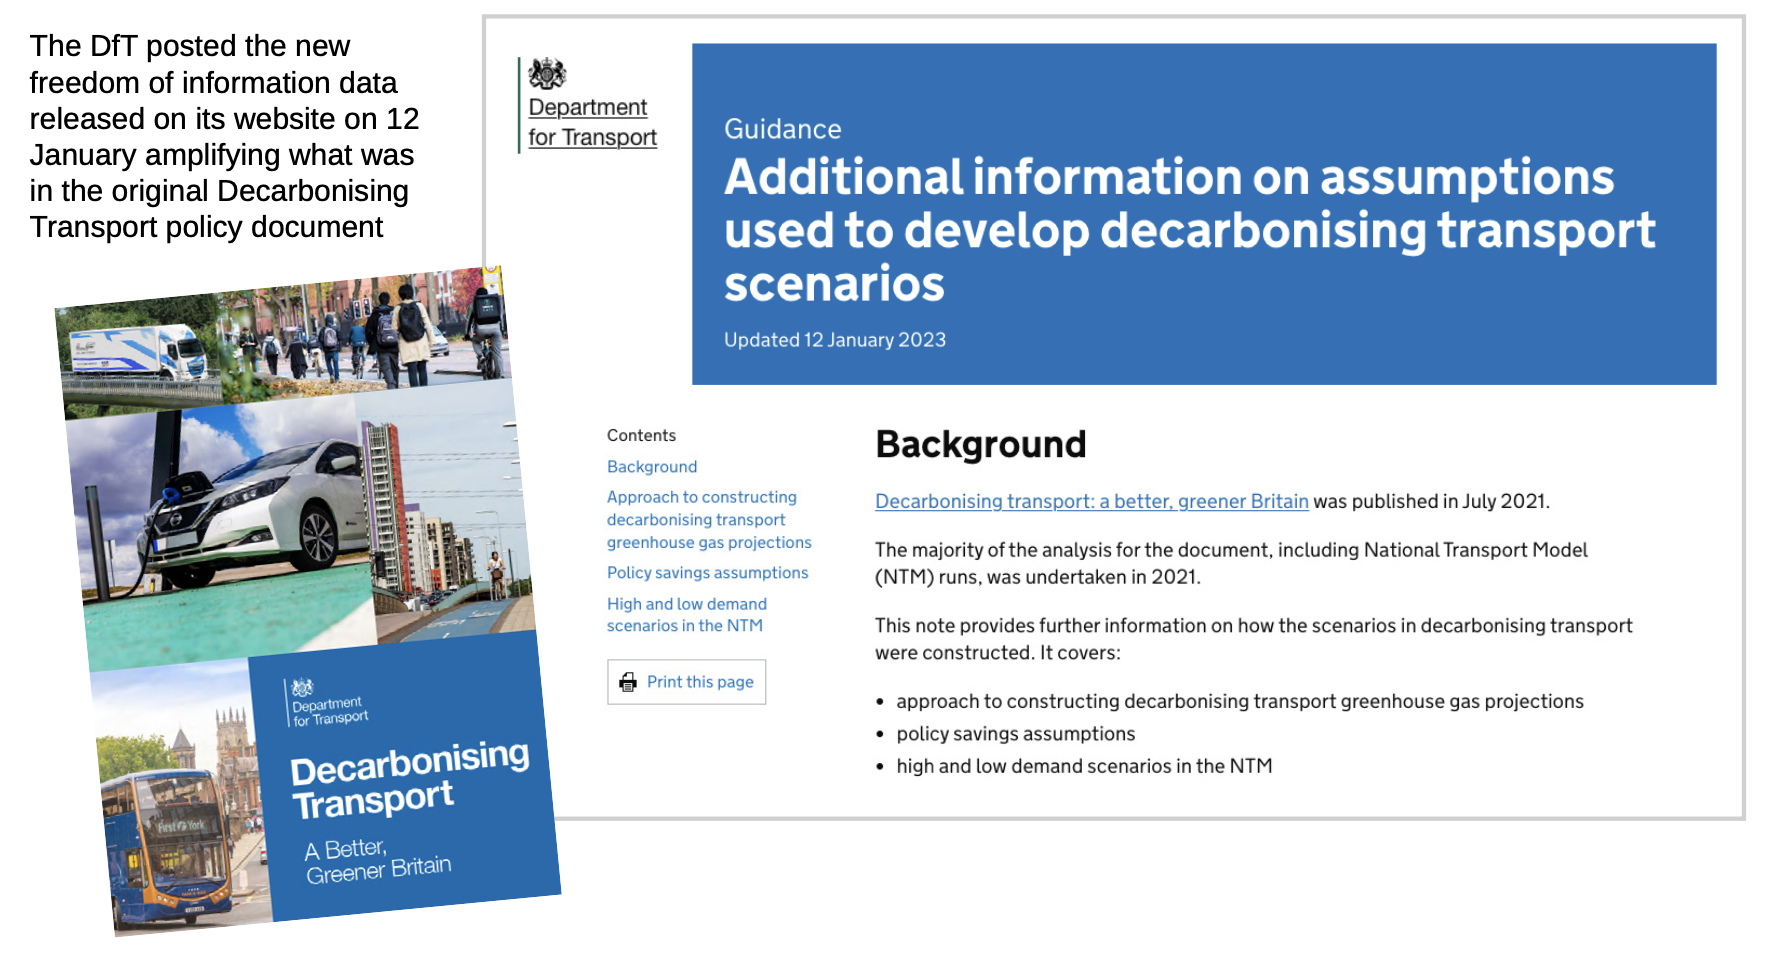
Last month a Freedom of Information release was finally made by the Department for Transport with details of the calculations underpinning the Government’s transport decarbonisation plan. It followed Professor having fought long and hard to get the information. From an initial look at the material, we asked him : what does it tell us?
THE GOVERNMENT'S policy document Decarbonising Transport: A Better, Greener Britain – published in July 2021 set out, in its own words, “the government’s commitments and the actions needed to decarbonise the entire transport system in the UK.” It included, again in its own words:
-
“our pathway to net zero transport in the UK
-
the wider benefits net zero transport can deliver
-
the principles that underpin our approach to delivering net zero transport”
The plan followed on from Decarbonising Transport: Setting the Challenge, published in March 2020, which laid out the scale of additional reductions needed to deliver transport’s contribution to legally binding carbon budgets and delivering net zero by 2050.
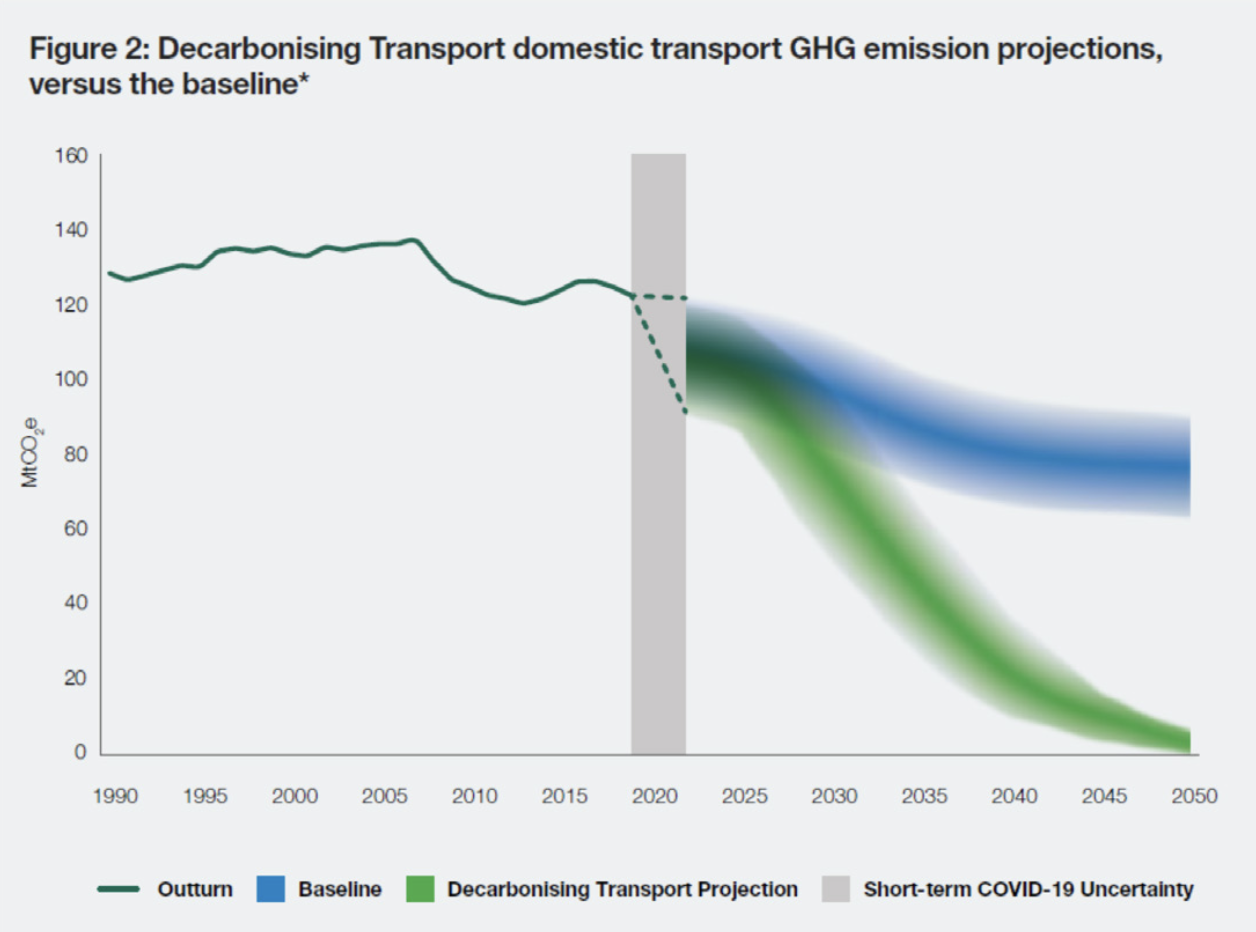
A now famous graph in the 2021 document (reproduced below) plotted two carbon reduction trajectories (in fact wedges!) – one without actions to cut them as needed, and the other showing how the government planned they should fall. What it didn’t explain was how the falling curves would be achieved and how they related to what was included in the Plan. The data that has now been released provides, for the first time, some of those underpinning assumptions.
HOW THE GOVERNMENT’S 2021 TRANSPORT DECARBONISATION PLAN PRESENTED THE PATHWAY TO NET ZERO IN 2050
Having examined what it contains, here are my principal deductions and observations so far:
1) Traffic and Transport Behavioural Factors
Firstly, in order to track the most ambitious edge of the Transport Decarbonisation Pathway requires some pretty fantastical assumptions about transport and travel activity in the next twelve years. By 2035, according to those assumptions the DfT has made, traffic levels would be 233 billion miles per year, apparently achieved by a combination of tracking a low trip rate scenario, with the impacts of high fuel prices and low GDP (which Government policies are both seeking to avoid), coupled with further substantial reductions in trip rates from those prompted by Covid which carry forward. This is more aggressive than the one-off Covid adjustment of a 5% continuing reduction in traffic deployed in the recent road traffic projections.
Achieving the 2035 figure included in that DfT trajectory would in fact be around 40 billion vehicle miles less than the estimate for 2022 included in the DfT’s recently issued National Road Traffic Projections (NRTP). So, the behavioural pathway that underpins high ambition is already off the table.
2) The Role of Technology
The second observation is the huge dependence on technology transition in the DfT’s plan – primarily the switch to electric or some other (as yet not on the market) zero emission vehicle – to avoid overshooting the sixth carbon budget given the overshoot which current policies on travel behaviour would otherwise produce. This techno-optimism bias is not a new revelation, but we now have some greater insight into the scale to the problem.
If we apply the DfT’s WebTAG November 2022 Road Traffic Scenario, which includes levels of technology uptake consistent with current committed policy assumptions, then none of the Transport Decarbonisation Plan traffic scenarios will get to the 6th carbon budget. If, however, the optimistic technology pathway assumed in the TDP is applied, the core NRTP projection only just exceeds the 6th carbon budget. So, how realistic is the optimistic technology pathway?
Despite the positive strides made with phase out dates for fossil fuel cars, the uptake rates on technology this would require seem highly unrealistic. For example, 80% of all car and LGV miles would have to be zero emission by 2035 and 40% of HGV miles. The Net Zero Strategy expects 53% of the car fleet and 40% of the van fleet to be zero emission vehicles by 2035. Whilst new cars have previously been driven further than older cars, this is not always true of electric vehicles, and many vehicles in the fleet by then will be older with degraded batteries. The targets in the Net Zero Strategy are hard enough to achieve given the very real challenges of further significant electricity supply upgrades and charge infrastructure deployment. We are now at the point where the buyers expect some of the petrol engined cars we sell today to still be on the road in 2035.
The automotive industry’s supply chain issues in delivering a diverse range of electric vehicle models, coupled with steep rises in the cost of living, mean that while the percentage of new car EV sales is high, this is against very low annual vehicle sales. The fleet renewal rate is much less impressive. Every year that passes without the required transition being met is a year of higher than anticipated emissions.
3) The overall outcome
It is important not to get drawn into the false ‘behaviour change’ versus ‘technology change’ dichotomy in projecting what could provide the route to Net Zero we need.
What the analysis shows is that we have already overshot the traffic assumptions assumed in pathways which are compliant with the Committee on Climate Change’s 6th carbon budget, so the ‘behaviour’ contribution is actually now a negative influence. The commitments to bus, rail and active travel in the TDP will not, by any credible projection, put us back on track. Even if we look at reductions in car traffic of 20% by 2030 as suggested in Scotland, there is a big shortfall. But nor do we have the policies or supply chains and wider transition support to deliver the technology shift which would be necessary to make up the shortfall (and even if we did this would miss the co-benefits of a more integrated transition).
There is theoretically time for both of the behavioural and technological elements of this equation to change – and likewise the interaction between them. But any careful analysis suggests that both will need to deliver more than now looks feasible, and the required actions would be happening already, and clearly are not.
4) Dangerously Working to false assumptions
What this all makes clear is that we are currently appraising our major infrastructure investments on the basis of a set of assumptions about future traffic levels and carbon emissions which are not even close to being net zero compliant. It seems we are living in an alternative transport universe.
The first thing to do if you are facing a problem, as they say, is to stop digging a hole, and my submission to the Transport Select Committee’s inquiry into Strategic Road Investment recommends just that. A policy review is essential.
That means we need to revisit the basket of policies on the table – in terms of both behavioural change and our ability to deliver technological change at pace. We are already behind the game and the implications of a past decade of inaction means the Carbon chickens have well and truly come home to roost.
We are on the wrong course, and must change. As a profession, we have to offer clear headed and realistic analysis of the net zero challenge and our advice and guidance should be consistent with that. There are some very difficult conversations to be had and quite a number of legacy project propositions that could be the catalysts for that.
How the DfT data was obtained
The freedom of information request I made
I submitted a Freedom of Information Request to the DfT for the following (summarised in brief here):
-
The assumed levels of road traffic (split by cars, LGVs and HGVs) for the upper and lower boundaries of both the Baseline and Decarbonising Transport Projection
-
The proportion of the miles driven in zero emission vehicles (again by car, LGV and HGV) and how this changes over time
-
The full set of assumptions used in separating out the high and low projection lines as a result of “Short-term COVID-19 Uncertainty”
The Information Commissioner’s judgement
“There is a very strong public interest in publication of data that will assist the public in understanding policy decisions – especially those designed to be as far-reaching and long-lasting as the transport decarbonisation strategy. Disclosure will help the public to understand where the Government’s proposals are too ambitious, not ambitious enough or about right.”
The Information Commissioner’s judgement on why the requested data should be released by the Department for Transport.
Greg Marsden is Professor of Transport Governance at the Institute for Transport Studies at the University of Leeds. He has researched issues surrounding the design and implementation of new policies for over 20 years covering a range of issues. He is an expert in climate and energy policy in the transport sector. He is the Principal Investigator on the DecarboN8 network where he is responsible for integrating a new place-based approach to decarbonising transport.
This article was first published in LTT magazine, LTT862, 6 February 2023.
You are currently viewing this page as TAPAS Taster user.
To read and make comments on this article you need to register for free as TAPAS Select user and log in.
Log in