TAPAS.network | 20 February 2023 | Commentary | John Siraut
Pandemic responses to travel-to-work seem here to stay - and have highlighted levels of car dependency

Changing journey to work patterns, and particularly the growth of working-from-home are an important issue for transport planners. New ONS survey results seem to confirm post-pandemic patterns are here to stay. examines the new data, and continues his look at the 2021 England and Wales Census data related to patterns of car ownership and travel to work at the most fine-grained local level. He finds an underlying high level of car-dependency in most areas.
WORKING FROM HOME emerged as a major issue to impact on transport during the Pandemic – and speculation continues about the level of enduring change to commuting patterns that may have been prompted by that experience.
Newly released results from an ONS survey conducted as part of its Opinions and Lifestyle Survey looking at the situation up to this January appear to confirm a continuing much higher level of both homeworking and hybrid work locations than before the pandemic and some important variations between different types of worker and employment.
Co-incidentally, the 2021 Census went ahead during one of the Covid lockdowns, revealing both the responses to that in terms of travel to work and the underlying picture of how dependent most areas of the country are on the use of the car to commute to work, and indeed car dependency more generally.
In this special two-part version of my regular contribution on ‘Data Driven Thinking’ we look at both the ONS survey results and the Census data.
Interestingly, the Census found some correlation between areas with low levels of car use for commuting, and those with a low proportion of people working from home. It would appear that people that choose, or must, use a car for the journey to work, and are thus more dependent than elsewhere on the car for commuting, were less likely to be living in areas where a significant proportion of people were working from home during the pandemic.
Either way, the Census has certainly revealed the underlying picture of how dependent most areas of the country are on the use of the car to commute to work. While that might have been exacerbated by Covid it shows the mountain to climb if we are trying to get travel and transport to be more sustainable. Each and all of Active Travel, Rail, and Bus alternatives are facing real barriers to greater use from both geographic and economic factors. Not to mention the high levels of car ownership, and general dependency on the car, revealed as a baseline by the Census across most of the country.
John Siraut is director of economics at Jacobs.
This article was first published in LTT magazine, LTT863, 20 February 2023.
Characteristics of homeworkers, Great Britain: Sep 2022 to Jan 2023
An analysis of homeworkers, including prevalence of hybrid working, and breakdowns by personal and employment characteristics produced from the ONS Opinions and Lifestyle Survey (OPN).
Before the coronavirus (COVID-19) pandemic, only around one in eight working adults reported working from home. The ONS Annual Population Survey data for the 12-month period from January to December 2019 shows that around 12% of working adults reported working from home at some point in the week before the interview. Using the most recent data from the Public Opinions and Social Trends Survey, which uses data from the Opinions and Lifestyle Survey (OPN), we can look at working arrangements since the start of the pandemic, and how they have evolved since.
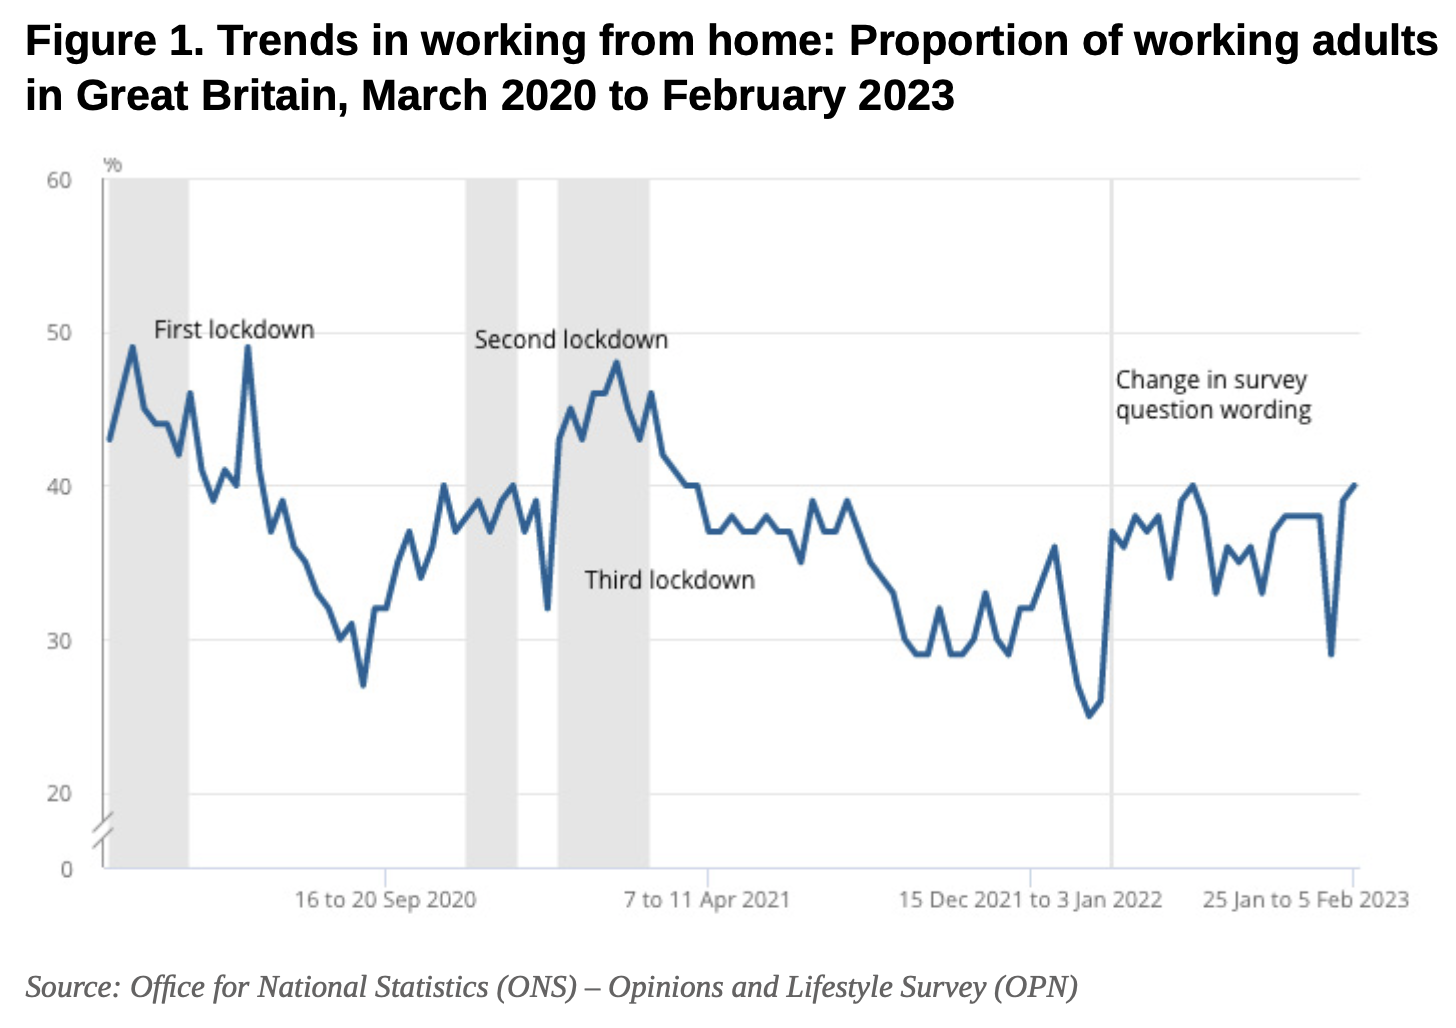
Levels of working from home peaked during the pandemic, with almost half of working adults (49%) reporting having worked from home at some point in the past seven days in the first half of 2020 (3 to 13 April and 11 to 14 June 2020). Two years later (27 April to 8 May 2022), when guidance to work from home was lifted in Great Britain, around 38% of working adults reported having worked from home. In the most recent period (25 January to 5 February 2023) around 40% of working adults reported having worked from home at some point in the past seven days.
Throughout 2022 the percentage of working adults reporting having worked from home varied between 25% and 40%, without a clear upward or downward trend, indicating that homeworking is resilient to pressures such as the changing and end of Covid restrictions and increases in the cost of living.
Among working adults who have worked in the last seven days, 16% reported working from home only, and 28% reported both working from home and travelling to work over the period September 2022 to January 2023.
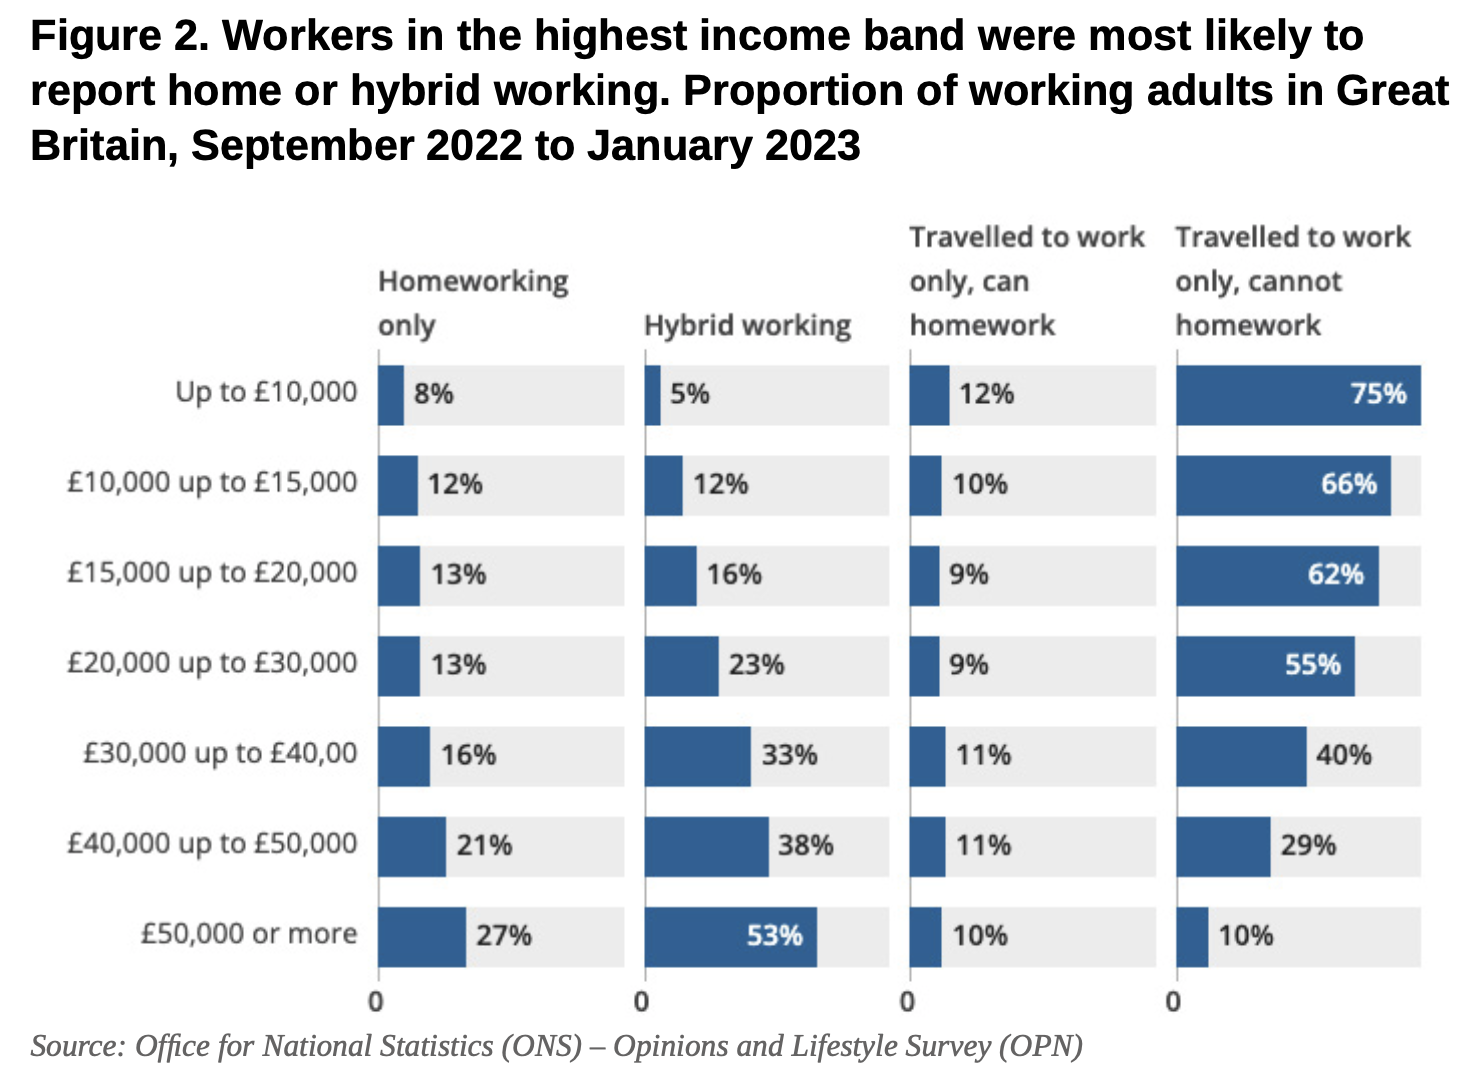
Workers in the highest income band, those who were educated to degree level or above, and those in professional occupations were most likely to report home only or hybrid working.
Self-employed workers were twice as likely to work from home only (32%) compared with employees (14%).
London residents reported the highest levels of hybrid working across Great Britain, with 4 in 10 workers both working from home and travelling to work.
Characteristics of homeworkers
In the new survey, overall 44% of workers reported home or hybrid working and 56% reported only travelling to work in the preceding seven days (September 2022 to January 2023). A higher rate reported hybrid working, with 28% reporting hybrid working and 16% reporting working from home only. A higher rate of workers travelling to work (46%) reported not being able to work at home compared with those who travelled to work, but could work from home (10%).
Younger workers continue to be least likely to only work from home (6%). Those aged 16 to 24 years had the highest rate of those travelling to work at 79%, while those aged 34 to 44 years had the lowest rate at 48%. The group aged 16 to 24 years also had the highest rate of workers who did not have the ability to work from home, with just under two in three (65%) reporting this. Those aged 25 to 34 years, 35 to 44 years, and 45 to 54 years reported higher rates of home or hybrid working compared with the group aged 16 to 24 years.
More men reported travelling to work without the option to work from home (48%) compared with women (44%). There was little difference in the levels of homeworking only and hybrid working reported by men and women. 16% of men and 17% of women reporting homeworking only and 27% and 29% reporting hybrid working, respectively.
Those with higher incomes were more likely to work from home. The highest levels of home only or hybrid working were seen in workers in the highest income band of £50,000 or more annual earnings – with 8 out of 10 workers in this category reporting home or hybrid working. This contrasts with workers in the lowest income band of up to £10,000 annual earnings where only 14% of workers reported home or hybrid working. Of those in the lowest income band, 3 out of 4 travelled to work and could not work from home (75%), the highest rate among all income bands.
Those with the highest educational qualifications reported the highest levels of home and hybrid working, with 23% of workers with a degree reporting working from home only, and 44% reporting hybrid working. In contrast, only 5% of workers with no qualifications reported working from home only and 9% reported hybrid working.
Those in professional occupations reported the highest levels of home and hybrid working, and those in elementary occupations reported the lowest. Professional occupations, associate professional occupations and managers, directors and senior officials were the three occupations with the highest levels of both working from home only (27%, 22% and 21%, respectively) and hybrid working (44%, 39% and 43%, respectively).
Elementary occupations, caring, leisure and other service occupations and process, plant and machine operatives had the lowest levels of home only (1%, 4% and 5%, respectively) and hybrid working (3%, 10% and 5%, respectively). The occupations with the lowest levels of home or hybrid working saw higher levels of those who only travelled to work and could not work from home. For more information on which occupations can work from home, see ONS article, from July 2020, Which jobs can be done from home?
Workers in the public sector reported higher levels of hybrid working (35%) than those in the private sector (26%). There were higher rates of workers who only travelled to work and could not work from home in the private sector (50%) compared with the public sector (42%).
Self-employed workers were more likely to work from home only. Nearly 1 in 3 (32%) of self-employed workers reported homeworking only, compared with 14% of employees. Self-employed workers were less likely to have travelled to work without the option to work from home (34%), compared with employees. Nearly half of employees (47%) reported travelling to work without the option to work from home.
About the data
To provide detailed analysis of the characteristics of those who work from home, the analysis described uses a different definition than the one reported previously in the OPN Public Opinions and Social Trends (POST) time series data.
Firstly, the base of the question is different. This removed working adults who have not worked in the past seven days. This is because it was not possible to infer their working arrangements. In this article the word “workers” is used to identify all those working adults who worked in the previous week.
Secondly, the survey wanted to look at people’s ability to work from home, as well as whether they had actually worked from home within the analysis, so home and hybrid workers were divided into two categories:
-
homeworkers – those who only worked from home in the past seven days
-
hybrid workers – those who both worked from home and travelled to work in the past seven days
Those who only travelled to work were divided into two categories:
-
travelled to work, can homework – those who only travelled to work in the past seven days but did have the option to work from home
-
travelled to work, cannot homework – those who only travelled to work in the past seven days but did not have the option to work from home
Contact details for this article
Chris Hendry, Sophia King, James Probert, Giselle Scott
Email: economic.advice@ons.gov.uk
Telephone: +44 30 0067 1073
Source
Office for National Statistics (ONS), released 13 February 2023, ONS website, article, Characteristics of homeworkers, Great Britain: September 2022 to January 2023
Some key tables from the Census highlight high car dependency in most of the country
As the output of detailed data from the 2021 Census covering England and Wales continues, it allows us to take a deeper dive into that relating to transport at a very local level. In this article I examine data published at what is termed the Lower Layer Super Output Area (LSOA) of which there are 35,672 such designated areas in England and Wales. On average a LSOA covers roughly 1500 people. In urban areas they can therefore be very small in extent, covering just a few streets or part of a large estate, while in rural areas they can cover quite large geographic areas.
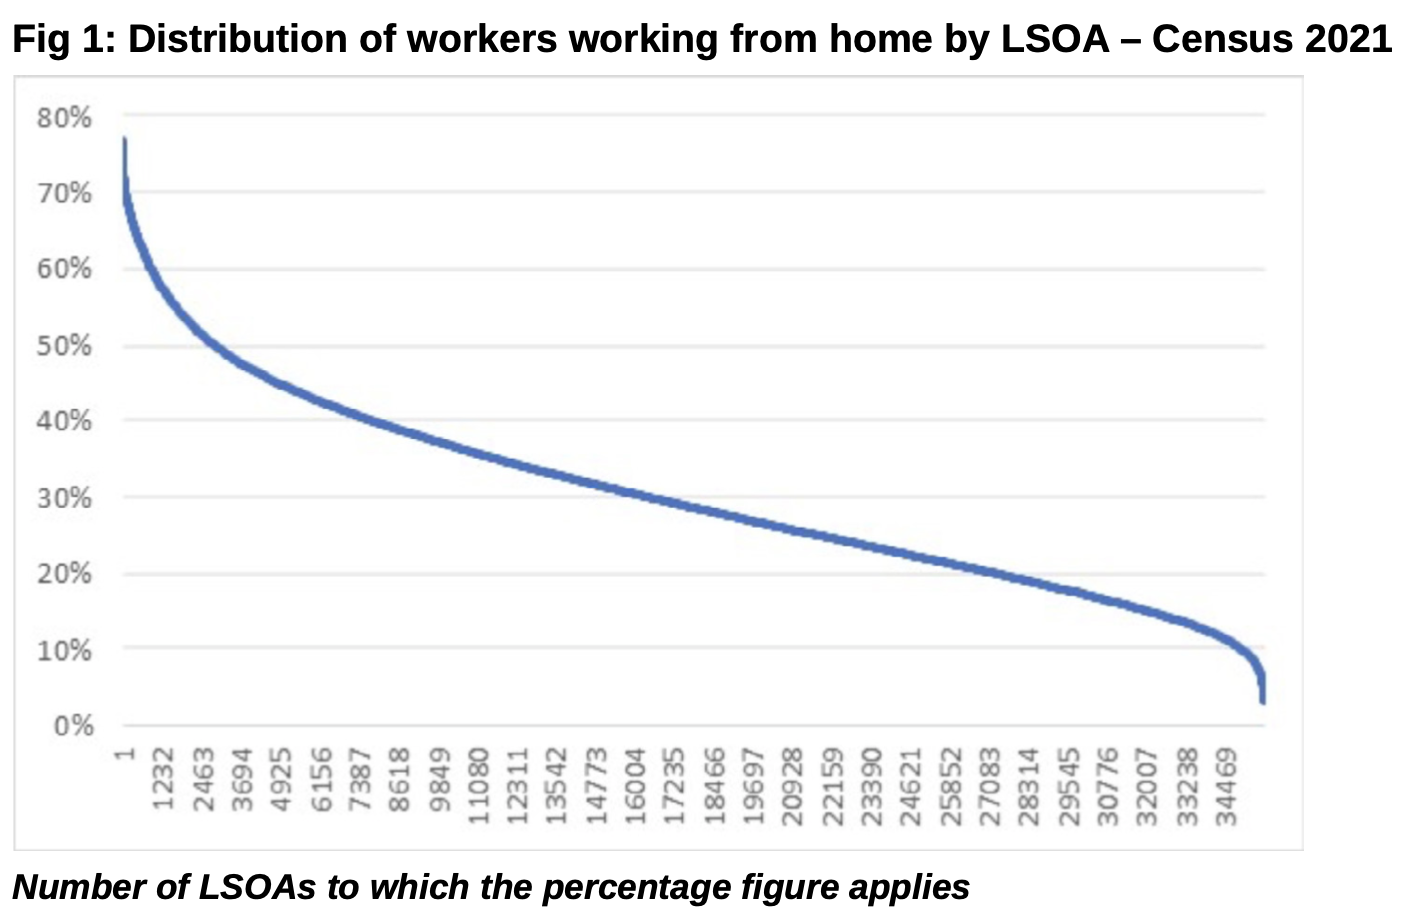
Because, as mentioned, the 2021 Census took place during one of the COVID-19 lockdowns, so a high proportion of people were working from home at the time. Figure 1 shows the distribution of people working from home across all 35,672 LSOAs. It highlights that home working remained the exception in many parts of the country – at an extreme level in parts of Scarborough and Hull only 3-4% of working people did so. However, there were less than 10% of people working from home in only under 2% of LSOAs. Comment has been widely made that industrial and service sector employees had little option but to continue to travel to their workplaces whilst managerial and administrative ‘white collar’ staff generally had working from home as a feasible option. Thus, at the other end of the scale, more than 70% of workers living in various parts of inner London were working from home. Penylan in Cardiff saw the highest proportion of people working from home in Wales at 57%. Overall across England and Wales 30% of the workforce were working from home at the time of the Census.
For those who were still travelling to work at the time of the Census, their use of modes and length of journey varied considerably.
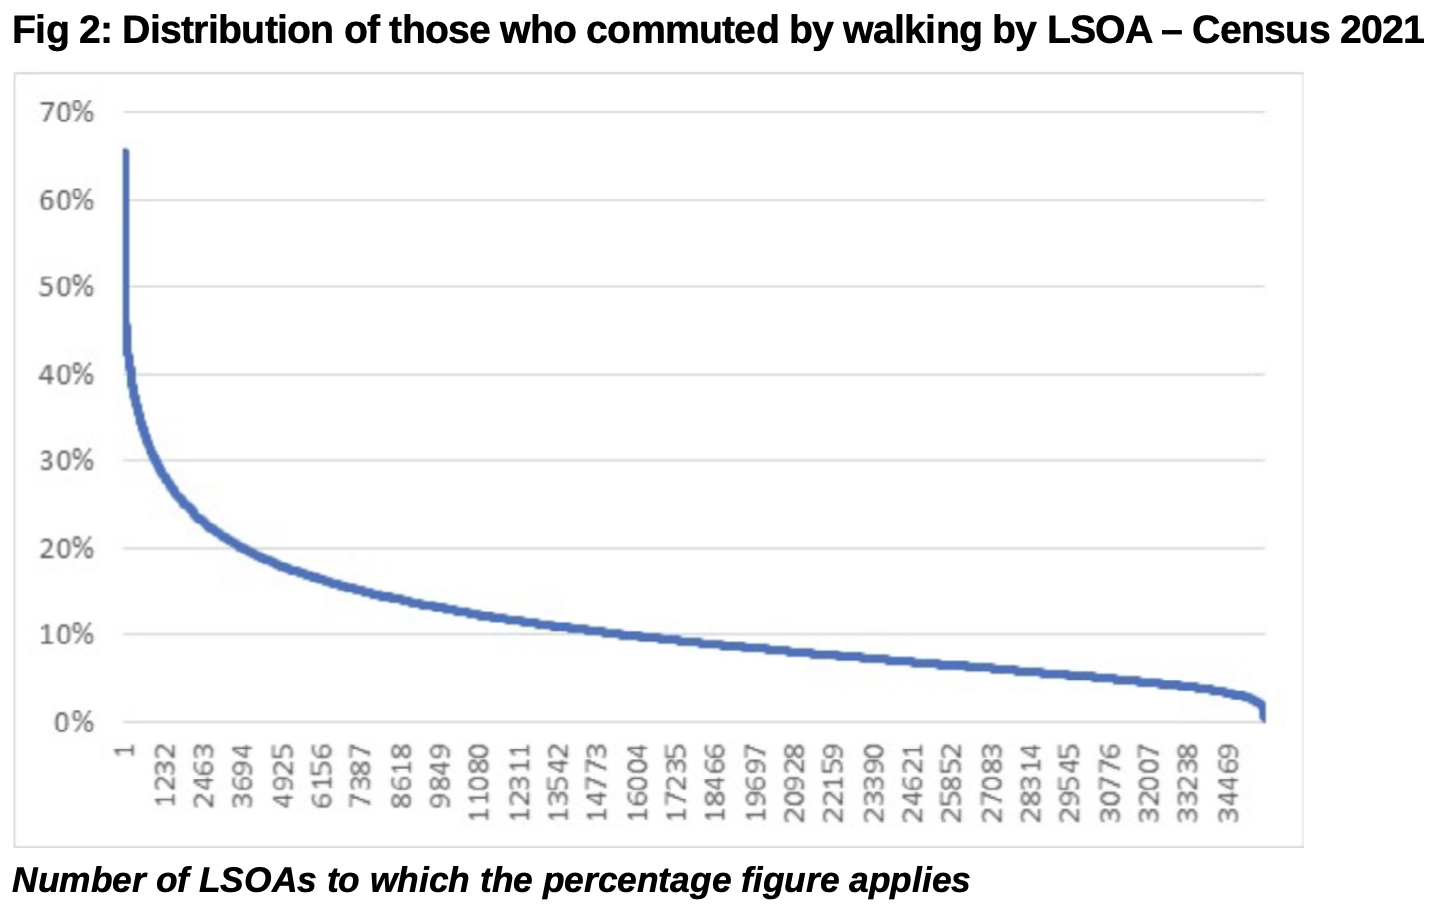
Figure 2 shows the distribution of those commuting by walking across all LSOAs at Census time. Walking has the highest commuting mode share after driving, averaging 11%. Six per cent of LSOAs have a walk mode share of 25% or more. These cover a wide variety of areas with parts of Cambridge, Oxford, Aberystwyth, Bristol, Bath and Salford all having LSOAs with more than 50% of people walking to work. At the other end of the scale Halewood Green in Knowsley recorded 0% walking despite, or perhaps because of, it being within walking distance of two major car manufacturing plants.
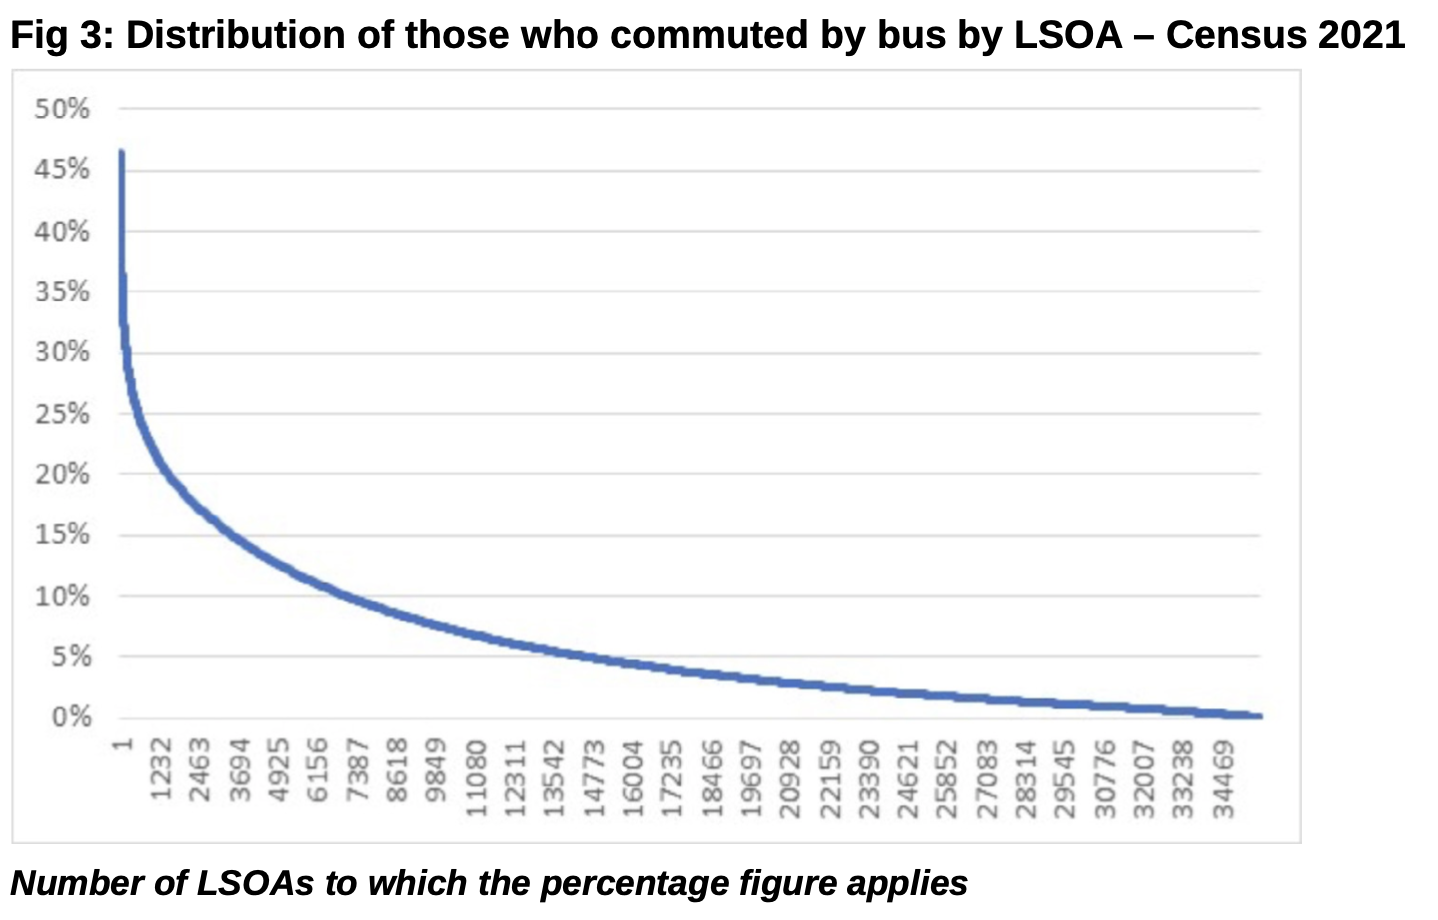
On average 6% of those commuting did so by bus. Around 17% of output areas had a bus mode share of 10% or above, while over a third had a mode share of under 2%. The highest mode shares occurred in Southwark, in London, with parts of Hillingdon and Hounslow also achieving over 40%. Parts of Luton, Liverpool and Manchester with bus mode shares of 35% were the leading equivalents outside London. Cardiff’s Ely district at 22% had the highest Welsh market share. Figure 3 shows that there is a very long tail of LSOAs where bus use is virtually non-existent.
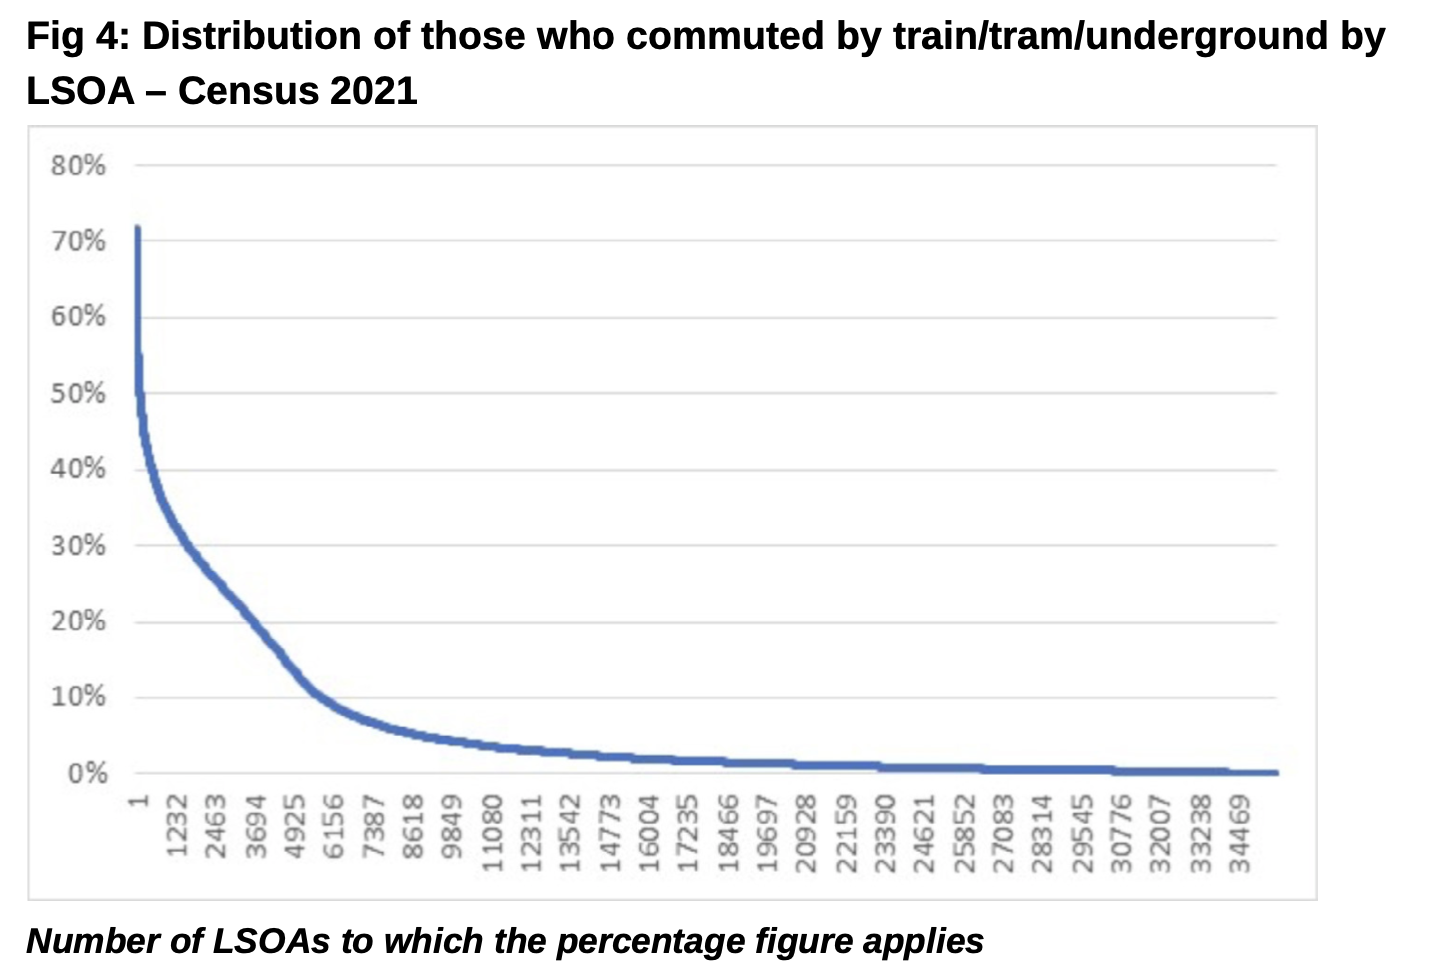
Rail use (which includes light rail, tram and underground), not surprisingly tends to go from an extreme of very high level amongst those living along such lines in urban areas, to effectively zero in those many LSOA locations which have no such service. There are areas in Newham in East London where rail’s mode share is over 70%, although even in London its mode share falls to under 5% in parts of Hounslow and Richmond. The highest rail use outside London is recorded in parts of Epping and Thurrock in Essex, where it reaches 31%, while outside the London commuter belt in parts of Salford it reaches 27%. Treforest in the Rhonda has the highest rail mode share in Wales at 16%. At the other end of the scale, as can be seen in figure 4, in 50% of LSOAs rail use is less than 2%. Overall 6% of commuters travelled by rail.
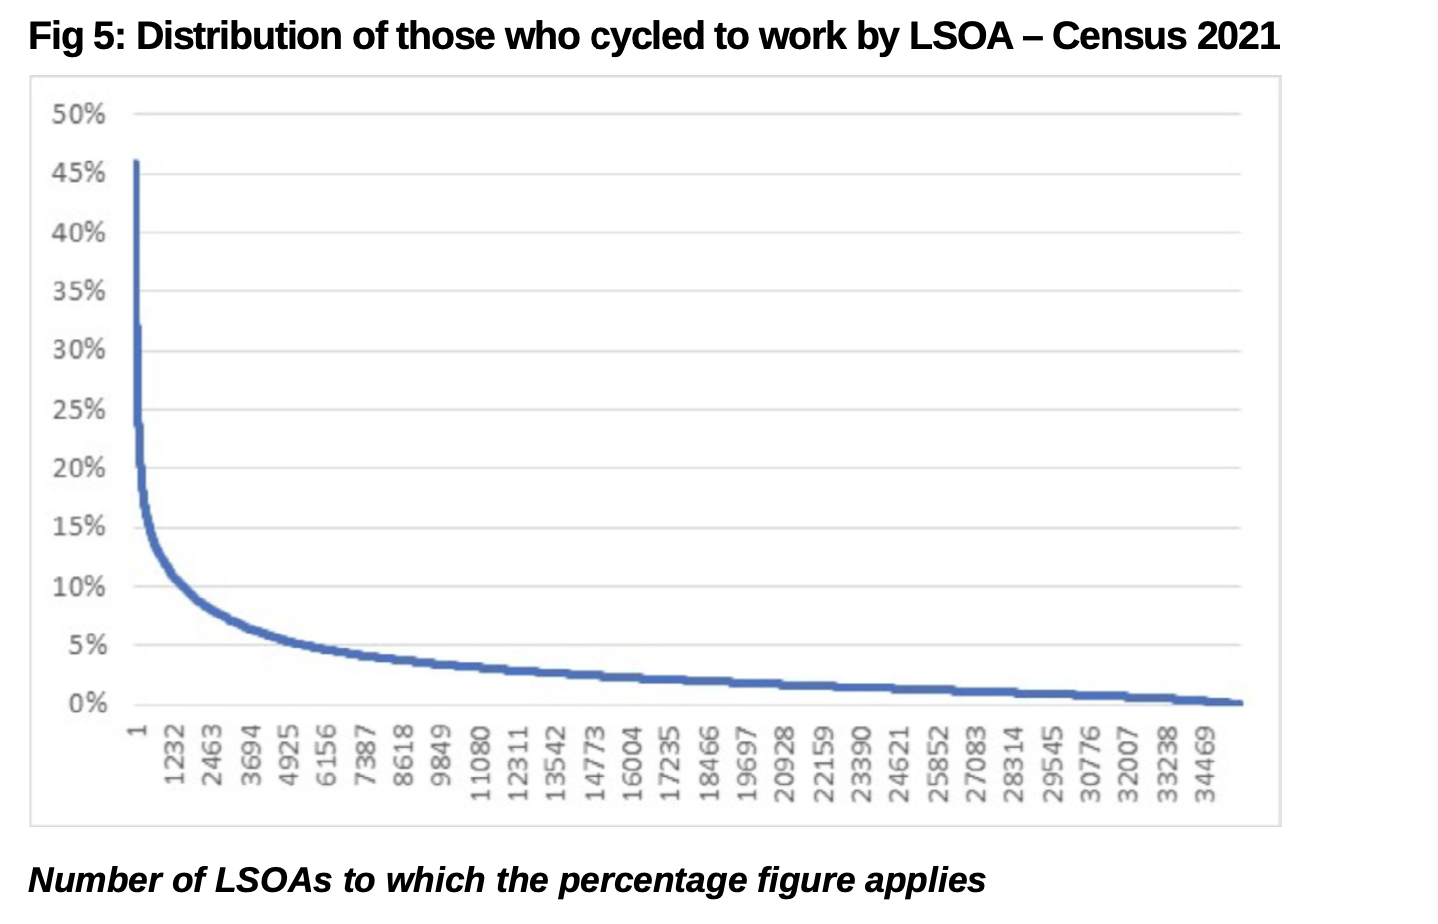
Bicycle use averaged around 3% overall, but was heavily concentrated in just a few areas – as can be seen from figure 5, which shows the now familiar distribution for a non-car mode in a small number of areas with a very high share, and a long tail of LSOAs with a very low mode share for the relevant mode, be it walking, cycling, bus or rail.
Less than 5% of LSOAs achieved a bicycle mode share of 10% or more, while almost 60% had less than a 2% mode share. There is no surprise that Cambridge provided most of the LSOAs with over 40% of commuters cycling, with the Romsey area of Cambridge at 46% having the highest overall rate. The highest cycle mode share in an area of Oxford was 39%, while London’s best was to be found in parts of Tower Hamlets and Hackney with 30% and 29% respectively. The St Andrew’s Park area of Bristol at 23% was the best performing area outside those three cities. Cardiff’s Canton and Pontcanna area had the highest Welsh figure at 13%.
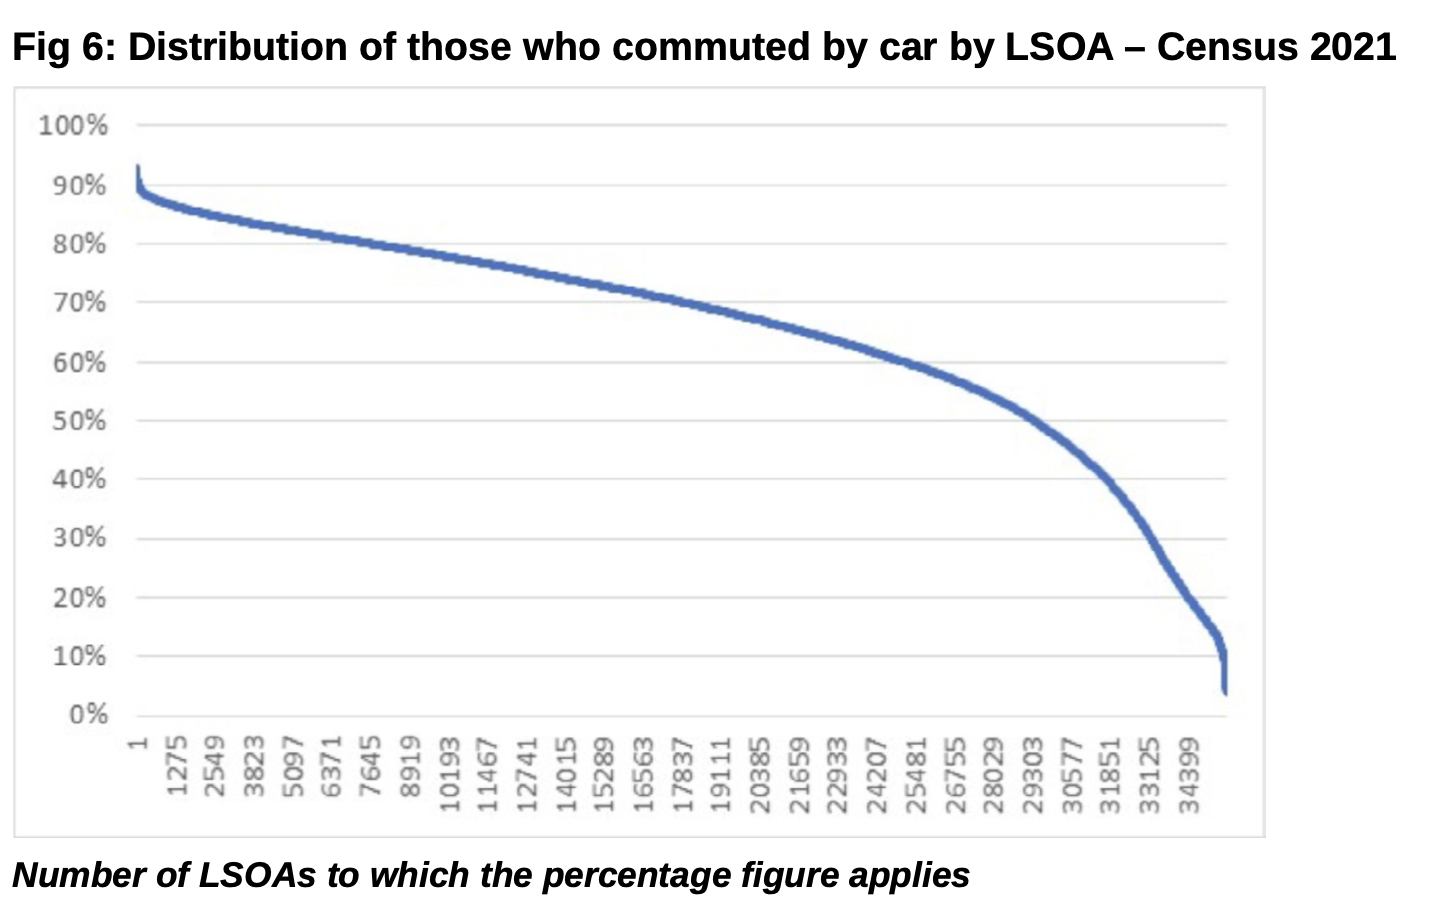
Car’s mode share averaged 65% overall, and not surprisingly figure 6, which represents it, is a mirror image of the previous modal graphics. In nearly 90% of LSOAs car’s mode share was recorded at over 50%. The highest, at 93%, was found around Tonyrefail in Rhonda Cynon Taf. Not surprisingly most other rural areas across the country have very high car mode share. Even in parts of the capital, car’s mode share reaches 79% – for example in areas like Biggin Hill in Bromley, on the very outskirts of Greater London. The lowest car mode shares are also found in London, however. Indeed, of the LSOAs where car’s market share is less than 20%, 98% of them are in Greater London. Outside London, Brighton is the area with the most LSOAs in which the car’s market share is less than 20%.
In respect of other modes, an average of 5.5% of the surveyed population commuted as a passenger in a car or van, though in parts of Kingston upon Hull, and Boston in Lincolnshire, car-sharing rates of over 30% were recorded. Intriguingly, the highest rate of taxi use occurred in parts of central Middlesbrough and Stoke-on-Trent where they accounted for over 10% of commuting trips, suggesting public transport was not meeting workers’ needs in these areas. While motorcycle use averaged just 0.7% it reached a high of 10% in Thornton Heath in Croydon. Outside London, the centre of Hove in Brighton had the highest level of motorcycling at 4%.
It is also of considerable interest to see just how far did people travel to work? A very rough calculation suggests people who were not working at home were travelling on average around 11km to work at the time of the Census. Figure 7 shows the estimated distribution of average commute lengths by LSOA.
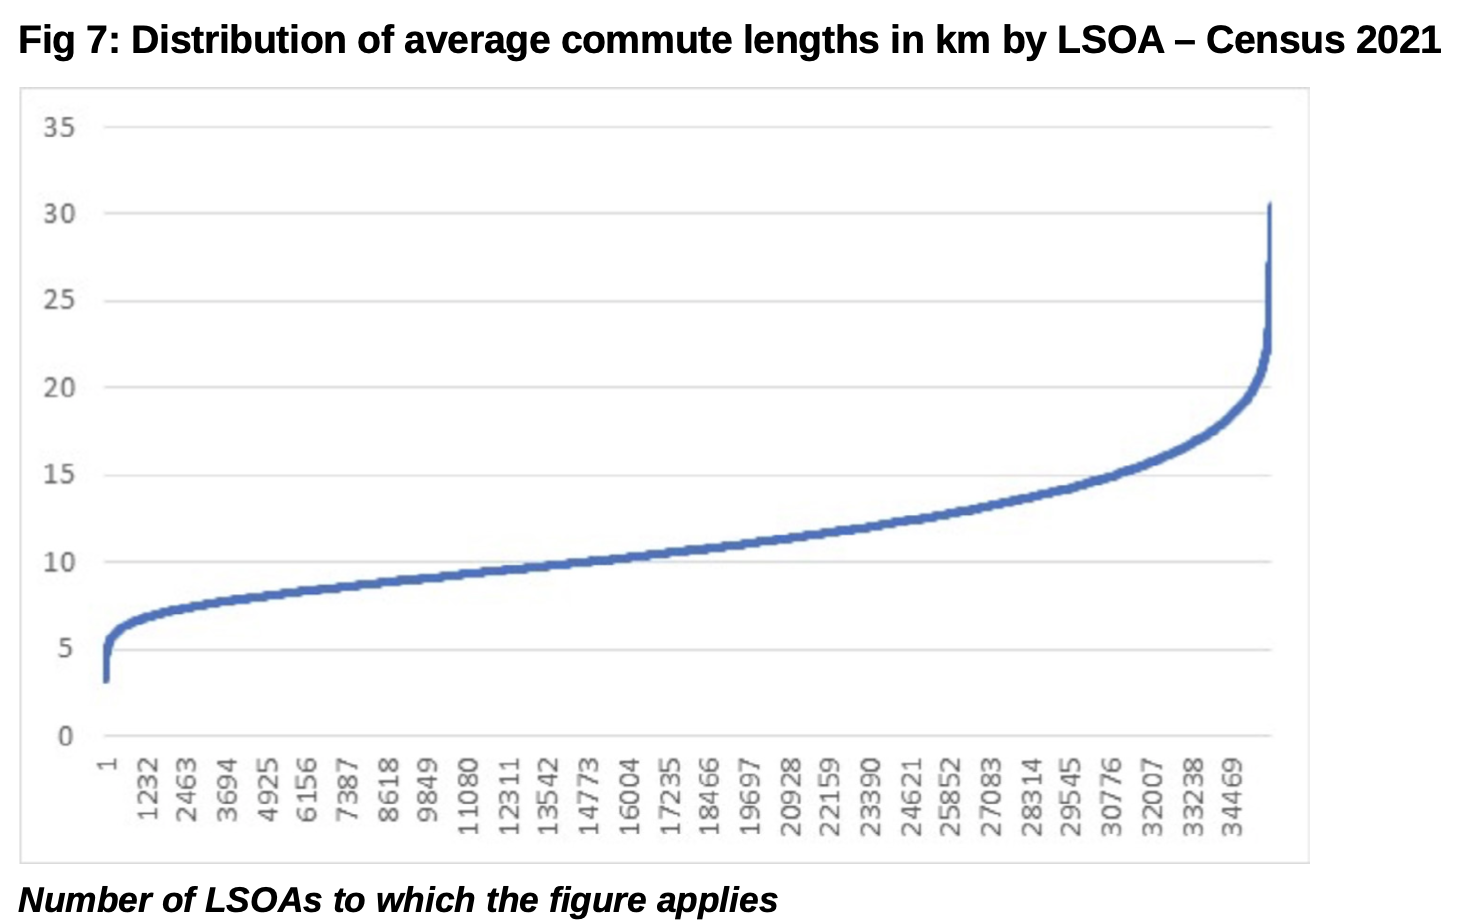
The shortest average commutes tend to be in London, and in smaller self-contained cities such as Swansea, Oxford and Plymouth, where it was coming in at under 5km. Over 60% of commuters travelled less than 2km in parts of Aberystwyth, Salford, Oxford and Barrow. In a very small group of areas average commutes were over 20km – this includes mainly rural areas such as Powys, Shropshire and Northumberland. In parts of the north-east nearly 50% of commuters were travelling more than 20km.
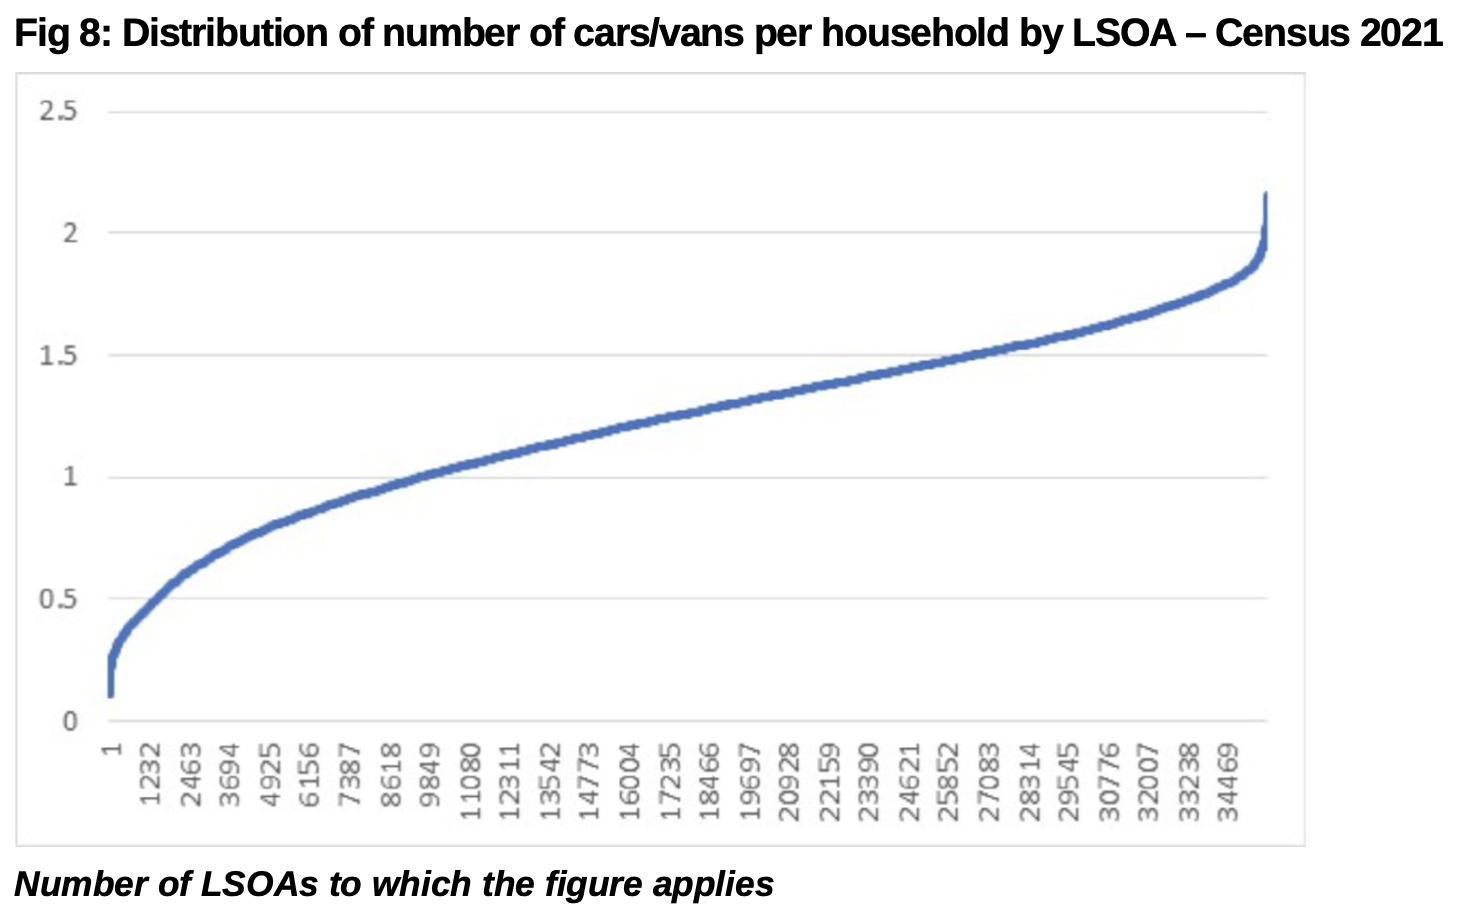
One figure least likely to have been significantly affected by the Pandemic lockdowns is the level of car ownership, which varies considerably across the country. A conservative overall estimate suggests that on average there are 1.2 cars/vans per household. As figure 8 highlights, this varies from 0.1 cars per household around the Elephant & Castle in Southwark in inner London, to around 2.2 in parts of Leicester. Swansea High Street has the lowest car ownership in Wales, at 0.3 cars per household, while parts of Connah’s Quay in Flintshire has the highest at 2 cars per household.
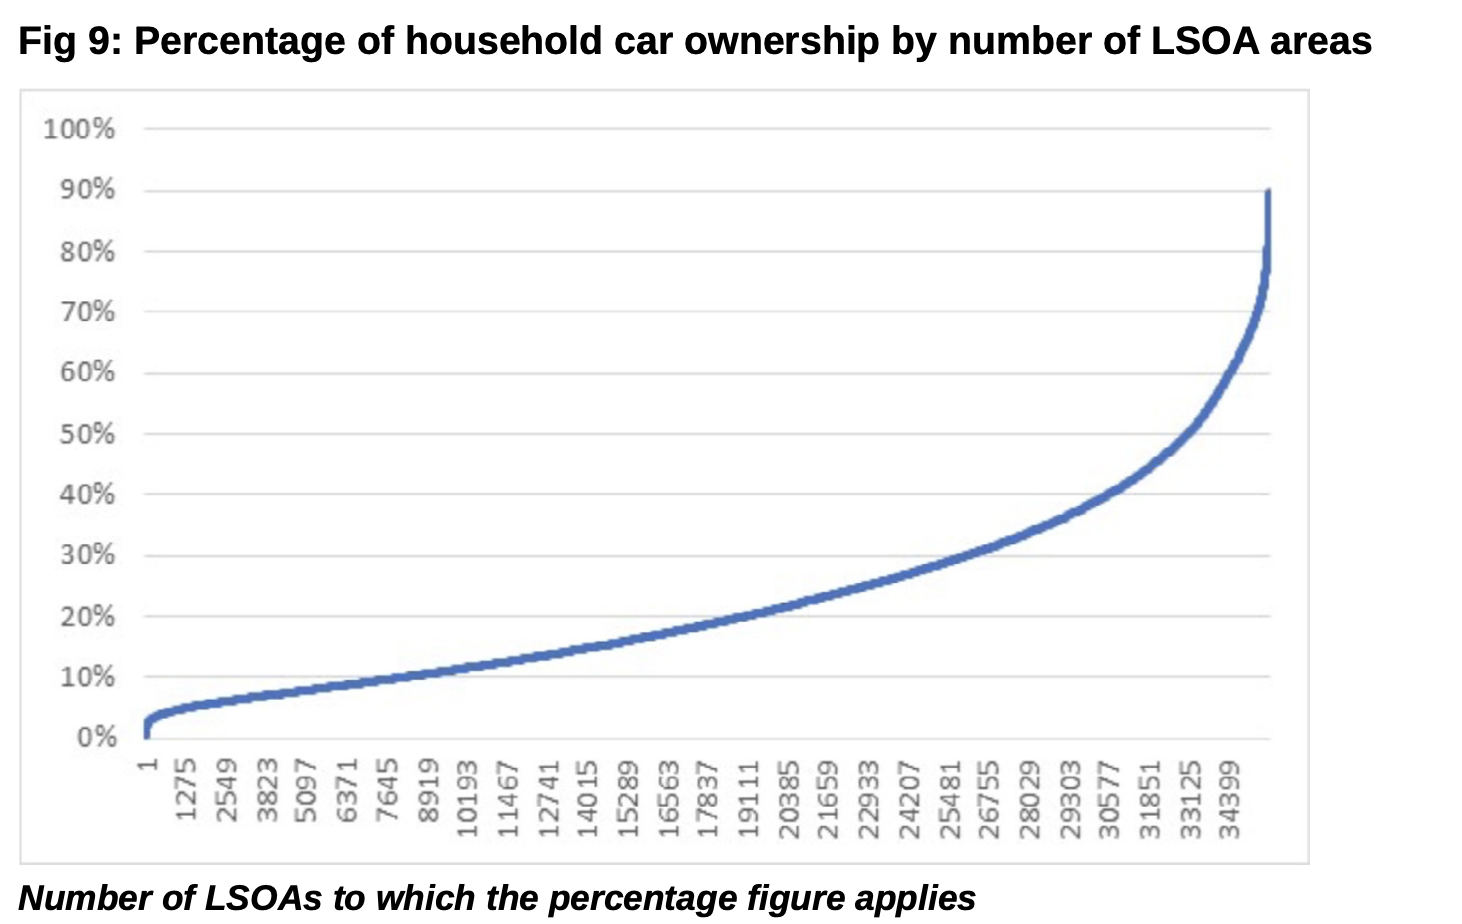
Despite the generally high levels of car ownership around most of the country, on average 23% of households have no car. This ranges from virtually 0% of those in parts of Cheshire East not having a car, to 90% of households around the Elephant & Castle in Southwark not having one. Around The Headrow in Leeds, the lowest level of car ownership outside London was found, with 82% of households having no car. In Wales the highest number of non-car households were in Swansea High Street, with 72% non-car owners.
Sources: The Census data reviewed in this article and the charts can be found from this link.
John Siraut is director of economics at Jacobs.
This article was first published in LTT magazine, LTT863, 20 February 2023.
You are currently viewing this page as TAPAS Taster user.
To read and make comments on this article you need to register for free as TAPAS Select user and log in.
Log in