TAPAS.network | 19 June 2023 | Commentary | Phil Goodwin & Lisa Hopkinson
Induced traffic: yet again a worryingly overlooked dimension in crucial road planning and appraisal policy

Though known for nearly a century, with detailed studies over three decades, the implications of the induced traffic arising from expanded road capacity remain not fully acknowledged and accounted for in highway planning and appraisal, and thus a concern to and . Here they review the evidential basis for the occurrence, with some new examples, and urge proper attention to it in important new transport planning guidance about to be issued.

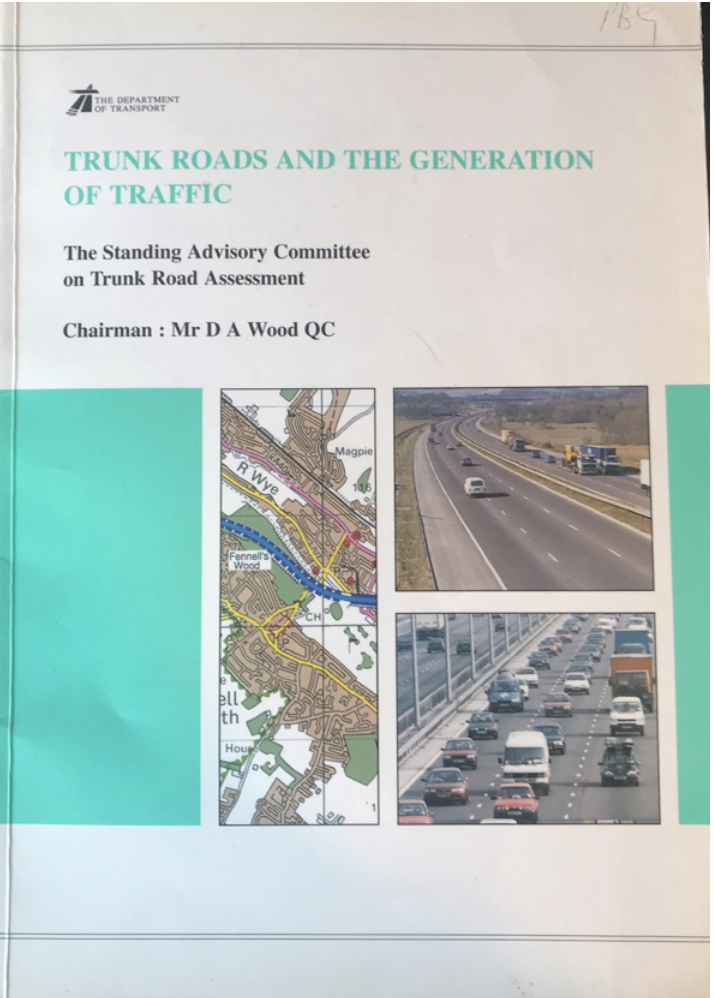
INDUCED TRAFFIC was defined by the seminal SACTRA (1994)[1] report as ‘the increment in new vehicle traffic that would not have occurred without the improvement of the network capacity’. This report was commissioned by the UK Government, and carried out by an appointed panel of experts, the Standing Advisory Committee on Trunk Road Appraisal. The evidence tracks back at least to the 1920s. It includes quite detailed understanding of the scale and influences on induced traffic, and the effect this has on the intended benefits from new road capacity. They concluded that “An average road improvement, for which traffic growth due to all other factors is forecast correctly, will see an additional [i.e. induced] 10% of base traffic in the short term and 20% in the long term.” This was based on a synthesis of a number of different sources of evidence, including before-and-after traffic counts on improved roads and alternative routes they had been designed to relieve, evidence on values of time and demand elasticities with respect to prices and travel times, evidence on the amount of time spent travelling, and theoretical considerations from economics and behavioural studies.
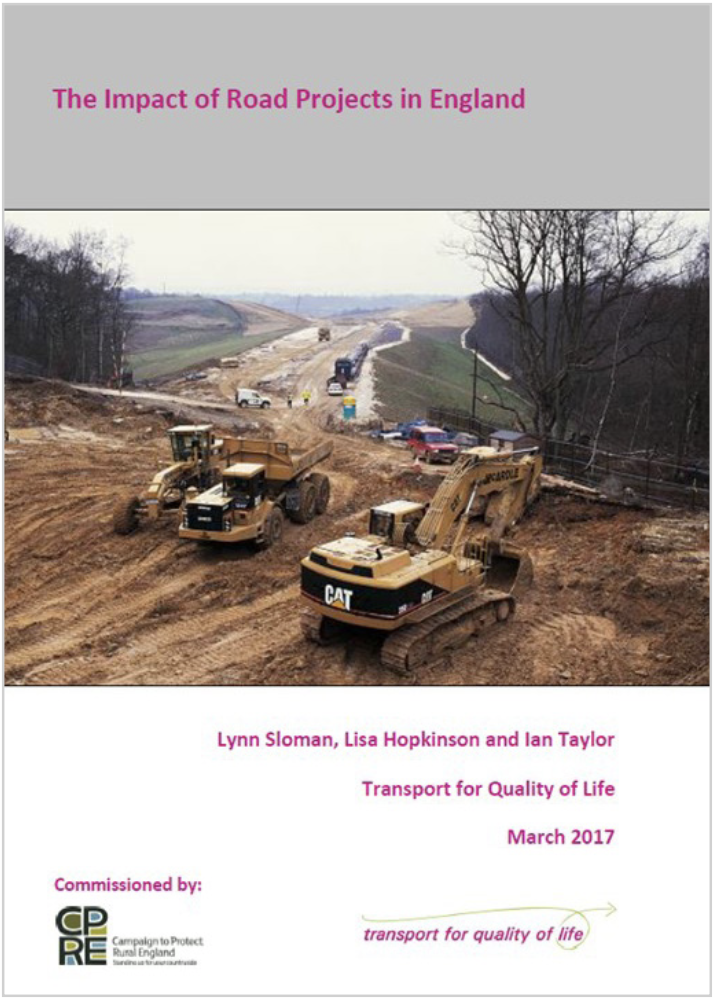
The intuitive thinking behind the concept is not really that remarkable. It is hardly a surprise that road users respond to new, improved, opportunities to make journeys when additional capacity, links and travel speeds are facilitated. (Indeed, a large part of the framework of transport economics would fall to pieces if this were not possible) The academic journal Transportation published a special issue on the theory, evidence and implications of that SACTRA report, including a paper by Goodwin (2006)[2] on the empirical evidence and its analysis. In a 2006 summary he commented on the pattern for these findings to be continually forgotten and rediscovered: “For 80 years, every eight years on average, there has been the same experience, the same conclusions - even, for goodness sake, more or less the same figures”[3]. Studies included a 2006 Council for the Protection of Rural England (CPRE) report which found that after the opening of 13 large road schemes traffic growth was significantly higher than growth on other nearby road corridors or national traffic growth[4]. A later 2017 report by Transport for Quality of Life for CPRE used the (then) Highways England’s published reports on national road schemes to show that they also generated additional traffic over and above background traffic growth with average increases of 7% over the short term (3- 7 years) and 47% over the long term (8-20 years)[5].
Despite all this documented material, the recently published draft National Policy Statement for National Networks (NNNPS) (para 3.3)[6] makes the brief, rather dismissive comment on induced demand, stating: “Evidence that development on the network leads to induced demand is limited. A recent literature review suggested that the scale of any induced demand is likely to vary depending on circumstances” These two sentences cite one study only, a 2018 literature review commissioned and published by the DfT itself[7] (conducted by WSP and Rand Europe), which was designed to review the empirical evidence since SACTRA.
Seminal work: the SACTRA report from 1994 and that for CPRE in 2017
The first sentence is disingenuous. It is indeed strictly true that the evidence is ‘limited’, in the sense that it is not unlimited. But it is still substantial, since the 2018 review actually supported the findings of the SACTRA report, and states, as SACTRA did, that induced traffic can be significant. It does indeed state that “its size and significance is likely to vary in different circumstances”[8], but this can hardly be interpreted as either a criticism of the SACTRA conclusions, which made exactly the same point, or a case for minimising the significance of the concept. While the review states that evidence on the sources of induced traffic are limited, and that case study evidence is limited, one of the case studies it reviewed was the 2017 CPRE report. This in turn used National Highways’ own case study data from 80 or so national road schemes, and found, as quoted above, significant evidence that development on the network leads to induced demand. It was particularly evident that ex post traffic growth on roads where the capacity had been increased was greater than background traffic trends generally. This indicates that biases will occur in road appraisal if there are underestimates of the difference between traffic volumes in the ‘with’ and ‘without‘ assumptions about the capacity increase, since that is the measure used for describing the improvement or otherwise due to the project.
There is additional recent evidence of induced traffic on the network to be obtained by reviewing the 40 or so POPE (Post-Opening Project Evaluation) reports published by National Highways and its predecessors since the 2017 report for CPRE. These are published on the DfT website[9] (up to March 2020) or on the National Highways website[10] (after March 2020). These reports are either One Year After (OYA) or Five Years After (FYA), following the opening of a road scheme. The FYA reports are more likely to give a better indication of the size and significance of induced traffic over the medium and long term than OYA reports, which is consistent with the SACTRA findings that long run induced traffic after several years was on average, of the order of twice as great as the effect after a year. This is particularly relevant since the appraisals depend on estimated impacts over a long period, of up to 60 years, not the temporary relief from congestion which would be expected in the first few years after an expansion of capacity. Growth of induced traffic over time reduces the duration of this period of relief as well as its scale.
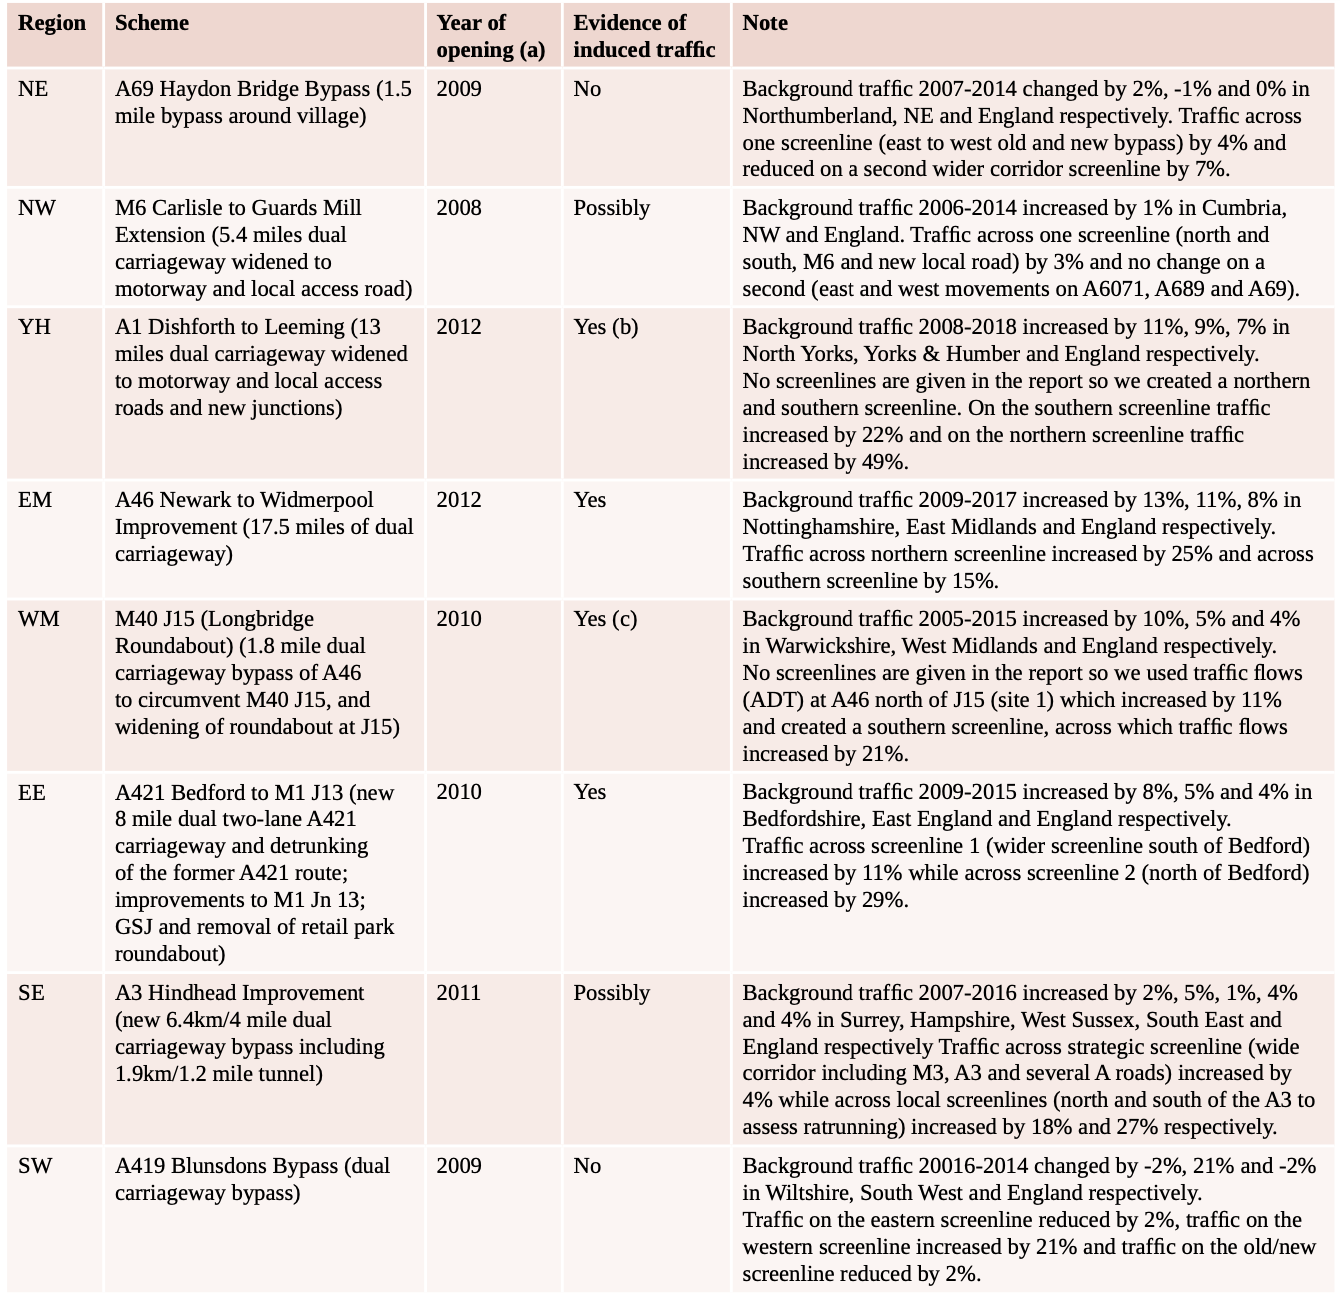
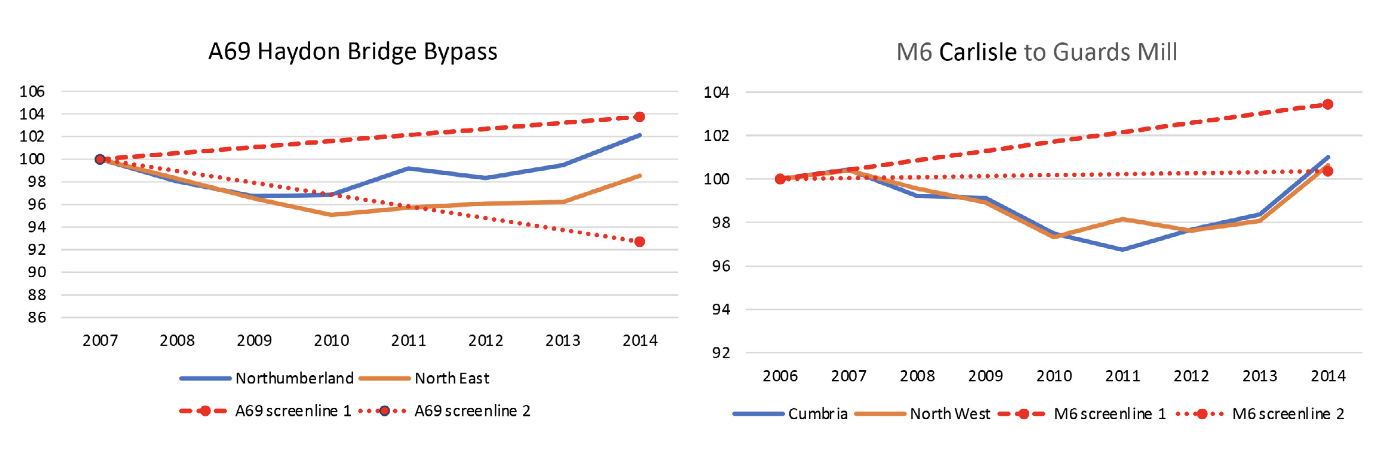
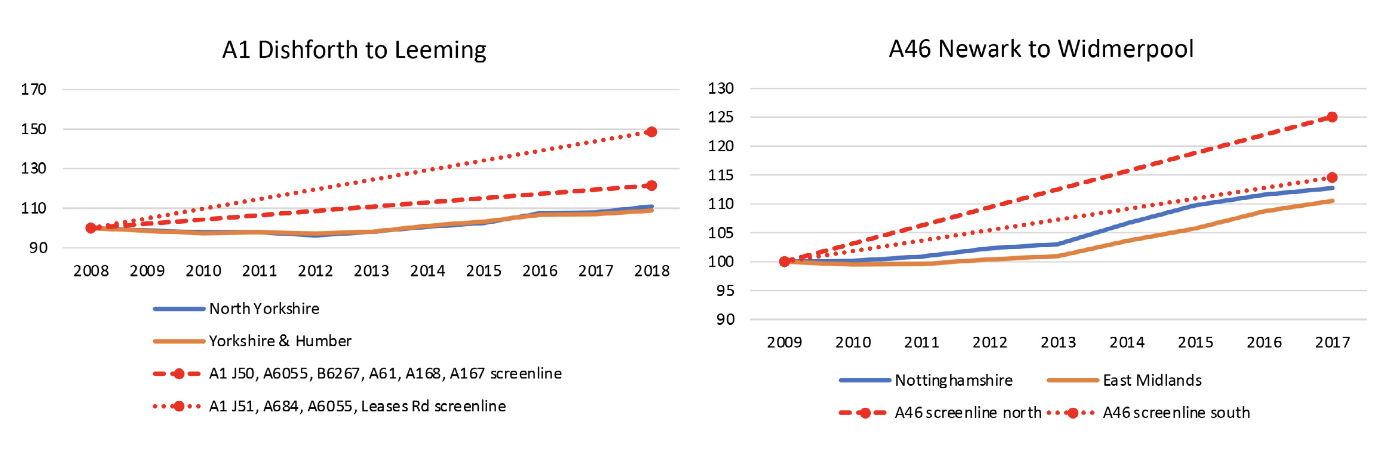
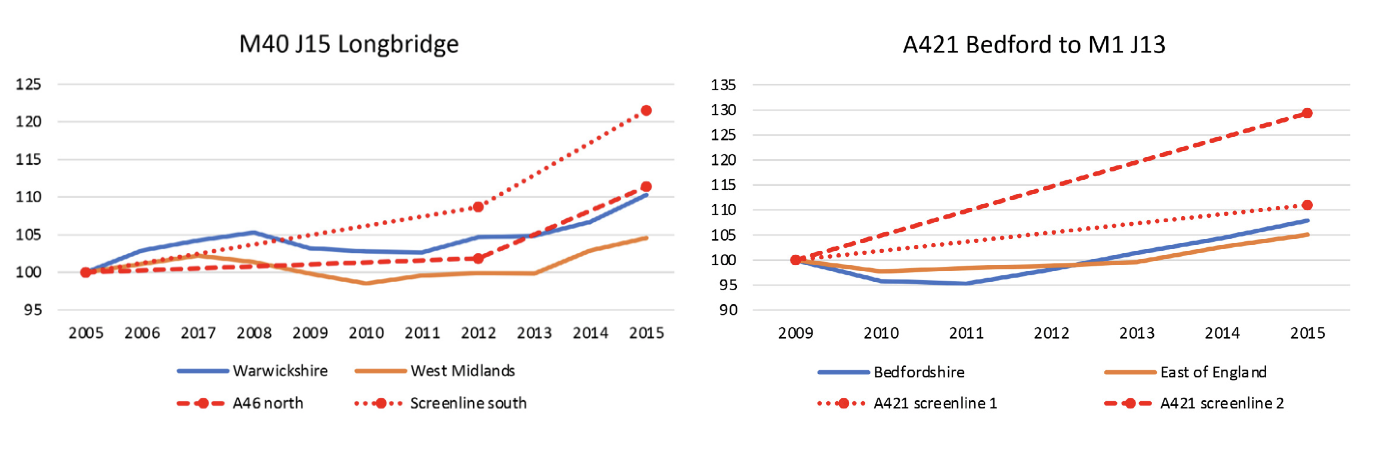
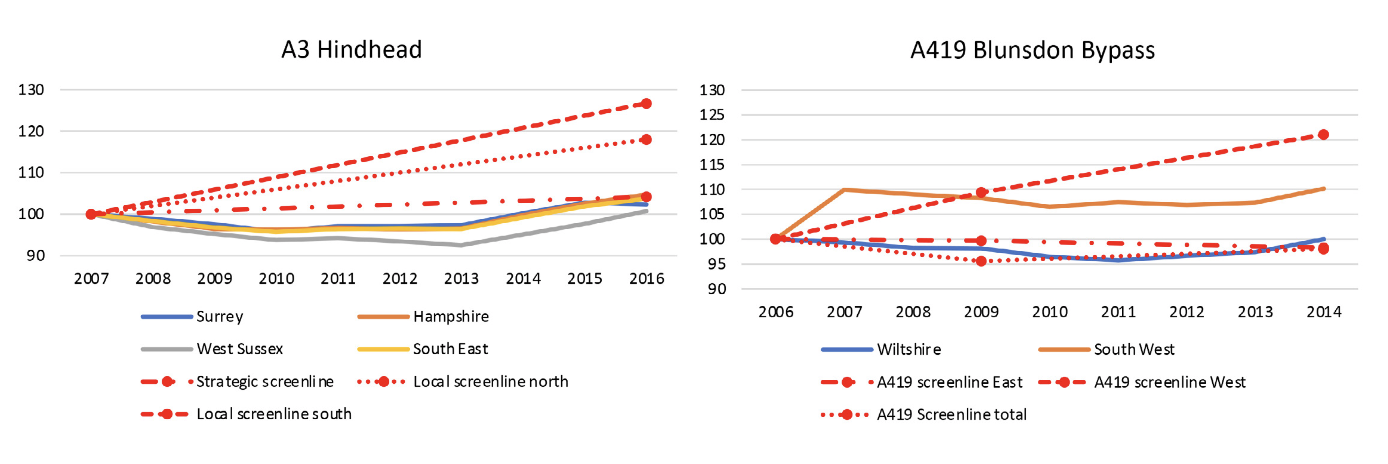
We have randomly selected one scheme from each region with a FYA report and compared the change in traffic five years after the scheme opened with the change in traffic locally and regionally over the same period[11]. Note that we have used the change in traffic across a screen-line to take account of any reassignment (e.g. from an old road to a new bypass). Many of the reports provide screenlines, but in a couple of cases we had to create them from the traffic figures given in the report. We have also redone the analysis of background traffic given in the reports, to match the dates of the screen-line analysis, for a better like-for-like comparison. Note that generally the POPE reports provide only 2 individual years of traffic data (one before, and one five years after) for the screenlines, compared to annual data for the background traffic.
The list of schemes and the results are shown in Table 1 and Figure 1 on the following pages. These opened between 2008 and 2012 and generally involve road widening (dualling of single carriageways or conversion of dual carriageways to motorways), dual carriageway bypasses and new or widened motorway junctions. Figure 1 shows the screenlines as red dashed or dotted lines.
MAJOR ROAD SCHEMES AND THEIR TRAFFIC IMPACTS: A SAMPLE ANALYSIS
One scheme was randomly selected from each region to show the change in traffic five years after it opened with that experienced in traffic locally and regionally over the same period. Traffic counts across screen-lines were used, adjusted as necessary to achieve best possible like-for-like comparisons. The list of schemes and the results are shown in Table 1 and the following figures. They opened between 2008 and 2012 and generally involved road widening (dualling of single carriageways or conversion of dual carriageways to motorways), dual carriageway bypasses and new or widened motorway junctions.
Table 1: List of major road schemes with Five Year After evaluations randomly selected from each region
-
(a) Note that POPE FYA reports are often published on the DfT or National Highways website much later than five years after opening.
-
(b) No screenlines were given in the report but we created our own screenlines based on traffic counts given at various sites in the report. The Northern screenline comprises traffic flows on A1 Jn 51, A684, A6055 north of Green Gate and Leases Rd while the Southern screenline comprises traffic flows on A1 Jn 50, A6055 north of Holme Beck, B627, A61 south of Wilde Ho¬¬we Lane, A168 north of Topcliffe Slip Rd and A167.
-
(c) The possibility of induced traffic is acknowledged in the POPE report. No screenlines are given in the report but we created our own screenline based on traffic counts given at various sites in the POPE report. The southern screenline comprises traffic flows on A46 new (site 2), A46 (old) between J15 & B4463 (site 4) and A429 south of J15 (site 7)
Figure 1: Charts showing change in traffic across screenlines before and five years after scheme opening and change in local and regional traffic over the same period
We strongly consider that the revised National Policy Statement, as currently drafted, presents a limited and misleading summary of the evidence from national networks on induced traffic, and thus does not properly address the matter of the carbon implications of new road schemes, generated through the additional traffic which will follow from them, and is underacknowledged in scheme appraisal if the induced traffic is itself underestimated.
This shows that out of 8 randomly selected major schemes, there is clear evidence of induced traffic for four schemes (A1 Dishforth to Leeming; A46 Newark to Widmerpool; M40 Junction 15; and A421 Bedford to M1 Junction 13), possible evidence for two schemes, and no evidence for two schemes. In some screenlines the increase in traffic was 10 percentage points higher than the local/regional growth. Generally, the possibility that the increase may be due to induced traffic is not explicitly acknowledged, though in the case of the M40 J15 (Longbridge Roundabout), the POPE FYA report notes that observed flows north of J15 increased by 13%, and states “Additional traffic flows along the A46 could be a result of induced traffic capitalising on the scheme benefits outlined at OYA.”
One of the conclusions of the 2018 DfT review was “The evidence on the existence of induced demand means that it needs to be properly accounted for in appraisal of capacity improvements to the Strategic Road Network.” We strongly agree with this conclusion, and consider that the revised National Policy Statement, as currently drafted, presents a limited and misleading summary of the evidence from national networks on induced traffic, and thus does not properly address the matter of the carbon implications of new road schemes, generated through the additional traffic which will follow from them, and is underacknowledged in scheme appraisal if the induced traffic is itself underestimated. The implication of a more balanced consideration of the evidence is that capacity improvements would be identified as potentially leading both to a reduction in the (temporary) relief from congestion, and an increase in carbon, air quality and other impacts. This would seriously undermine some of the key drivers of the need for development, including maintaining network performance and meeting customer needs; supporting economic growth and supporting the Government’s environment and net zero priorities, which the NNNPS is to address.
Conclusion
In summary, a serious look at five main bodies of evidence leaves little room for doubt about the importance of induced traffic: These are the 1994 SACTRA study; the study for CPRE in 2006; the 2017 Transport for Quality of Life analysis of Highways England’s own empirical data on traffic flows one year and 5 years after road expansion published up to 2017; the 2018 review carried out for the DfT by WSP and Rand Europe; and the new analysis we report here, again from Highways England’s own traffic counts, of a sample of their road schemes which were published after 2017. They all show that induced traffic was, and remains, a significant issue in the appraisal of road capacity increases. To say that this evidence is ‘limited’ is professionally and technically misleading, and risks flawed, but avoidable, decisions in the application of public policy. A document as important as the revised NNNPS should surely not be approved with such shortcomings.
References and Links
-
The Standing Advisory Committee on Trunk Roads Assessment (1994) Trunk Roads and the Generation of Traffic. Report for DfT, Chairman Mr D A Wood, QC, December 1994
-
Goodwin, P (1996) Empirical evidence on induced traffic: a review and synthesis, Transport Reviews 23, pp 35–54 (1996).
-
Goodwin P (2006) Induced traffic again. And again. And again. Local Transport Today, 24/08/06
-
Matson L, Taylor I, Sloman L and Elliot J (2006) Beyond Transport Infrastructure: Lessons for the future from recent road projects. Report for CPRE, July 2006
-
Sloman L, Hopkinson L and Taylor I (2017) The Impact of Road Projects in England. Report for CPRE, March 2017
-
DfT (2023) Draft National Policy Statement for National Networks. Consultation document, March 2023
-
WSP and Rand Europe (2018) Latest Evidence on Induced Travel Demand: An Evidence Review. Report for DfT, May
-
WSP and Rand Europe (2018) Latest Evidence on Induced Travel Demand: An Evidence Review. Report for DfT, May
-
https://www.gov.uk/government/collections/post-opening-project-evaluation-pope-of-major-schemes
-
https://nationalhighways.co.uk/our-roads/post-opening-project-evaluation-pope-of-major-schemes/
-
The POPE reports provide traffic figures in terms of traffic flow (Average Annual Weekday Traffic) while the local/regional traffic figures used were annual total vehicle km, which were both indexed to the same ‘before scheme’ year for comparison.
Acknowledgements
This paper is adapted from a submission to the House of Commons Transport Select Committee inquiry on NNNPS revision. Thanks to Chris Todd of the Transport Action Network for his helpful comments on this submission.
Lisa Hopkinson is a freelance consultant with over 30 years experience of research in the environmental field. She is an Associate at Transport For Quality of Life, which offers expertise in sustainable transport research, policy and best practice.
Professor Phil Goodwin is Emeritus Professor of Transport Policy, University College London and University of the West of England. He was head of the Transport Studies Unit at Oxford University for 16 years, before moving to UCL in 1996.
This article was first published in LTT magazine, LTT871, 19 June 2023.
You are currently viewing this page as TAPAS Taster user.
To read and make comments on this article you need to register for free as TAPAS Select user and log in.
Log in