TAPAS.network | 12 June 2025 | Commentary | John Siraut
Bus reliability- a problem that undermines the attractiveness of services, though solutions are available

The quality of bus services relative to private transport is a key determinant of their use, and therefore modal choices. Journey speed and reliability are in turn significant characteristics in users’ perceptions of the attractiveness of buses. looks at the data, and the potential measures that can enhance the bus offer
Buses are the dominant mode of public transport in Great Britain, with around 4 billion journeys annually. Buses were, however, in their heyday around 1950, carrying over 16 billion passengers. There was then a significant decline in usage by three quarters as car ownership and usage rapidly grew during the latter half of the 20th century (figure 1), though patronage has remained relatively steady since the 1990s, partly due to increased bus use in London balancing declines elsewhere.
Recovering from the big drop brought by the impacts of COVID in 2020 has taken several years, but use is generally now back at or near to the 2019 levels in many places.
Figure 1: Local bus, trolleybus and first generation tram journeys (millions)
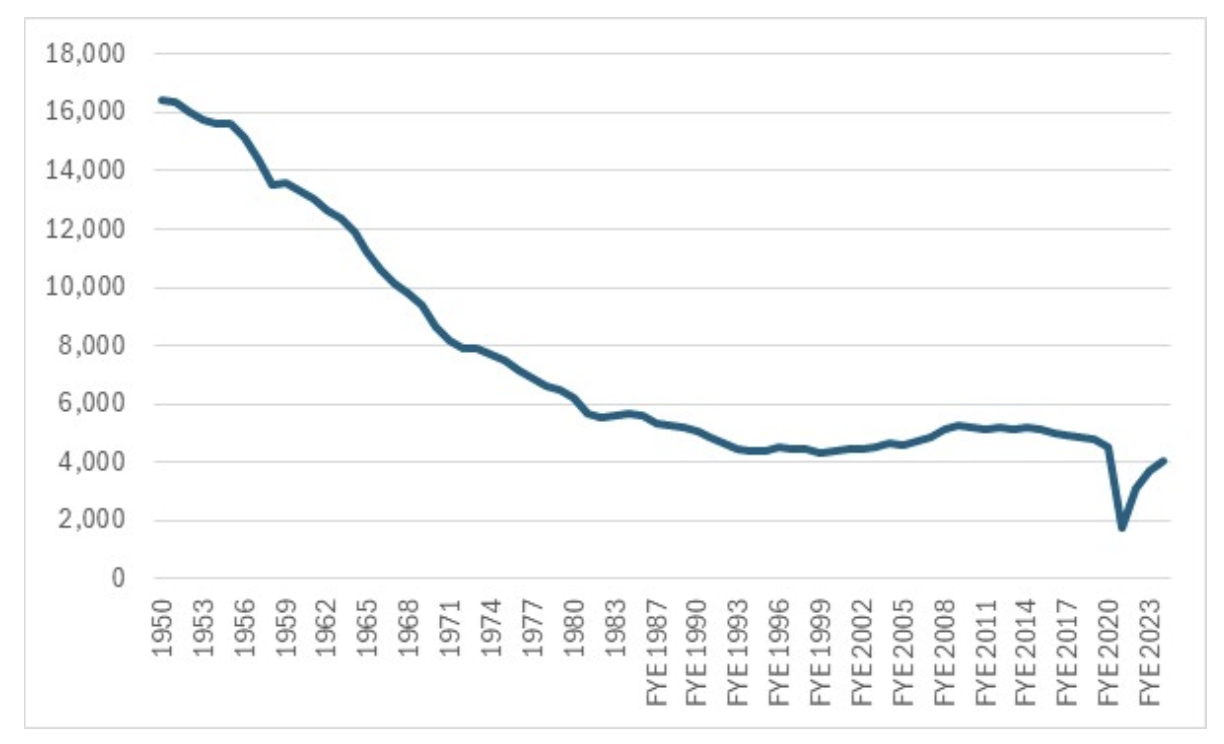
Source: https://www.gov.uk/government/statistics/transport-statistics-great-britain-2024
Besides the obvious link to the car travel, there are many reasons for why bus patronage has declined while the use of rail has more than doubled since the 1990s. A major reason appears to be a less attractive bus product due to changes in reliability and journey times. Slower and unpredictable buses result in fewer passengers. Transport for London reports a 6% loss in passengers for each 10% increase in bus delays, while other research suggests losses of up to 10% per 10% increase in journey times.
Bus speeds are a factor of traffic congestion, as well as dwell times at bus stops. The latter has often been extended outside London by the use of single door buses, graduated fares and payment to the driver by cash. Pulling away from stops is also disrupted by general traffic an issue made worse by the increasing preponderance of street works and greater pressure on the kerbside by parking, deliveries and service vehicles etc. As traffic congestion varies throughout the day, so do bus journey times. Most bus operators now advertise different journey times based on the time of day, reflecting changes in congestion levels.
Figure 2 shows average end-to-end timetabled journey times as an index, with 5am journey times set at 100, for three high frequency routes in each of Brighton, Bristol, Edinburgh, and Leeds at five different times of day.
Figure 2 Index of average bus journey times by time of day 5am=100
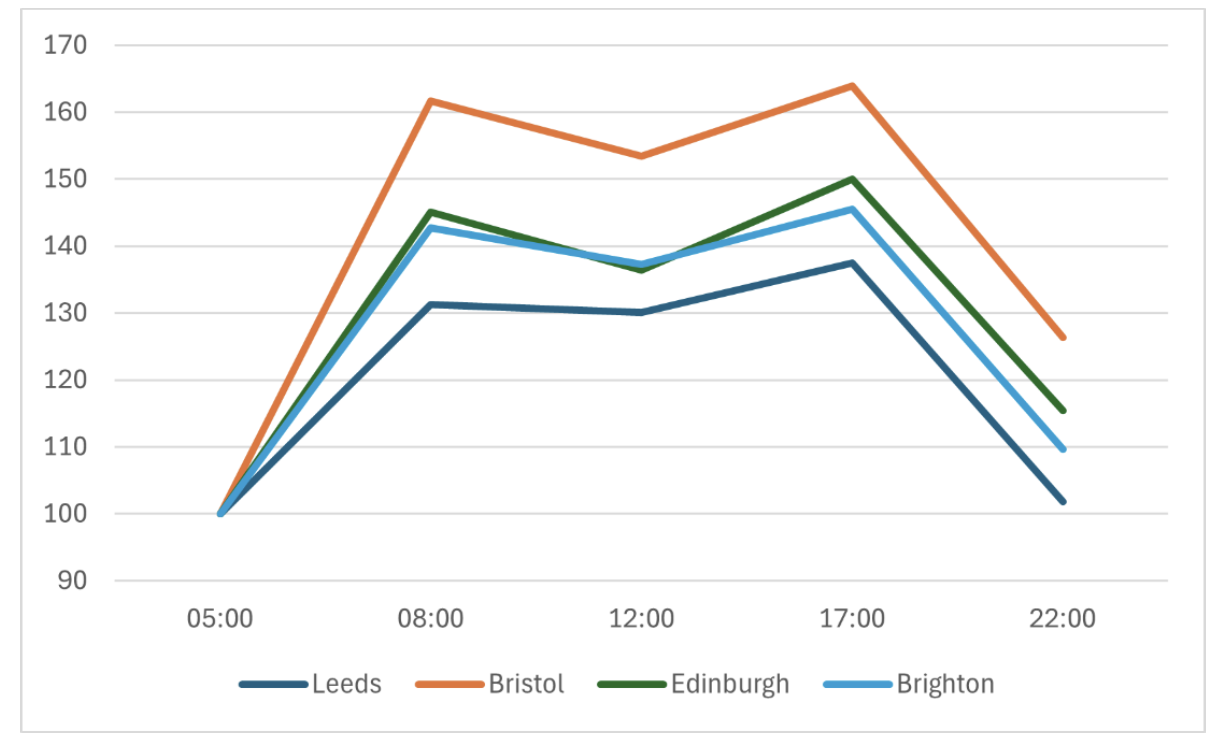
Source: Jacobs’ analysis based on individual bus operators’ timetables
The data has been obtained by examining published timetables. At 5am, traffic is generally free flowing, so bus services at this time offer the fastest timetabled journey times. By 8am, timetabled journey times increase by 30-60% due to higher traffic congestion and longer dwell times from higher loadings. However, there is little reduction in timetabled journey times at midday when one would expect lower loadings, and timetabled journey times are extended again during the evening peak. By 10pm, timetabled journey times reduce but in the case of Bristol remain a quarter longer than at 5am.
In fact Bristol stands out amongst the four cities as having the largest differential between timetabled journey times at 5am and during the rest of the day.
Using data from London Bus Routes (http://www.londonbusroutes.net/index.htm) it is possible to see how timetabled journey times have changed in London not only by time of day but over the last 20 years.
Three high frequency bus routes, which have kept the same routes over the time period, were analysed.
Figure 3 shows how timetabled journey times vary during the day compared with the situation at 5am. The pattern is the same as that shown in figure 2 but even more pronounced. Despite factors in London that should reduce dwell times, such as two-door operations and the cessation of cash acceptance on board since 2014, daytime timetabled journey times are 40-80% worse than at 5am. By 10pm, there is notable improvement, but times are still 10-20% higher than at 5am. It is also notable that over time the difference from 5am has increased, with, for example, evening peak timetabled journey times in 2025 being 80% longer than at 5am, compared to 50% in 2003.
Figure 3 Index of average bus journey times by time of day 5am=100 - London
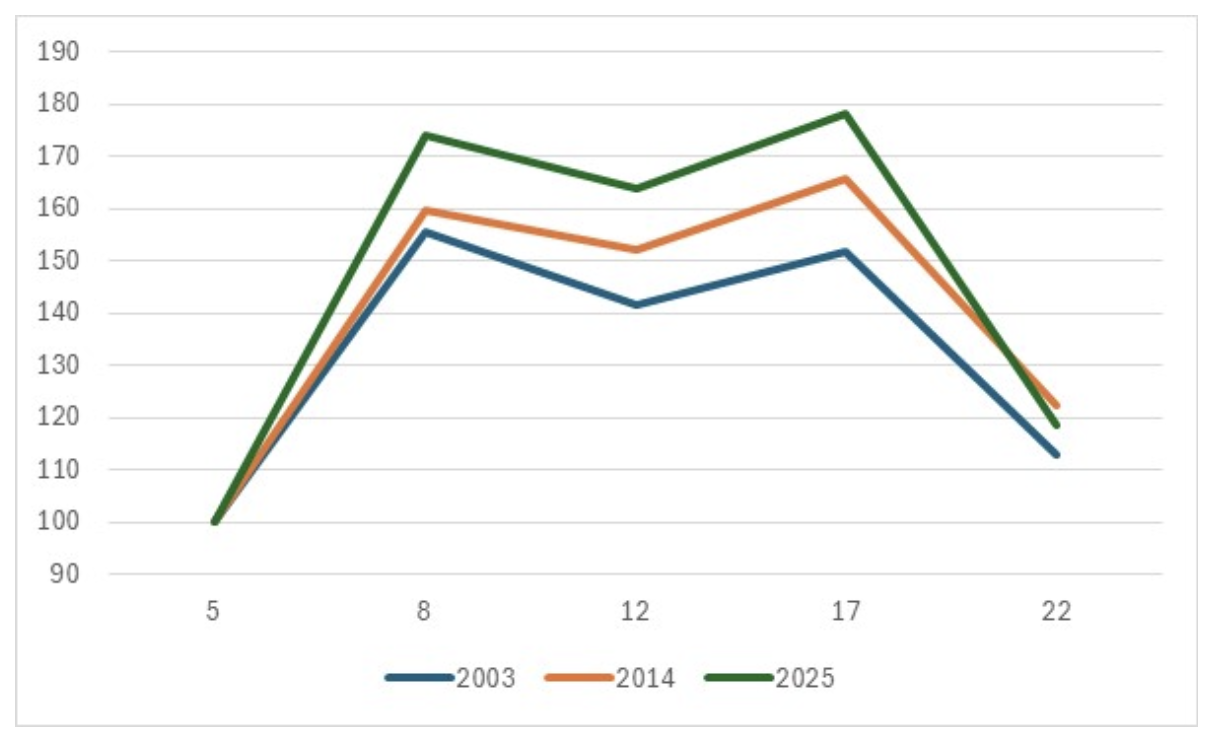
Source: Jacobs’ analysis of http://www.londonbusroutes.net/index.htm
The same data set also reveals changes in timetabled journey times over time. Figure 4 shows that average timetabled journey times for the same three London bus routes have increased over the last 20 years. Even at 5am, timetable journey times have risen by 10%, while middle of the day times have increased by up to 30%.
Figure 4: London index of timetabled journey times 2003=100
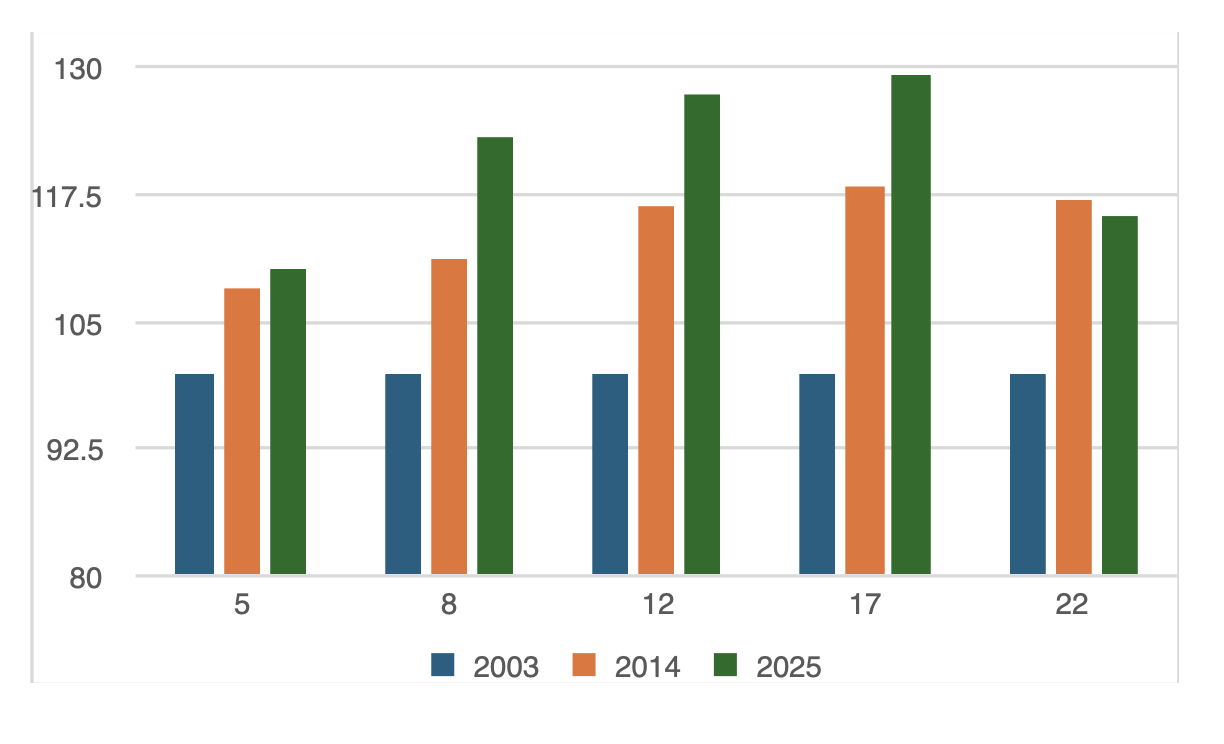
Source: Jacobs analysis of http://www.londonbusroutes.net/index.htm
While this analysis is not statistically robust, assessing just three randomly chosen routes in each location, the results are likely to be representative of bus routes across the country. Slower bus journeys result in fewer passengers and either higher operating costs to maintain headway or less frequent services with the same number of buses.
Possible exceptions are where comprehensive bus priority measures have been implemented such as dedicated bus lanes and smart signalling systems (eg UTMC and bus activated traffic signals).
This analysis has so far looked at timetabled journey times. Despite efforts by bus operators to amend timetables to reflect traffic congestion, daily traffic conditions vary, leading to significant variability in timetable reliability.
The analysis of bus reliability by Tom Forth has highlighted not only the level of unreliability of bus services, but its impact.
The Economist noted that
“Tom Forth, a blogger, is one of Britain’s most influential wonks, largely owing to his part-time posting (which he does alongside his job at the Data City, an ai startup in Leeds). Mr Forth’s criticisms—that the government spends far less on research and development in northern England and the Midlands than the private sector does, and that Britain’s second-tier cities are held back by lousy public transport—are now the norm in policy land”
Bagehot, Economist 30 November 2023 https://www.economist.com/britain/2023/11/30/how-to-change-the-policy-of-the-british-government
It was his work on journey time variability by bus and tram in Birmingham that highlighted why UK cities, that tend to provide bus-based public transport, fare worse economically than continental rivals with tram or light rail services. Figure 5 shows the familiar pattern of timetabled journey times for bus services increasing from around 18 minutes at 5am to 30 minutes at 8am. Notably, from 7am to 6pm, actual journey times are even longer, with some journeys taking up to 20 minutes longer than timetabled. This variability makes it difficult for operators to timetable such journeys accurately.
In contrast, trams, which are mostly segregated from road traffic, have consistent timetabled journey times throughout the day. Although actual tram journey times are slightly longer than scheduled, except during the evening peak, they remain constant throughout the day.
This has major implications for the size of labour catchment areas. For someone prepared to spend 30 minutes commuting to work, the tram consistently delivers that no matter what the time of day. In theory, buses should deliver that too, however, in reality they often don’t and users are aware of this.
If you have a job that starts at a fixed time, you build that unreliability into your schedule. For example, if you need to be in work by 9am, the 8.30am bus should get you there on time. However, it often takes 40 minutes, so you opt for the 8.15am bus instead. This turns your 30-minute commute into 45 minutes, complicating tasks like dropping your children at school. Consequently, you might give up on the city centre job and take a lower-paying local job.
Figure 5. Journey time variability by bus and tram in Birmingham
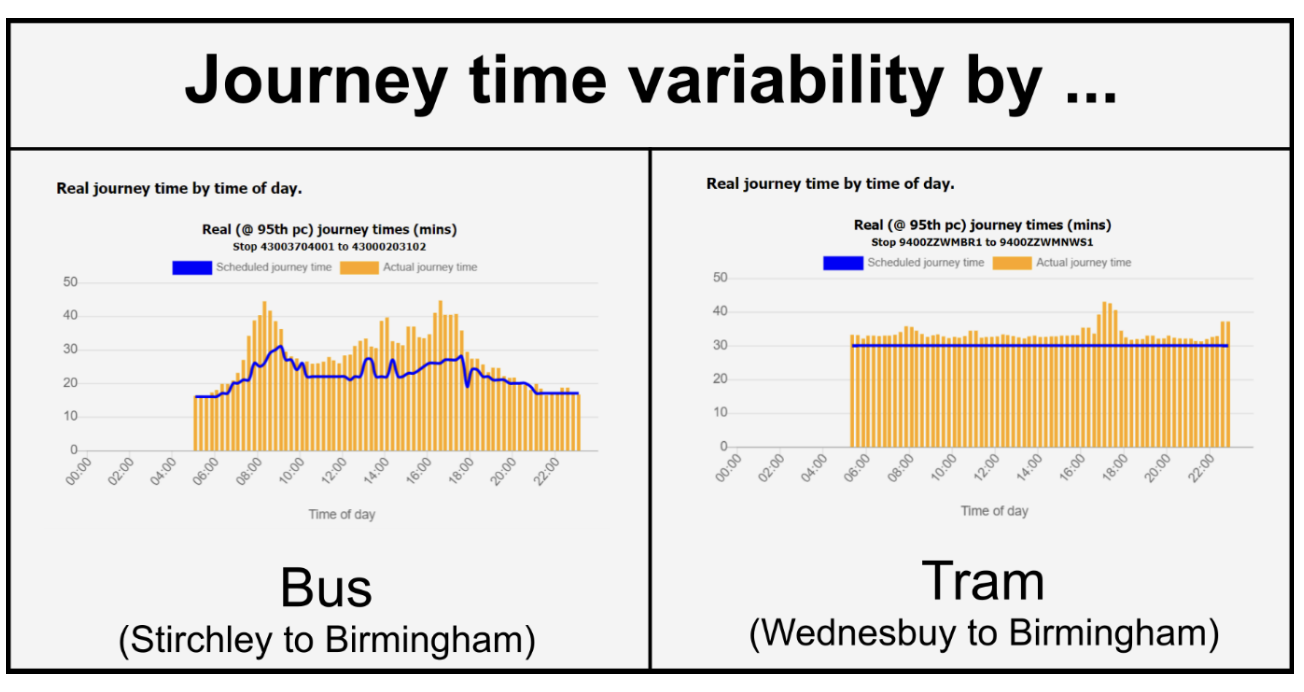
Source: https://www.tomforth.co.uk/birminghamisasmallcity/
Forth went on to show that city-wide bus service unreliability significantly reduces Birmingham’s labour catchment area, as shown in figure 6. During off-peak hours, 1.3 million people can reach the centre of Birmingham by bus within 30 minutes. However, during the morning peak, that reduces to 0.9m people. Conversely, if Birmingham had a tram network based on its major bus routes, 1.7m people could reach the city centre within 30 minutes throughout the day.
Figure 6 Population within 30 minutes of Birmingham city centre
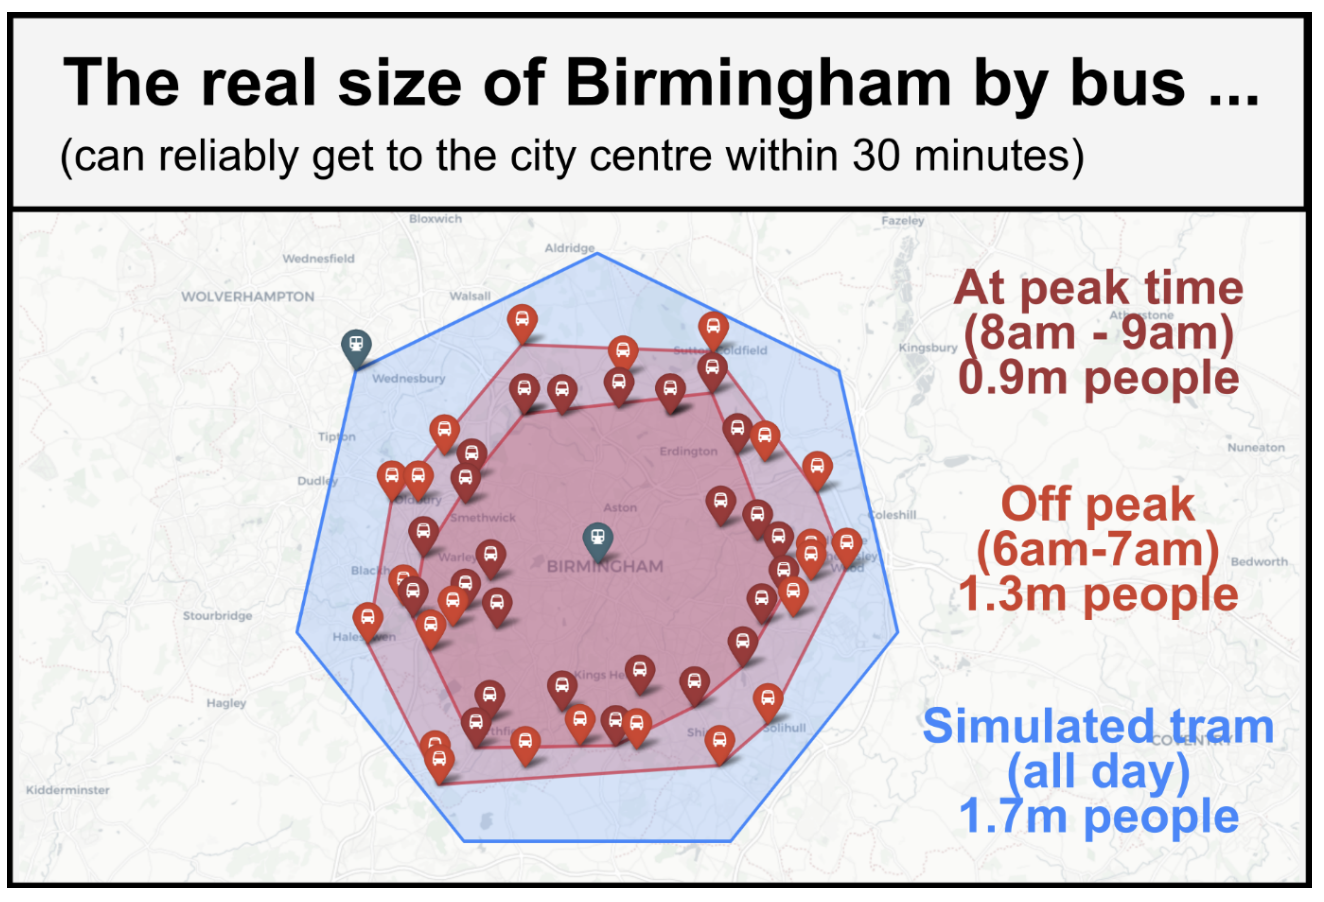
Source: https://www.tomforth.co.uk/birminghamisasmallcity/
Using the UK’s Bus Open Data Service, Open Innovations have developed a proof of concept, to assess bus reliability. At present, this is available for Yorkshire and Humber and the North West analysing a ten day period in September 2024. Full details can be found at https://open-innovations.org/. As September tends to be the busiest month for bus patronage, reliability may be worse than usual due to higher dwell times.
Figure 7 shows the reliability on weekdays of the high frequency, 24-hour route number 43 bus linking Manchester Airport to Manchester Piccadilly Gardens. Up until around 6am actual and timetabled journey times are broadly similar. However, after around 7am journey times can be up to 20 minutes longer than timetabled. Even in the late evening, actual journey times often differ significantly from the schedule. Additionally, the degree of unreliability varies daily. For example, the 13.47 departure is scheduled to take 66 minutes, but on Monday it took 66 minutes, Tuesday 76 minutes, Wednesday 80 minutes, Thursday 66 minutes and Friday 82 minutes. Timetabling such daily variation is impossible.
While there is a 21 minute difference between the fastest and slowest timetabled journey, the difference for actual journey times is 57 minutes. By contrast, the tram service from Manchester Airport to the city centre is constant throughout the day despite a short amount of on-street running.
Figure 7 Real and timetabled journey time September 2024 - weekdays
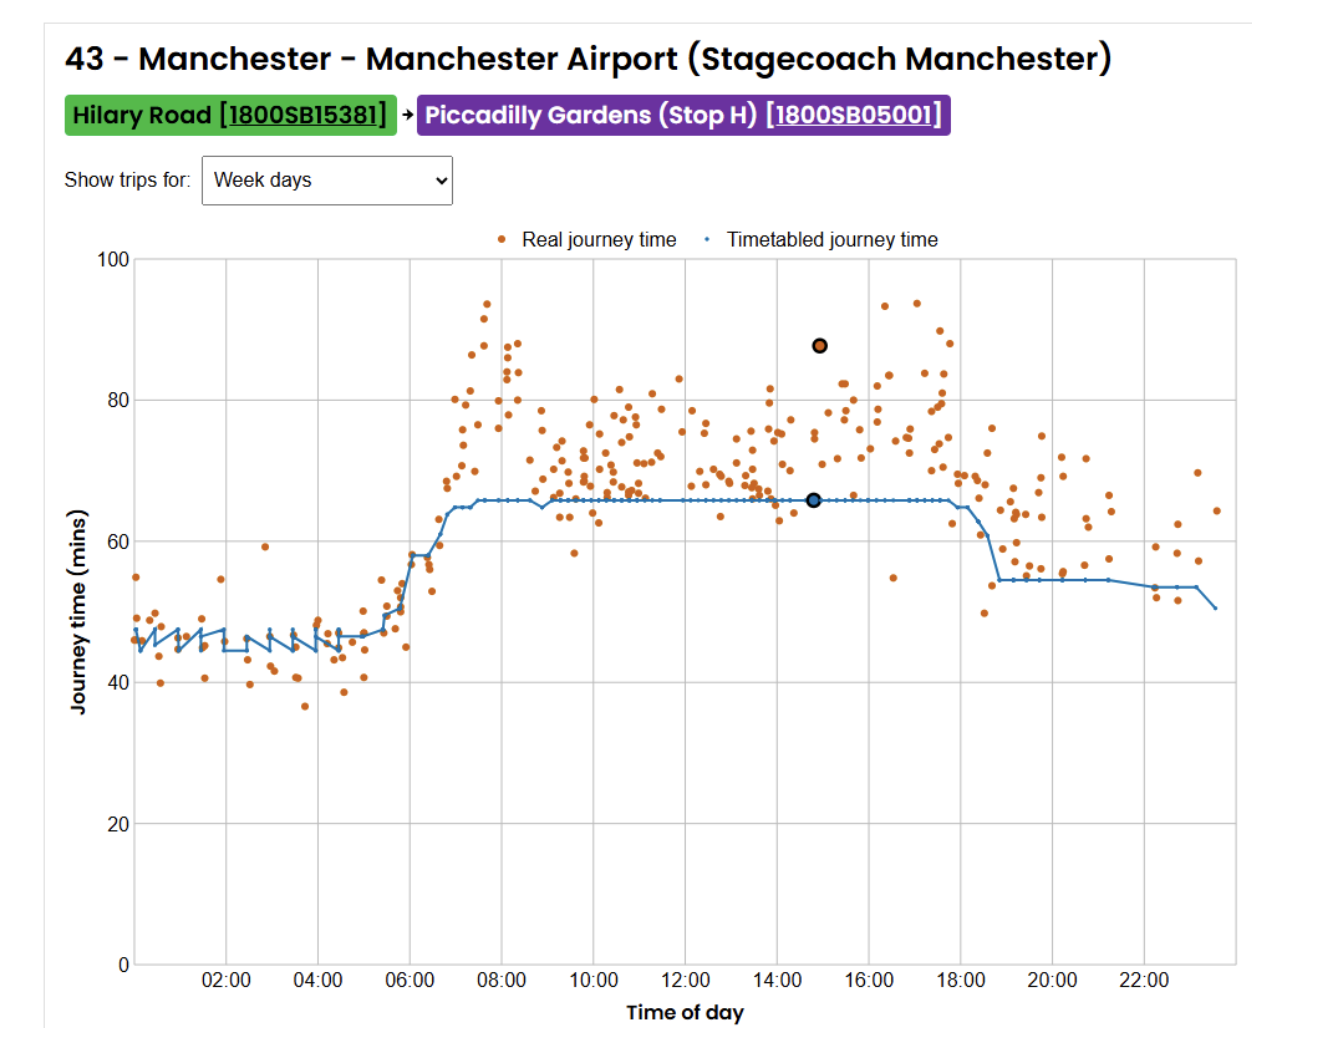
Source: https://open-innovations.github.io/bus-tracking/
The picture at the weekend is much better, with greater reliability throughout the day as shown in figure 8. Yet, timetabled journey times can still vary by as much as 20 minutes and actual journey times by 40+ minutes during the day.
Figure 8 Real and timetabled journey time September 2024 - weekdays
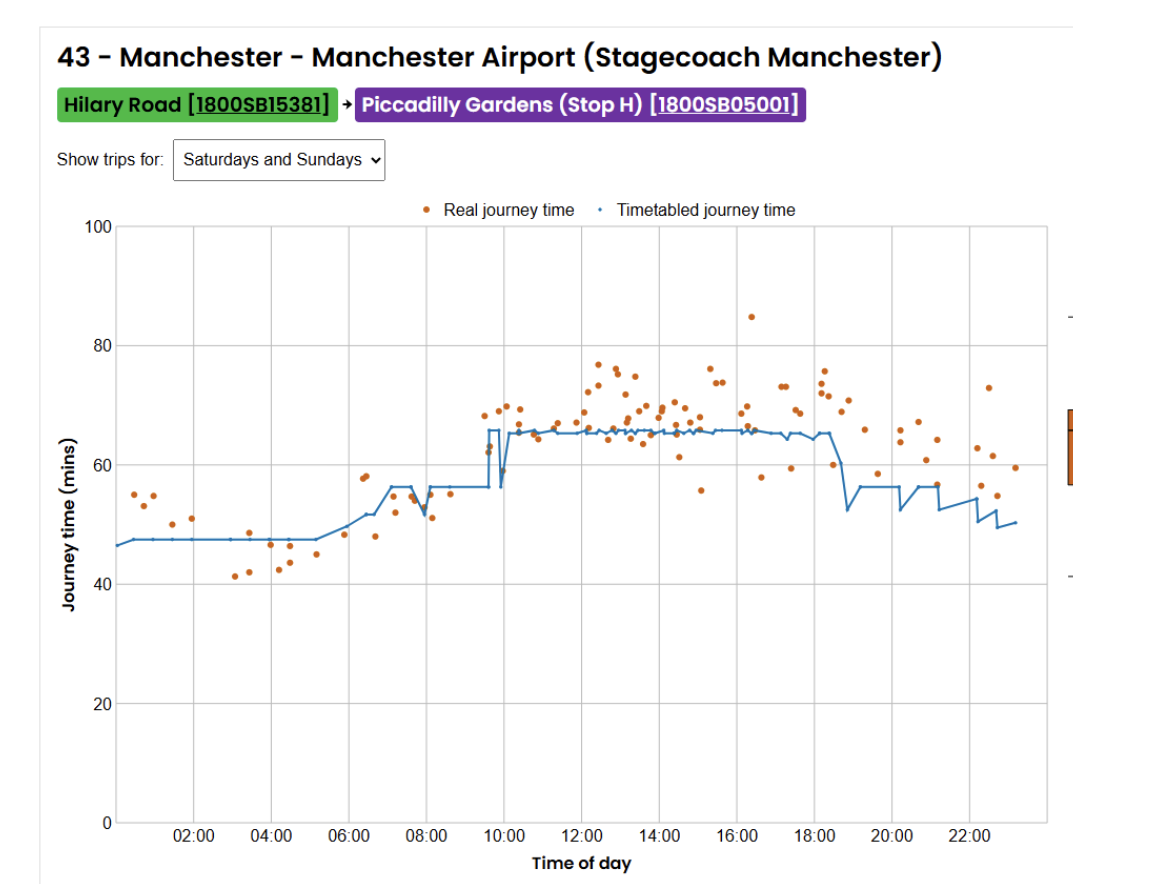
Source: https://open-innovations.github.io/bus-tracking/
As a number of oft-quoted examples demonstrate, addressing the problem of bus reliability is relatively straightforward, but involves pro-active interventions and financial and transport policy trade-offs.
Reducing congestion requires more segregated bus lanes, which can lead to complaints from motorists who see a reduction in road space. General decisions on the allocation of roadspace between modes – private cars, freight vehicles, buses, cyclists and others are also significant policy choices.
Additionally, reducing dwell times may require the return of two-door buses, flat fares or contactless tap in and tap-out payment systems. The design of bus stopping arrangements, both in the road as part of the traffic flow, and how passengers assemble on the pavement to get easily on board, are other matters within the scope of local transport and highway authorities’ competence, and enforcement powers, as is the regulation of streetworks, currently blamed by operators as a major cause of delay to their services.
The data reviewed in this article and charts can be found at:
John Siraut is director of economics at Jacobs.
This article was first published in LTT magazine, LTT917, 12 June 2025.
You are currently viewing this page as TAPAS Taster user.
To read and make comments on this article you need to register for free as TAPAS Select user and log in.
Log in