TAPAS.network | 8 August 2022 | Commentary | John Siraut
Working from home - a changing pattern

The Pandemic has brought about some significant changes to the ways people work, commuting flows and demand for transport capacity. But the situation varies by region, type of work, status level and gender says , as he looks into some of the detailed data.
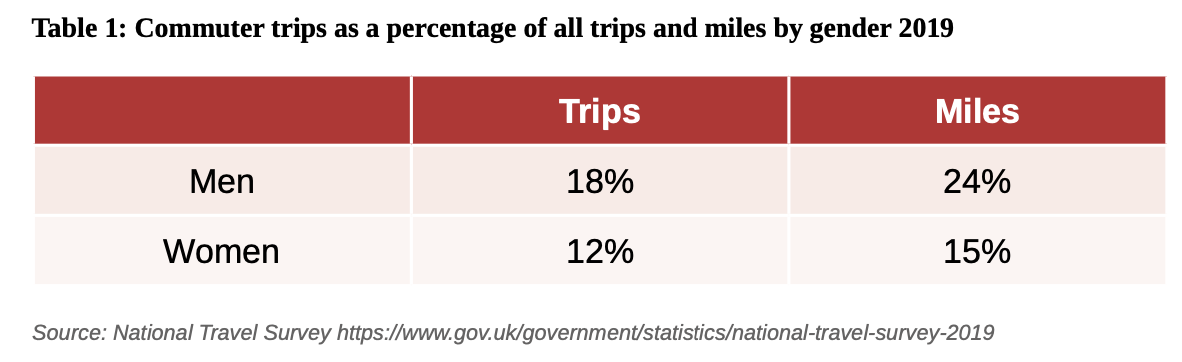
COMMUTING HAS TRADITIONALLY BEEN a significant proportion of trips made, and the miles people travel, as shown in table 1. Unlike most other trips, these are heavily concentrated at certain times of the day leading to congestion on the road network and overcrowding on public transport. However, these numbers are for 2019 and a lot has changed since then as we all know.
A significant number of people already worked from home for at least part of their working week long before the pandemic, and that number had been steadily rising over time. However, the pandemic accelerated that trend dramatically. It raised the numbers of both people working permanently at home and those who spend part of their working time at home and part in a particular place of employment. These ‘flexible workers’ now make up 70% of those to be found working at home.
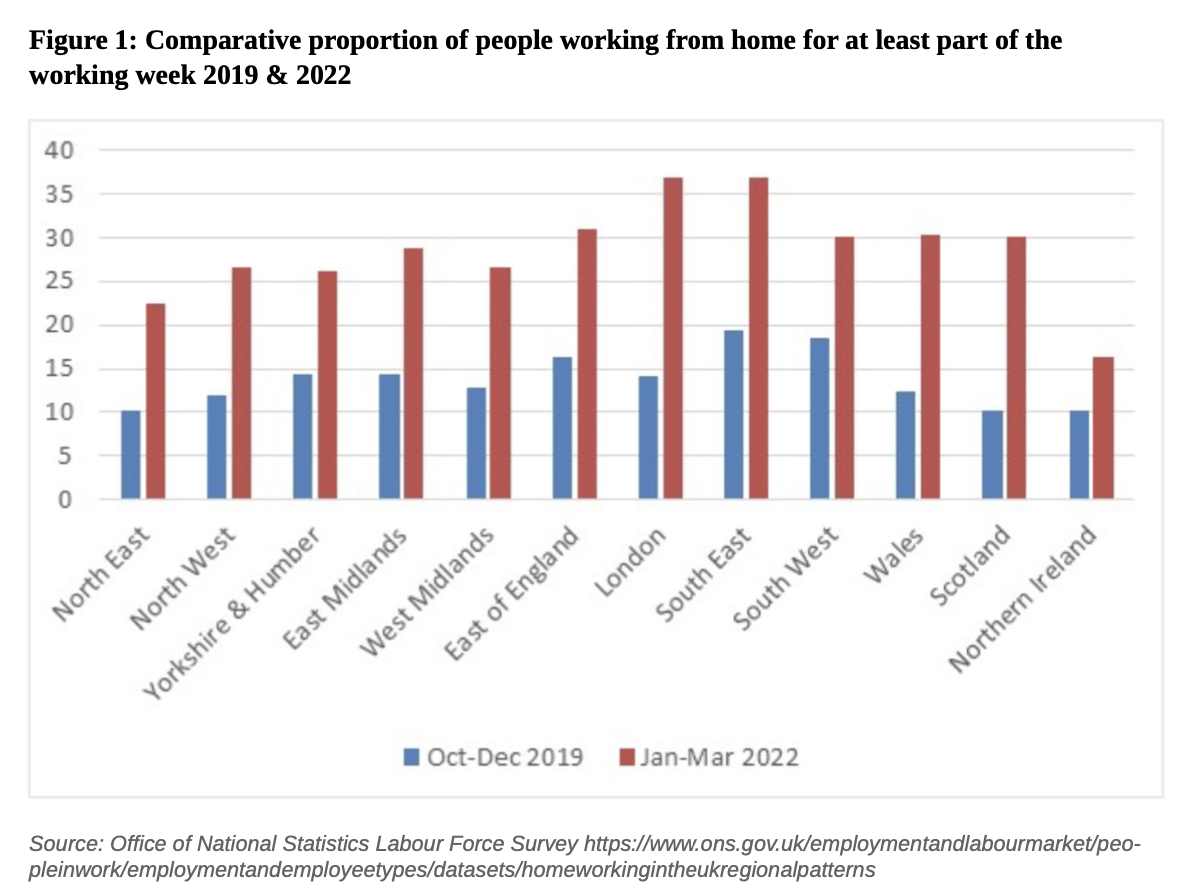
Figure 1 (below) shows the percentage of people who worked from home pre-pandemic and who does so now. Back in 2019 some 15% of the workforce worked from home, ranging from 10% in Scotland and the North East, to 20% in the South East. Now 30% of the workforce work from home, dominated by London and the South East where 37% do. London saw the biggest increase in home working - up 23 percentage points - with Northern Ireland seeing very little increase, and at 16% having the fewest proportion of home workers.
It may be that age and occupation are greater determinants of home working than gender.
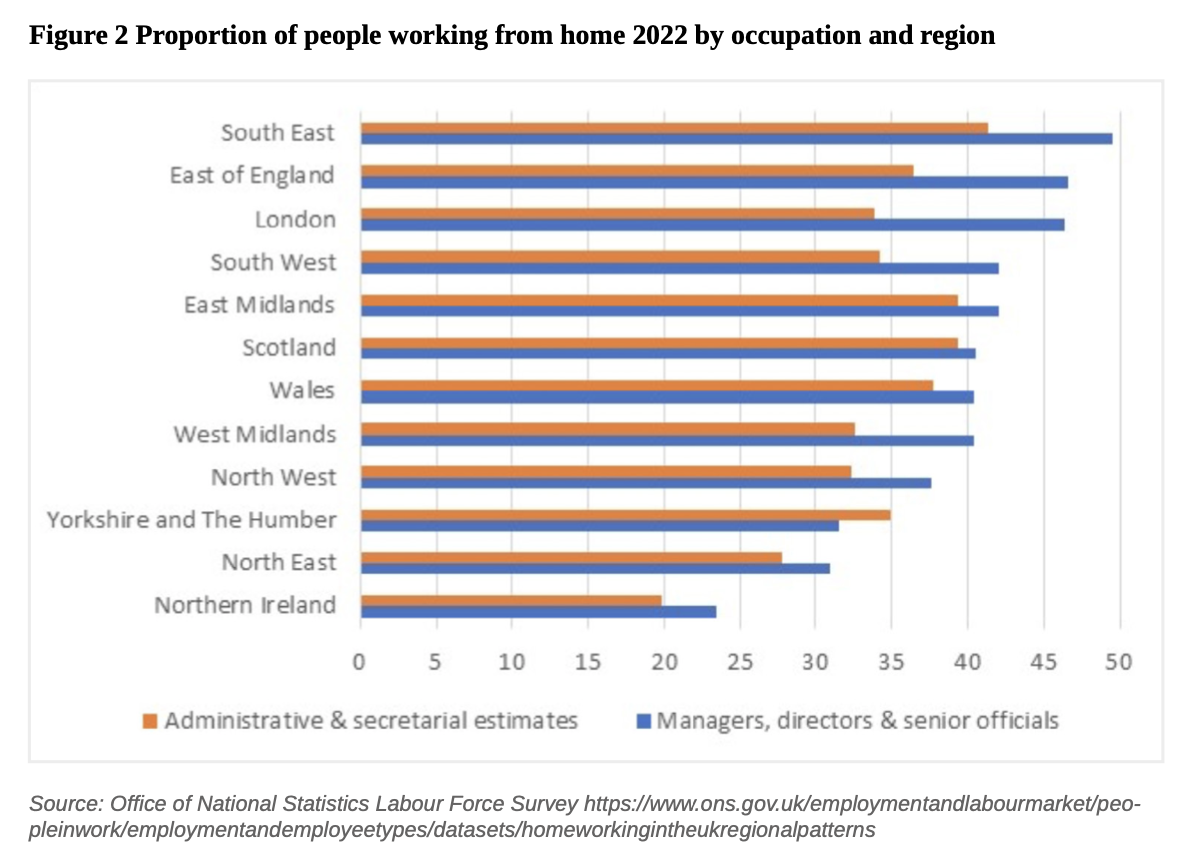
The ability to work from home depends of course on the nature of the job undertaken, and not surprisingly varies considerably. However, there are still large regional differences for those undertaking similar roles as shown in figure 2. While nearly 50% of managers in the South East work from home this falls to 23% in Northern Ireland. There is less regional variation amongst administrative staff apart from Northern Ireland again. Perhaps surprisingly London has one of the lower rates of home working amongst this latter group of administration workers.
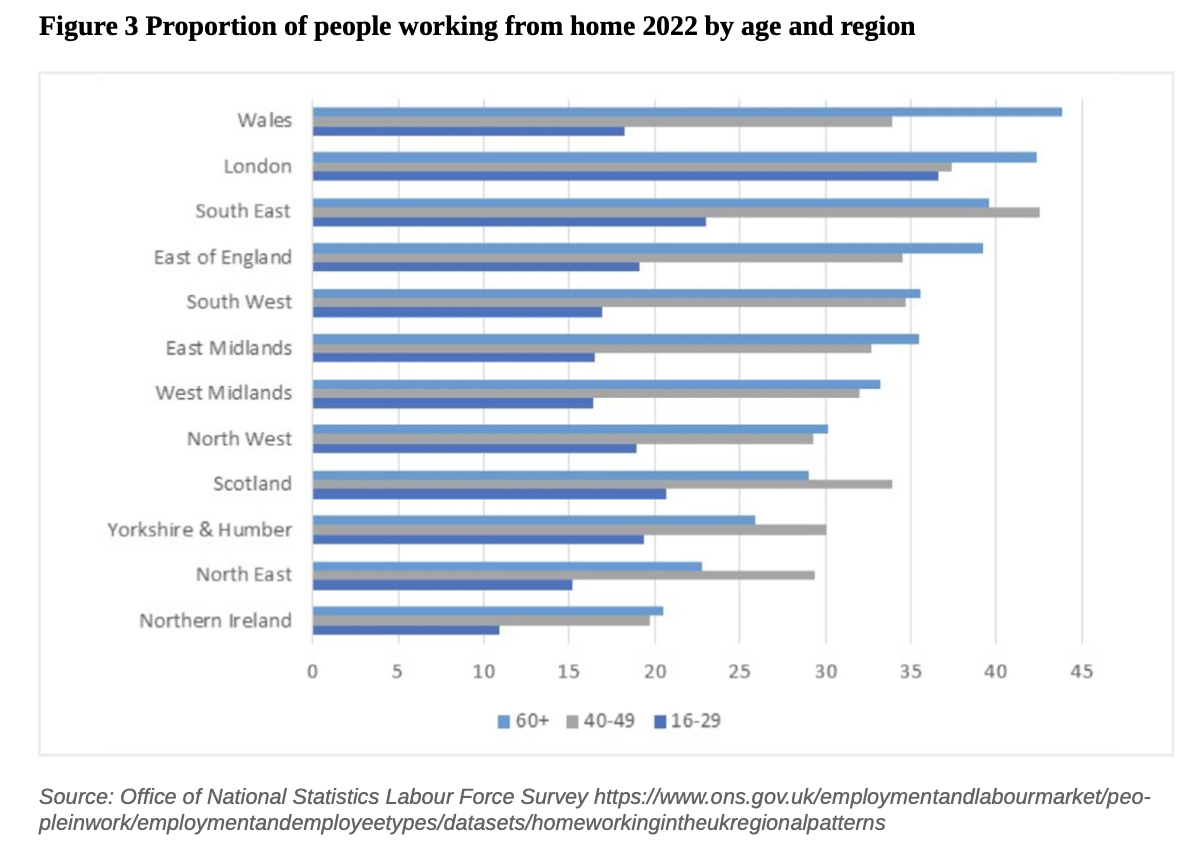
When it comes to age, there is again a fairly clear pattern in most regions, the message being that the older you are the more likely you are to work from home, (figure 3.) While nearly 45% of 60+ year olds are working from home in Wales, that falls to less than 20% for those aged under 30. London sees the least variation based on age and has by far the highest proportion of under 30s home working. This would suggest it’s not just the occupation and seniority that drives the level of home working, but other factors such as the cost of and time taken up by commuting.
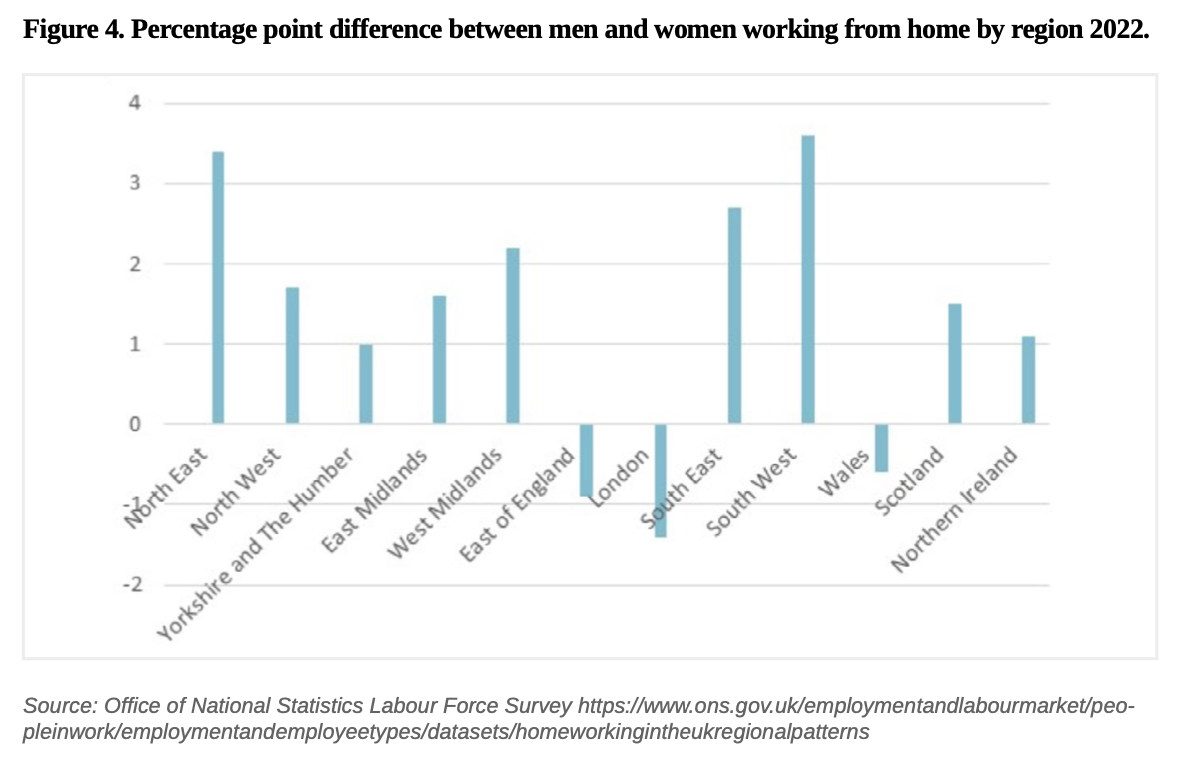
What about gender? In most regions men are more likely to work from home than women, although as shown in figure 4 the differences are not that great between the two. It may be that age and occupation are greater determinants of home working than gender. In the South West and North East the difference is three percentage points in relation to men compared to women working from home, while in the South East the difference is just 1 percentage point in favour of women.
26% of women working part time travel from home to work via another destination, most commonly a school. For men working full time this figure is just 9%.
Why Travel? Understanding our need to move and how it shapes our lives was published last year (2021) by Bristol University Press.
John Siraut is director of economics at Jacobs.
This article was first published in LTT magazine, LTT851, 8 August 2022.
You are currently viewing this page as TAPAS Taster user.
To read and make comments on this article you need to register for free as TAPAS Select user and log in.
Log in