TAPAS.network | 25 June 2025 | Commentary | Phil Goodwin
National Road Traffic Forecasts 1965-2025: Why did they become so inaccurate, and how can they be Improved?

Serious shortcomings in the traffic forecasts applied to decision-making in highway network development since 1989 have encouraged erroneous expectations of traffic growth, suggests Professor . Here he sets out his concerns and proposals for better approaches.
FOR AROUND 60 years, the Department for Transport and its predecessors have issued forecasts for the total amount of traffic expected to use the country’s roads, usually with a time scale of up to 35 years, extended to appraisal periods of double that length.
But for most of the last 35 years, these models have shown a distinct, systematic and repeated tendency to overpredict the growth in traffic, seriously. During this period, transport policy, planning and perspectives have been dominated by expectation of future decades in which national traffic growth would include between 50 and 100 billion non-existent vehicle miles per year over the politically salient period of the forecast, and continuing at that level or more for a lifetime thereafter. Every few years, the forecasts have needed to be ‘rebased’, ie revised down to fit the current actual traffic, with discrepancies attributed to recent changes in factors such as economic growth, or population. But the much larger errors in future traffic have continued.
In the last few years, the DfT has substantially reduced its ‘core’ forecasts of traffic growth, and also introduced a new official scenario among the many that it uses to allow for inevitable uncertainty in prediction. The new one, called ‘Behavioural Change’, has taken account of much research on changes in travel behaviour, including choices made since the early 1990s, in successive cohorts of young people. This scenario incorporates changes in recent trends in travel behaviour, and forecasts a different picture of future possibilities, ranging from continued growth but closer to actually seen levels, to an actual reduction in car traffic. This will help provide a realistic framework for appraisal of policy and transport projects, with outcomes which remain open, realistic, and subject to change as a result of policies.
None of this discussion has allowed for the effects of new policies on traffic growth itself, or the effects on transport of significant deterioration of climate conditions.
Phil Goodwin[1]
Introduction
To avoid misunderstanding, I should say that the forecasts I am writing about here are not about the important questions of what level of traffic we ought to provide for, or aim for, or the policies and projects that should be adopted to achieve objectives on the social, economic, and environmental impacts of transport (though they have implications for all of these), or the appraisal of what their impacts will be.
Rather, the forecasts are official views about what are sometimes called the ‘underlying trends’., that is, those which are expected to occur without taking account of the effects of any future projects or policies other than those already committed, or worsening environmental conditions. They are used for a wide variety of purposes, some of which are very sensitive to whether the forecasts will turn out to be inaccurate, whatever the cause.
As a general pattern, forecasts will tend to look very accurate for their first few years. Discrepancies worth bothering about generally appear after 3-5 years or so, and a revision is put in. But they are for periods of 20-35 years ahead, increasingly inaccurate, and then continue at a stable or somewhat increasing level, without detailed modelling, throughout the appraisal calculations which for major roads are for 60 or 100 years. Since the start of an appraisal period, shortly after the expected opening date of a new scheme, may be at least five years after the date of the forecast, and may be 15 years or more, the most influential period of the forecasts will be in the middle and later years of validity, when the forecasting errors are at the highest, and by which time they will have been replaced by several later forecasts.
Since the earliest forecasting, ‘high’, ‘low’ and ‘central’ forecasts have usually been provided, reflecting an acceptance of uncertainty. The high forecasts are potentially very important for safety margins in testing engineering adequacy, and environmental dangers, but there has not been a single period when the actual traffic has been close to the high figures, and they are not the main focus of this paper The central ones are used for economic appraisal, and usually treated as though they were the ‘most likely’ outcome. The low ones have usually been ignored, though actually even they have tended to be overestimates.
Traffic since 1950
The actual amount of traffic per year, measured by traffic counts, (and subject itself to some inaccuracy) is shown in figure 1.
Figure 1: All vehicle traffic, Great Britain, billion vehicle miles per year, 1950 to 2024
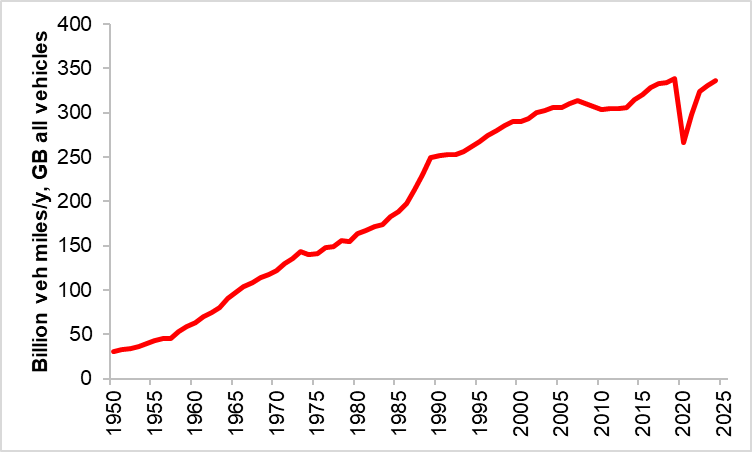
(Source: 1997 Road Traffic Forecasts for dates 1950 to 1992; DfT TRA0106 for dates 1993 to 2023; and DfT TRA2501a for 2024)
Early forecasts
A formal apparatus of analysis of national traffic forecasting was developed by the Government’s Road Research Laboratory, RRL, in the 1950s (initiated by Glanville and Smeed (1958)[2] and the statistician John Tanner (1965, 1977) [3] [4], who proposed a long S-shaped growth curve, with an upper saturation level which was derived from data on the current behaviour of the richest people and the richest areas. The speed at which car ownership and traffic approached this limit was thought to be influenced by incomes and (less so, at that stage) by prices.
Tulpule (1974)[5] applied these and his results were later compared with the outcome traffic levels . Figure 2 shows the results.
Figure 2: Car Traffic 1970-2010, Tulpule’s Forecast from 1972 Base, and Actual,
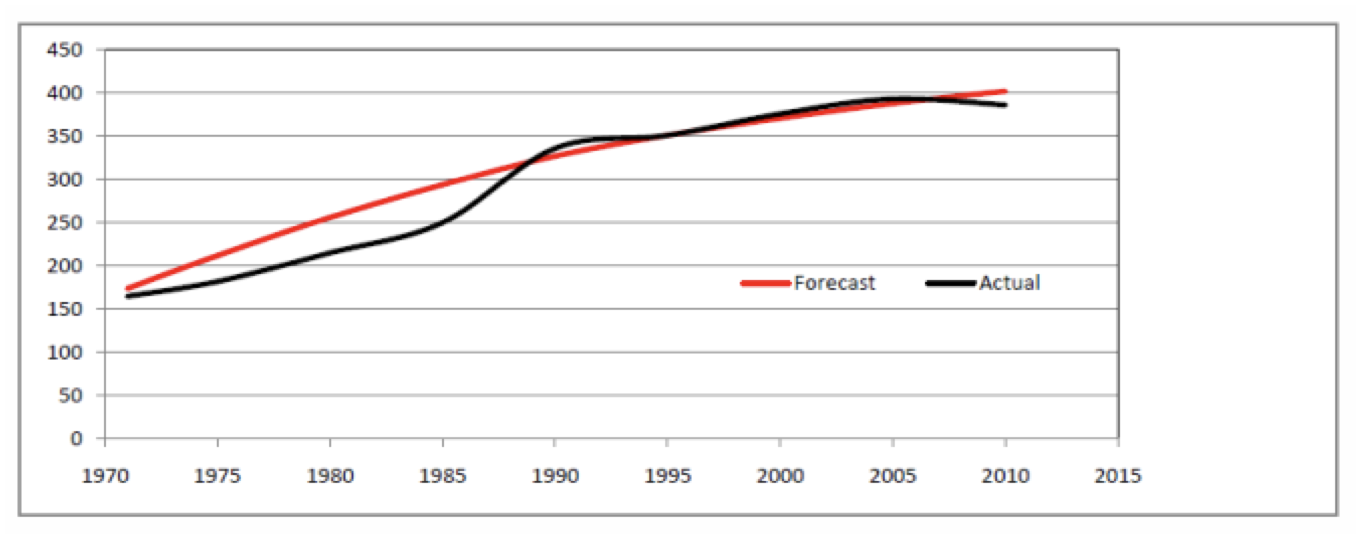
One would think that the RRL team would be quite proud of how close the forecast was to the actual figures in the long run. However, in the short run there was much official discontent about the unreliability and unsuitability of the forecasts. In 1976 the Department of Transport set up a committee of inquiry, ACTRA[6], which recommended development of a completely new method based on what were called ‘causal’ relationships. A massive modelling exercise involving many consultants and academics, was launched and a new model called RHTM was swiftly developed, but it was described as a failure and abandoned in 1979 or 1980. It was said at the time that a report on that failure was ‘being printed’, but as far as I know it was never published, and it was never officially stated what the nature of the failure was, though there is a good review of the evolution by van Vuren et al (2001)[7].
Thus, within one decade a new model had been adopted, used, reviewed, assessed, found wanting, abandoned, a completely new procedure planned, developed, found wanting, and abandoned. It was replaced by National Road Traffic Forecasts using a combination of mostly aggregate relationships, trends and ad hoc judgements, and then an alternative track initially based on a rather pragmatic and less ambitious methodology, which grew into what became known as the National Transport Model (NTM)[8] and has been incrementally revised ever since. It is now a very substantial piece of computing, but which is not in the public domain, nor accessible for use by outside or independent agencies.
There were some temporary forecasts, until methods taken as acceptable were made in 1984, but it produced very large underestimates, and was amended again in 1989[9]. Subsequent forecasts were produced every few years using a similar general approach, with successively more detail, and discussion of some lessons that could be learned from earlier forecasts. Broadly the same approach was adopted until 2015, when it was augmented by another model as discussed later.
In an important paper, though little noticed at the time, Roger Mackett (1998)[10] reviewed all the national traffic forecasts from 1965 to 1989, comparing them with the actual traffic by 1995. I have as far as possible done the same for all the subsequent forecasts up to 202[11], compared with the actual traffic by 2025 (provisional), compiling his and my results together into Table 1.
Table 1: Successive traffic forecast/projections showing their subsequent accuracy
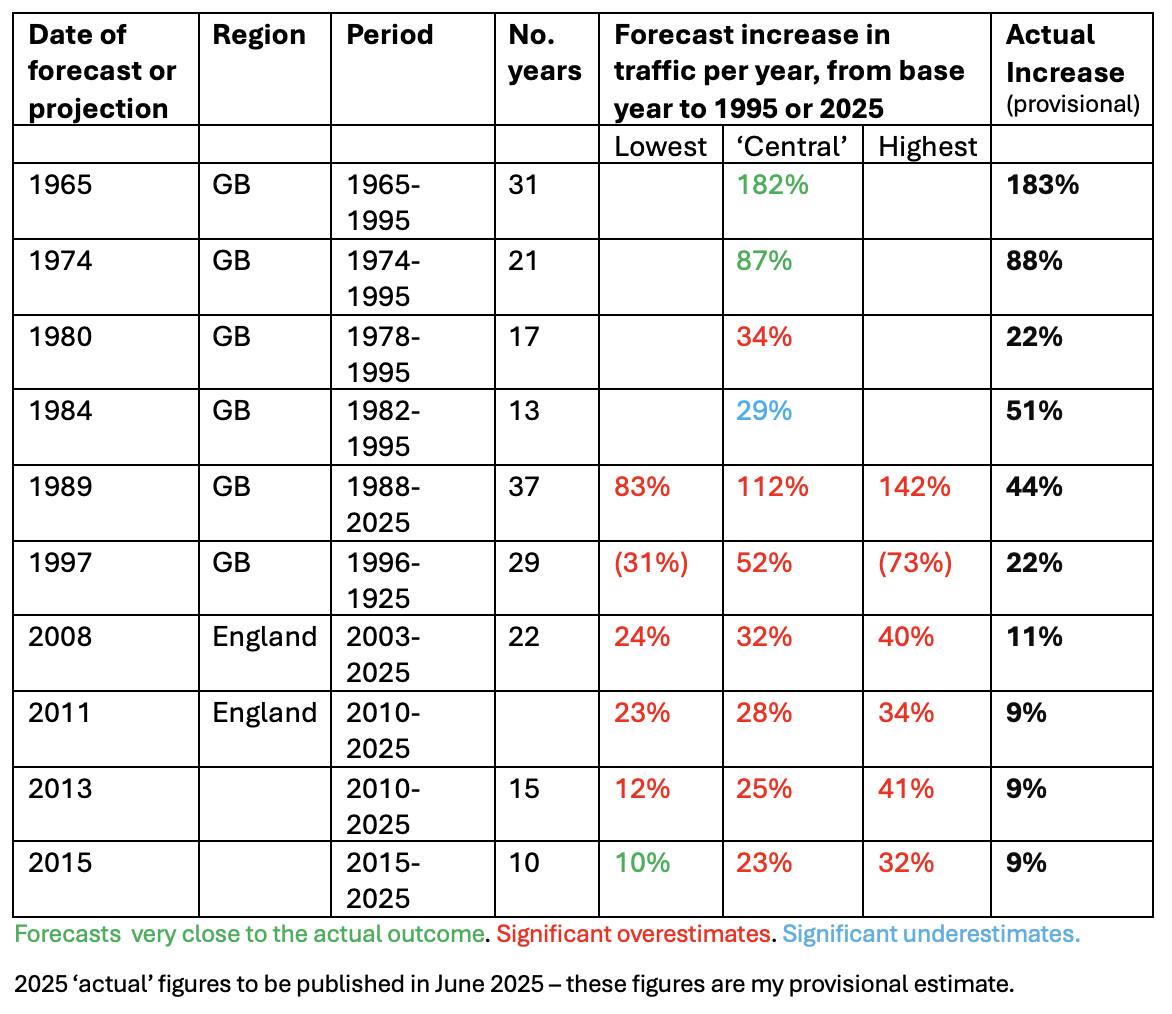
A new generation of forecasts was prepared in 2015, 2018 and 2022, and they are considered in more detail below.
One implication needs to be immediately addressed. If traffic growth has been so much lower than expected, why are we not feeling relief in terms of our expectations of congestion and other traffic pressures? I think there are two reasons. First, we have never really come to terms with how bad things would be if the forecast increases in traffic had actually materialised. Secondly, there have indeed been developments making the effects of traffic worse, but they are not mainly about the vehicle miles travelled, but increases in the width, length, height and weight of vehicles, which increase congestion, danger and environmental impact. There has been a substantial reallocation of space for cars: too many do not fit into garages, so they have colonised gardens, kerbsides and pavements.
1989 – Watershed forecasts which changed everything
Figure 3: All vehicle traffic, Great Britain, actual and 1984, 1987 and 1989 ‘central’ forecasts, 1980 to 2025
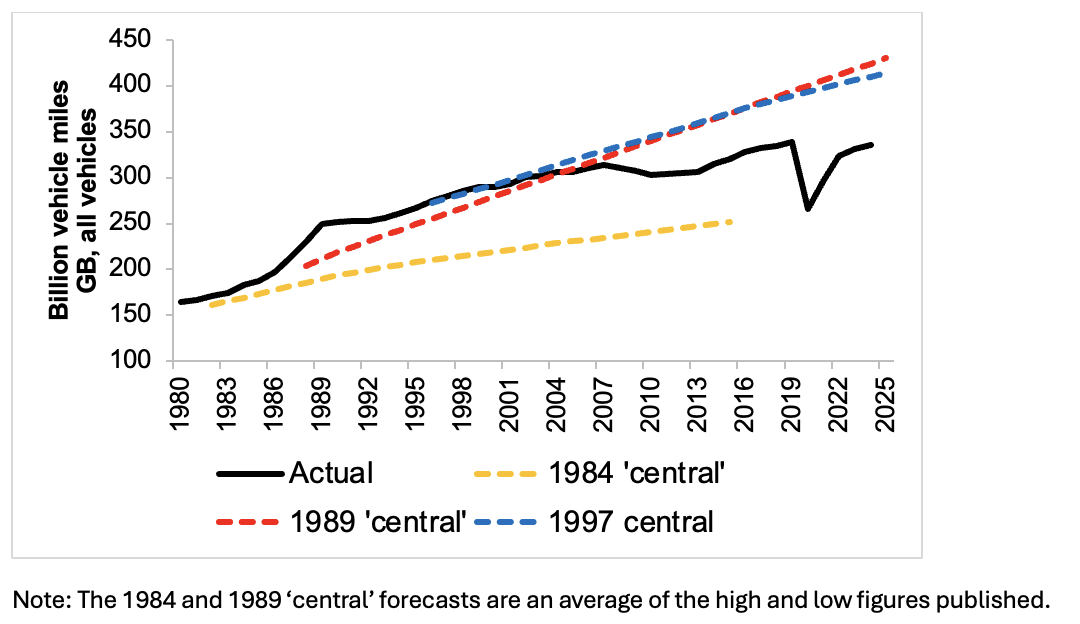
The 1984 forecasts underpredicted the 1995 flows and was taken seriously only as a reason for finding a better method. It was the last case of underprediction. The 1989 forecasts, which were extended in 1997 and provided a pattern continued for following decades, predicted very high growth rates, which seemed accurate for the first few years, but eventually even its low estimates were overestimating the actual traffic levels, and the central and high forecasts very substantially so. (Note that in the graph the 1989 projection looks very odd in its early period, though this is partly an artefact of a retrospective revision of the ‘Actual’ figure after the forecasts had been published, giving the noticeable ‘bump’ in the curve afrom 1998, which the forecasters did not know about. If they had published a year later, after the revision, I assume the line would have started higher but with the same slope, and the overprediction noticed much earlier).
These forecasts, with a suggested range of traffic growth from 83% to 112% by 2025, were substantially higher than any before or since. They were published alongside, and as a justification for, Margaret Thatcher’s iconic road programme ‘Roads for Prosperity’, described at the time as ‘the biggest road programme since the Romans’. The unexpected consequence was a crisis not only in forecasting, but also the policies adopted to cope with it. The British Road Federation (the main road-building lobbyists at the time) published a report saying that even a road programme double the proposed size would not be sufficient to cope with the predicted traffic increases. This reversed the previous logic – high traffic forecasts had been thought to justify more road building, even where the benefits consisted more of slowing down the pace at which congestion got worse, than actually making it better. The 1989 forecasts crystallised this conflict. One interesting political consequence is that there was little effective intellectual challenge at the time to the logical or evidential credibility of the forecasts: there was an intense debate about the road strategy, in a division that would later come to be called ‘sustainable’ versus ‘unsustainable’ but it suited both sides in that policy argument to use the very high traffic forecasts to support their view.
Led initially by Conservative local authorities[12] in the South East, who were confronted by suggested traffic growth rates they manifestly could not cope with, a new generic transport policy tool, ‘demand management’ became Conservative declared policy by about 1994, and was embodied in John Prescott’s White Paper ‘A New Deal for Transport’ in 1998, produced by his new Ministry, the Department of the Environment, Transport and the Regions, composed of the Department of Transport and the Department of the Environment.
Rethinking in the new administration?
There was some discussion that the policy priorities of the new administration might require an entirely different sort of forecasting model, and I was involved in one exercise of this sort. Development of a new model ATFM, (Aggregate Transport Forecasting Model) was commissioned by the DETR[13]. It used dynamically specified econometric relationships to estimate control totals aimed to make the national totals easier and swifter, and hopefully more reliable because they would track changes over time, taking into account delays in demand responses. It found some favour: more so by the former DoE officials than the former DoT officials, but we were told that it was decided not to go ahead primarily because it would cause potential confusion if two different models, both officially endorsed, might come to different forecasts. (Later, it was accepted that taking notice of different forecasts would be a good way of recognising uncertainty, but this argument was not persuasive at the time). I think it was a missed opportunity that might have changed substantially a debate which did not emerge until ten years later.
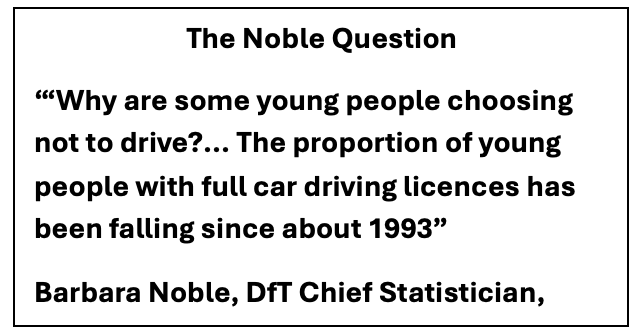
A turning point in the early 1990s: peak car and young people’s travel.
In 2005, a prescient paper by the DfT Chief Statistician, Barbara Noble (2005)[14] noticed a turning point in young people’s uptake of motoring, that seemed to have happened over ten years earlier, in about 1993. Nobody took much notice of her question for several years, but attention revived in many countries in about 2010, about an observed levelling of traffic growth, under the title ‘Peak Car’[15]. The idea had considerable traction. In November 2011 the OECD/International Transport Forum convened a Round Table conference on the subject in Paris[16]. Empirical data was reported in a report by Le Vine and Jones (2012)[17] published by the RAC Foundation. The journal Transport Reviews published a special issue in May 2013 on the developments in several countries, including papers by David Metz[18], Gordon Stokes[19], Peter Headicar[20], and an overview by myself and Kurt van Dender on themes and issues in both the OECD/ITF conference and the Transport Review Special Issue[21].
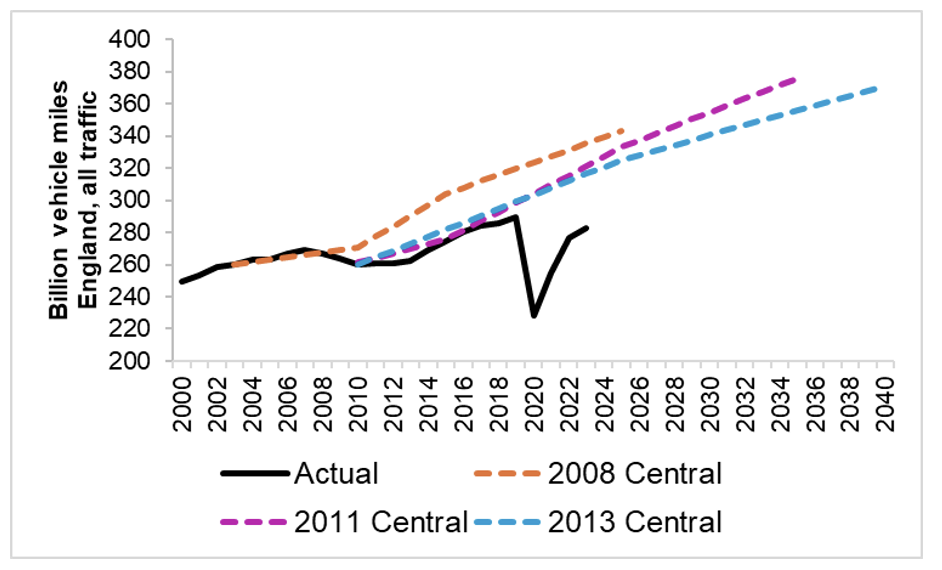
None of this found much favour in the DfT. Forecasts about that period were much the same as before, as shown in figure 4, though progressively slightly lowering each subsequent projection.
Figure 4: All vehicle traffic, England, actual and 2008, 2011 and 2013 central forecasts, 2000 to 2040.
The DfT criticised the idea of ‘Peak Car’ in 2012[22], as part of their newly revised forecasts for 2011:
“In the last few years individual’s growth in car travel demand… has either been static or fallen. Does this suggest that individual’s car travel demand has now saturated? … The trends in travel since 2000 can mainly be explained using the macroeconomic key drivers’ [ie fuel prices, and GDP]…The projections show car travel growing but at a declining rate”[23]
That question remained unresolved for a while, but meanwhile the discussions on peak car triggered another policy issue arising from the inaccurate forecasts – financial consequences of overpredictions.
Pension Funding and the reliability of forecasts.
This generated new attention to the reliability of the forecasts in another context. In 2012 I wrote a short article here in Local Transport Today, drawing attention to the then continued tendency for DfT traffic forecasts to overestimate traffic growth. The context was an inadequately thought through idea from David Cameron, embodied in a Treasury ‘Pension Infrastructure Platform’, to be run by UK pension funds, which would use accumulated pension funds to invest in infrastructure projects. But long-term overestimates of demand would put great stress on the expectation of the value of pensions. The pension fund idea was dropped, though variants come back from time to time (including recently) in the proposed use of private funds when there is a political or lobbying desire to support big projects which do not seem good value for public funds. Faulty forecasts of traffic revenue from toll roads in Australia affected pension funds greatly, and resulted in major legal battles seeking compensation from the consultants who had made the forecasts. Accurate traffic forecasting is crucial for both public and private funding, whether considering public value for money or commercial guarantees.
Young People’s Travel and the Pathway to a New DfT Model
The discussions on ‘peak car’ in 2010-2013 gave increasing prominence to changes in the relationship between travel and age, and Barbara Noble’s 2005 question. The DfT commissioned an important study of this phenomenon in 2016, which was carried out by a team of transport academics at the Universities of the West of England, and Oxford, reported by Chatterjee et al (2018)
The work showed that driving licensing rates among young people peaked in 1992-4 (as had been noticed by Noble), and there were successive reductions in car use in each cohort of young people since then. The most important new feature was the evidence that the lower car use observed in 18-year-olds showed evidence of persistence as they got older. The report commented “Men born from about 1980 onwards are reaching 30 years of age with substantially lower licence rates and car driving mileage than previous cohorts. This cohort effect is also apparent for women but smaller in magnitude.” (That generation are now in their 40s.)[26] .
This raised the question of whether a dynamic, age-related effect could be incorporated into the traffic forecasts. The first trial to do so (as far as I know) was by Gordon Stokes (2013)[27] in the context of the peak car discussions. He concluded, very tentatively, that if the trends found so far were to continue
“the base forecast for overall car use per person will broadly stabilise for the next 20 years or so – rising by just under 1% up to 2019 and then falling by 3% of the 2013 level by 2036”
(Such a fall did happen, but was bigger, see below). This was reinforced by Headicar (2013)[28] analysing changing patterns of spatial distribution, who reported that the tendency of ‘counter-urban shift’ which had added to car driver mileage during the 1970s to 1990s, had reversed:
“…during the most recent decade, spatial redistribution has had the effect of marginally reducing car driver miles per head, and annual car traffic in 2011 is some 620 million miles less as a result”
These arguments suggested that, in some respects, the ‘peak car’ concept should not be regarded as corresponding to actually reaching the ‘saturation’ level which had been postulated in all the previous forecasts, but potentially as a turning point from growth to decline, which had never been part of any official thinking, but was to reappear as a possibility in the following decade.
Although definitions changed over the period, it is very clear that each subsequent forecast had needed to be revised downwards within a few years: actual traffic growth rates never kept up with the central or high forecasts. As shown in Table 1, for all or most of the forecast period, the lowest forecast published – though still an overestimate – was closest to the reality, and was successively revised down each time.
Evolution of ‘Scenarios’ – from cautious to radical reassessment
Since 2015 there have been three forecasts (2015, 2018, and 2002) where the word ‘scenario’ has been given more explicit meaning, incorporating progressively elements of the age-related and other behavioural changes, and culminating in 2022 in seven rather precisely prescribed scenarios. The new forecasting approach has most differences in relation to car traffic, which the following analysis focuses on.
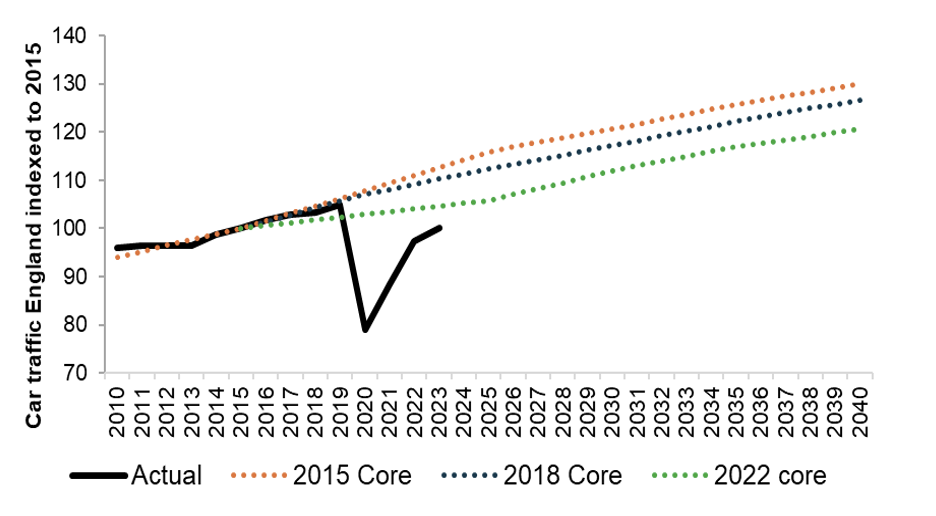
The progression of the core scenario of these three is shown in figure, which shows that each has needed to be successively revised downwards, though keeping the same general shape
Fig 5: Core scenarios for car traffic in England from the 2015, 2018 and 2022 traffic forecasts, compared with actual traffic, 2010 to 2040, indexed to 2015
My discussion now focuses on the 2022 forecasts, where the scenarios were seen in terms of seven specific scenarios of which six were variant assumptions using the same demand model, and the seventh used a different demand model incorporating the new evidence on aging and other behavioural changes.
The DfT explained[29]
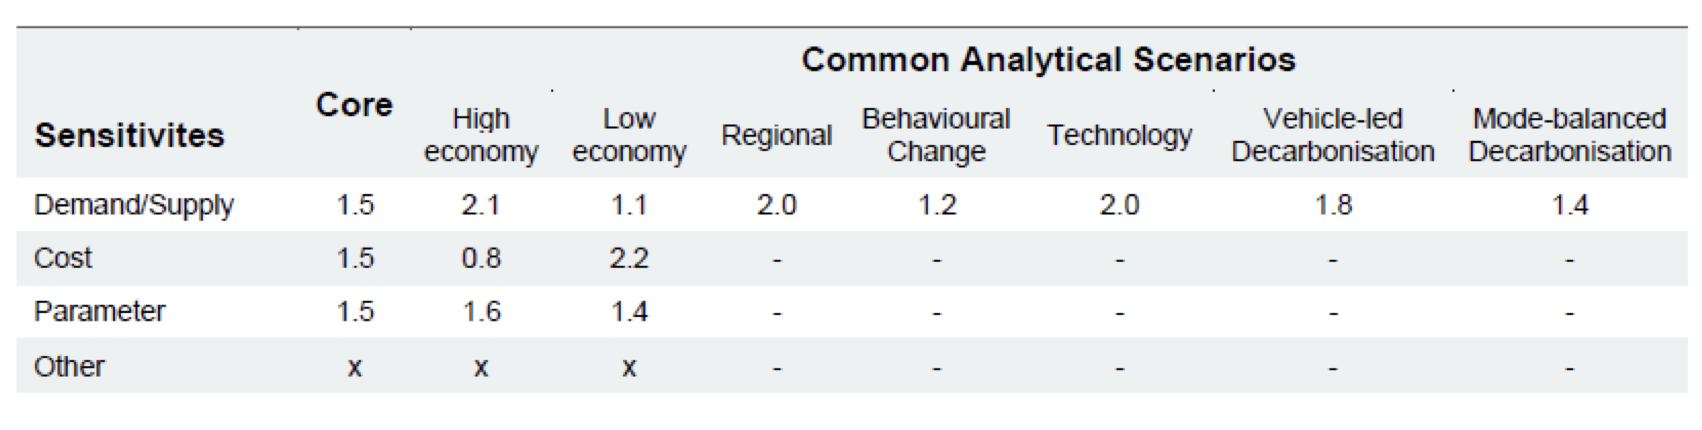
“1.3 Projecting travel demand over the long term is inherently uncertain and the Department has developed a set of analytical scenarios to explore the uncertainties around key national level drivers of travel demand. The Common Analytical Scenarios (CAS) are a set of seven standardised, off-the-shelf, cross-modal scenarios exploring national level uncertainties for use in transport forecasting and appraisal. The scenarios explore uncertainties in demography, economic growth, regional redistribution, behavioural change, emerging technologies, and decarbonisation.”
‘1.9 There is significant uncertainty in long term travel demand and the full range of CAS should be considered to understand how sensitive the projections are to different drivers of travel demand.
“3.2 The Core Scenario is the starting point for most of the Common Analytical Scenarios except for the Behavioural Change Scenario. The rest of the scenarios are created by changing some of the Core Scenario inputs.”
This new scenario was added to the traditional ones of high and low economic growth, fuel prices, etc. It had been titled, successively, ‘extrapolated’, ‘extrapolated trip rates’ and ‘behavioural change’. It affects car traffic and is assumed not to affect good vehicles (which sounds reasonable in itself, though I have written separately about the much bigger fundamental weaknesses of forecasting methods for goods vehicles[30] especially in assuming that the quantity of freight traffic is fixed in origin, destination, and mode, sensitive in volume to economic conditions but not to transport conditions, and unaffected by infrastructure schemes).
Figures 6 and 7 contrast the 2022 forecasts for all traffic, and for car traffic only, giving prominence in each case to the difference between the Core (surrounded by its alternative variants), and the Behavioural Change Scenario for which no variants were reported[31].
Note that the green lines in Figures 6 and 7 should be considered indicative rather than the final form of the projections. The diagrams were constructed with DfT published figures, but were not printed in their 2022 report. Their odd appearance is because the projections were prepared by DfT in 2022 for application to start in 2025, but appear as though they were forecasts from 2015 - which manifestly did not correspond with the actual figures for that period. Before use they would need to be rebased to 2025 actual figures (re-estimating if necessary), and bearing in mind the actual experience of Covid.
Fig 6: All vehicle traffic, England & Wales, actual and the eight 2022 forecast scenarios, 2010 to 2040.
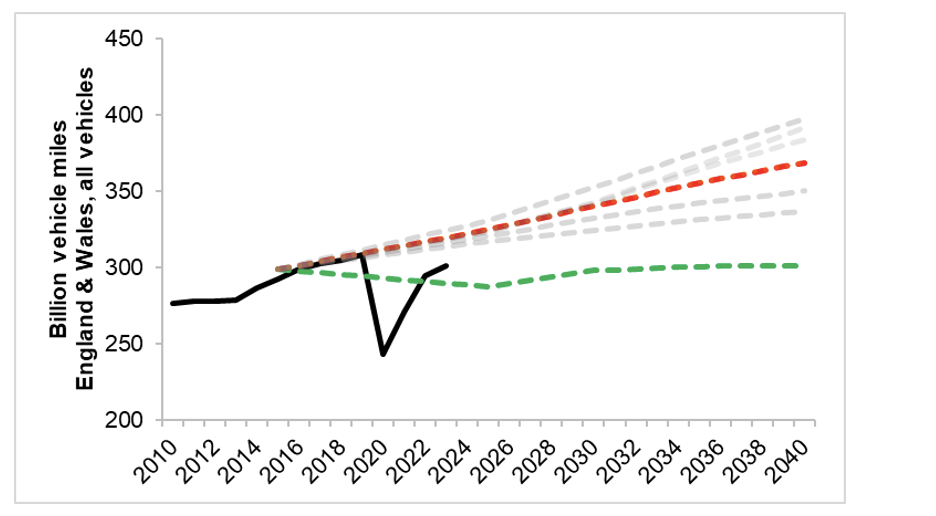
Notes: Core scenario shown as red dotted line, and Behavioural Change scenario shown as green dotted line.
Fig 7: Car traffic, England only, actual and the eight 2022 forecast scenarios, 2010 to 2040.
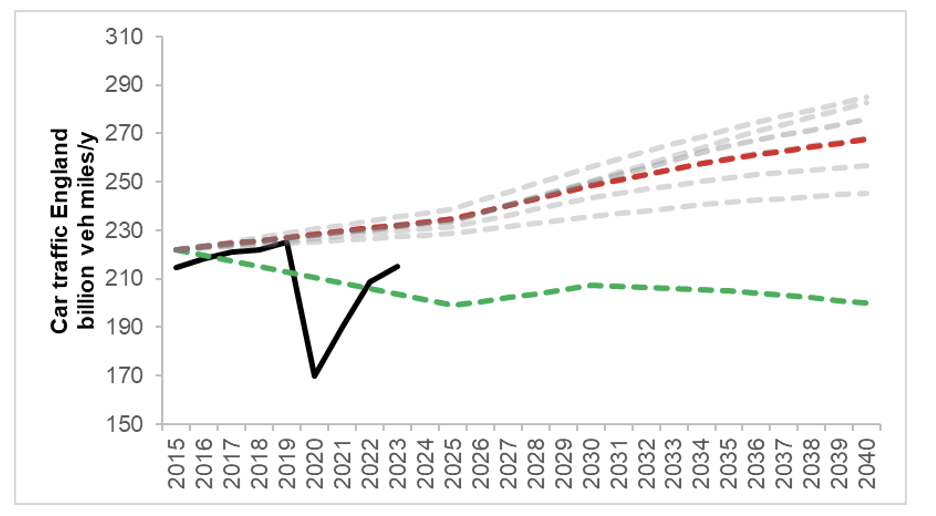
Note: Core scenario shown as red dotted line, and Behavioural Change scenario shown as green dotted line.
It can be seen that in most respects the two figures are very similar in form – you have to look at the units of the Y-axis to see the difference. But green line goes up (though not much) for total traffic, and down for car traffic. This is the most significant feature of the evolution of official traffic forecasting this century.
Three serious questions are raised by the different pattern shown by the behavioural change scenario from all the other scenarios. The first is the logical point that just as the red Core scenario has its range of variations, so also, in principle, must the green Behavioural Change Scenario – they are embedded in the calculations though not published.
So, for example, the behaviour change scenario itself also assumed, like the Core, that the official line would be followed about future economic growth, and the question then follows – in that case, what would the projections look like under low income or high income conditions, etc?
The logical way of considering that would be to treat model BC also as a fan-shaped spread of different possible trajectories, as shown in Figure 8 as a fan-shaped range – in both cases not yet taking account of any effects of new policies yet to be determined, or the effects of environmental change beyond that currently experienced .
Figure 8: Uncertainty range around the BC model based on uncertainty around the standard model
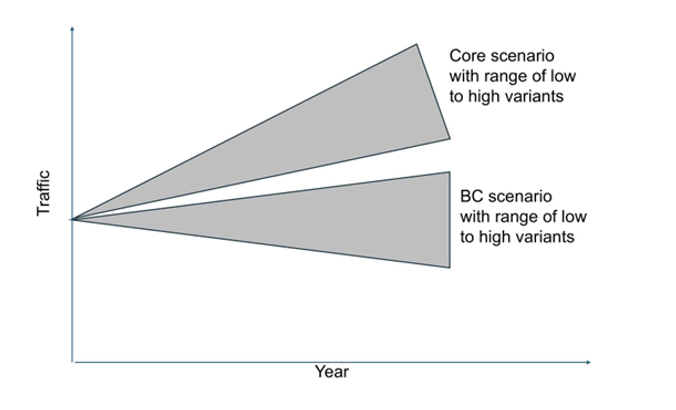
Thus, built into the BC model, based on the empirical parameters, is the possibility that traffic decline is possible as well as growth, discussed further below.
The importance of Government Forecasts of Economic Growth
The second question relates to the importance of economic growth forecasts. Over the years, a major part of the explanation suggested by DfT for over-prediction has been that economic growth has been lower than official Government predictions of economic growth, though DfT does not have authority to abandon such forecasts even if it wanted to. Calculations suggested that if economic growth had been delivered as forecast the models would have performed better. However, it would not have been felt acceptable to build into its forecasts any suggestion that economic growth targets would not be achieved. By contrast, the Behavioural Change Scenario has given lower forecasts while still assuming full achievement of the Government’s growth targets (and therefore raises the question that its forecasts would have been even lower with the actual economic growth).
There were thus competing explanations for the failure to forecast traffic correctly. This seems overdetermined, raising the questions
a)Which is the better explanation – or could both be true?
b)What would have happened if the BC scenario had been run on actual economic growth? Do we simply multiply the two effects and predict actual traffic decline?
One possible reconciliation would be that economic growth was becoming a less important influence on traffic growth over the period. On this a very important graph was published by the DfT in the 2008 Edition of a short-lived statistical series called ‘Transport Trends’.
Figure 9: Road traffic and travel intensity: 1980 to 2007, Great Britain (source DfT, 2008)
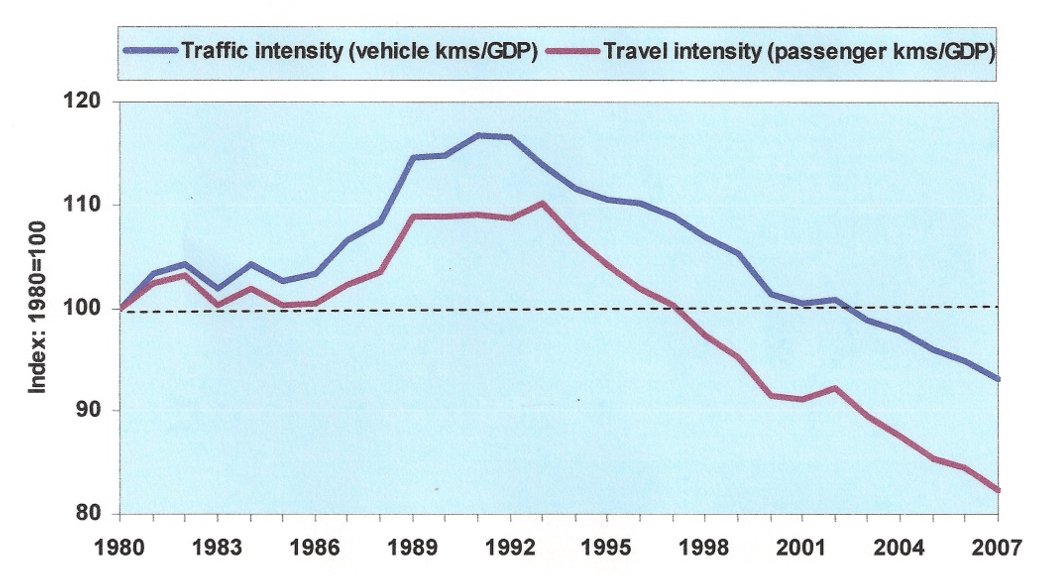
This figure shows that until about 1989 the traffic intensity (ratio of vehicle mileage travelled per unit of GDP) was increasing steeply. But by the mid-1990s it levelled off and then turned down, which continued until 2007. In other words, there was a turning point at just about the same time as the start of the age-related downturn in young drivers’ car use (which was, ironically, also the period of the launch of ‘Roads for Prosperity’ and the highest ever traffic forecast growth).
The series ‘Transport Trends’ was discontinued a few years later and there is no trace of access to it that I can find in DfT archives, I have not seen a continuation of the analysis for later years. Comparison of aggregate statistics for GDP in real terms, and total traffic, indicates that traffic intensity of GDP has continued to reduce, by around 16% from 2008 to 2023, so this seems to be a well-established trend.
This degree of ‘decoupling’ of traffic growth from economic growth would make errors in forecasting GDP less crucial to traffic forecasts, and also reduce the potential for conflict between the Treasury and DfT.
Is Decline in Car Use a Reasonable Possibility for Forecasts?
The third major question raised by the Behavioural Change forecasts is whether the decline in car use it projected was realistic. It certainly runs counter to many deeply embedded expectations in place for a century. This new projections followed the logic, though with different calculations, that Stokes and Headicar had discussed in 2013. In their report, DfT summary explained that all the 2022 scenarios showed an increase in traffic, which was true as shown in Figure 6 above, but the increase for 2022 was very low, and in fact entirely due to the increase in goods vehicle traffic. For cars only, the 2022 Behavioural Change Scenario actually predicted a decrease, as shown in Figure 7. (The reason why the BC scenario bizarrely shows a decreasing line starting from 2016, before the forecast was made, is due to a backdating of the trend, and is manifestly contradicted by the actual figures even before the Covid interruption.) But a downward trend at some point in the late 2020s is certainly implied in the projections, and will no doubt be an important test on the validity of the scenario.
One of the most compelling features of the DfT’s ‘Behavioural Change Scenario’ is that it explains important observed trends which would otherwise be inexplicable, or ignored. This is especially the case for the decline in car use per person which the annual National Travel Surveys have recorded.
Fig 10: Average car trips and miles travelled (as driver or passenger) per person per year, England 2002 to 2023 (Source: NTS0303)
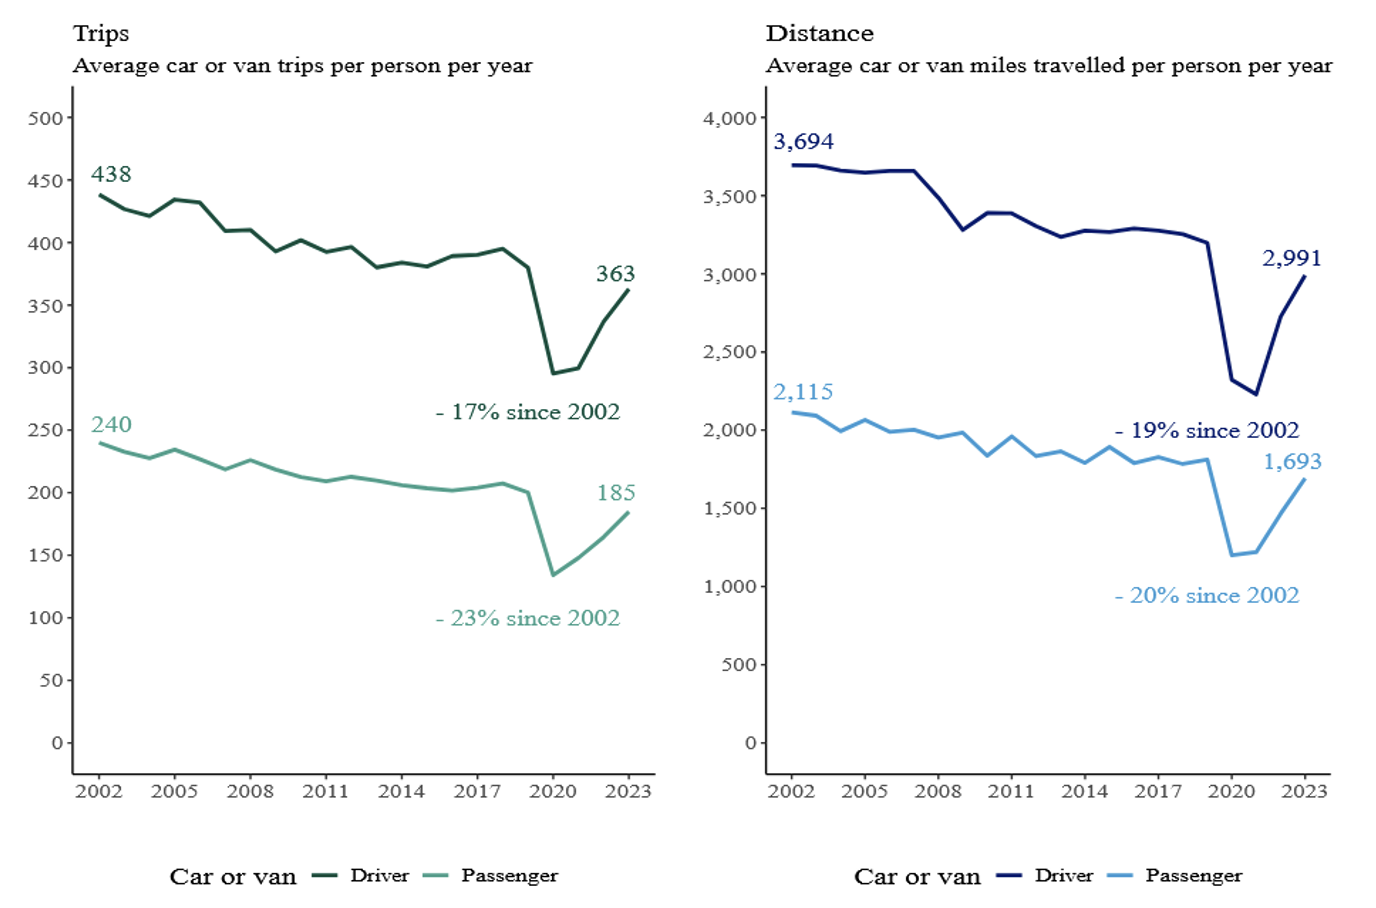
Fig 10 shows a declining trend in car use per person, measured in trips or distance, now established for twenty years. These series had been rather stable in the earlier period, from 1995, and had been thought to be increasing in the period before that though data are sparse, and investigation continues. But taking these together there is empirical support for the existence of downward trends in car per person car use. It had not been considered in official traffic forecasts previously, but should be. I have wondered whether the reason why Jillian Anable and I had difficulty[32] making sense of Grant Shapps’ ‘Decarbonising Transport’ policy report[33] - and Greg Marsden’s unsuccessful attempt to elucidate this by a Freedom of Information inquiry - was whether it might have been informed by a not yet published version of Behavioural Change forecasts. It would be useful for Ed Miliband to revisit this.
There is now a strong case for the Behavioural Change model, developed by the DfT, to be taken at least as seriously as the previous ‘core’ model which was based on the factors affecting demand as understood a decade earlier. This would have the following advantages.
a)It is much more consistent with the demand trends since the mid-1990s .
b)It makes use of the evidence base on behavioural change of young people.
c)It is consistent with NTS observations of the overall decline in car use per head for the population as a whole.
d)It does this without needing to assume that the Treasury forecasts of economic growth are wrong, but provides a better platform for considering the further effects if that were to be the case.
Why does it matter?
Effects on appraisal of a Scenario Approach
After preparation for the 2015 and 2018 forecasts, the scenarios were codified in 2022 and launched with a forward by the Permanent Secretary, Chief Analyst and Director of Strategy of the DfT[34] - a more emphatic endorsement than usually given to technical advice - with new rules for how they must be included in project appraisal, specifically because different scenario forecasts would result in substantial differences in the calculated value for money of investments, especially road projects. In 2023 the Department for Transport’s ‘Uncertainty Toolkit’[35] ‘ was produced including the following table
Table 2: Example table summarising impact of scenarios on scheme BCR
Note especially that the BCR of the hypothetical project assuming ‘Behavioural Change’ scenario was 20% lower than the Core (and even assuming the official economic growth figures). Although the data was described as an ‘Example’ with no specific schemes mentioned, the values did seem to be based on some real project appraisals, being similar to those found in appraisals of specific projects, for example four National Highways road projects, I have looked at. They are the A12 Chelmsford to A120 Widening Scheme[36] , the A66 Northern Trans Pennine Scheme[37], the A27 Arundel Bypass[38] (a Highways England Scheme), and the Lower Thames Crossing[39]. Each of them reported the results of a sensitivity test for high and low traffic growth, as shown in Table 3.
Table 3: Reported results on BCR of sensitivity tests for higher and lower traffic growth
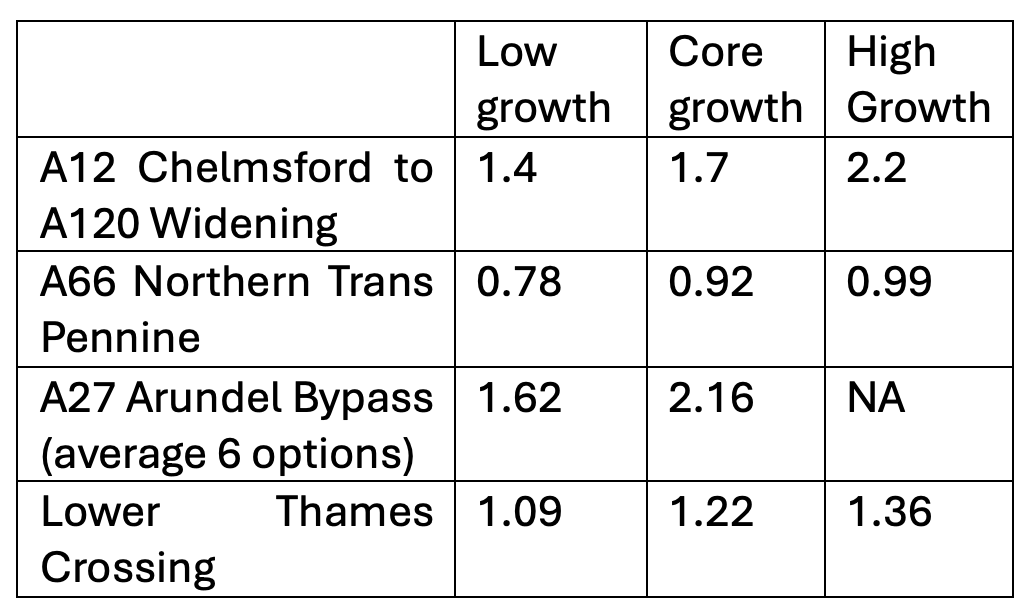
In none of these cases was the ‘low’ case based on the 2022 ‘Behaviour change’ scenario. In the case of the Lower Thames Crossing National Highways was asked to test using the Behavioural Change Scenario, the ‘low’ traffic growth figures being based on a less testing reduction in economic growth, but declined to do so saying that they were not legally required to, and that they would only do this after the Secretary of State had given approval to the scheme. It is likely in my view that the value for money calculated would be difficult to sustain, with a BCR close to (or less than) 1, and a Net Present Value of about zero, possibly negative). There have recently been some calls to abandon the requirement that appraisals should be tested against all the CAS scenarios, nominally because of the extra work involved. That is as may be. But, in any case, testing against the Behavioural Change scenario should still be required, because of its relevance and evidence base.
Implications for Future Model Development
A key property of the Behavioural Change model is that it demonstrates that it takes time for changes in conditions to have effects on behaviour: a new equilibrium is not found within a year, or even within a decade. This suggests that if, for example, there were commercial marketing initiatives specifically aimed at young people to encourage them to buy more cars, the effects might similarly not be immediate, but build up over years or decades. Modelling would need to keep track of a ‘memory’ of successive generations and the experiences they have lived through, the total outcome being path dependent and possibly asymmetric to reversals in direction. This is a feature of dynamic models but not ones where the features of an equilibrium are assumed to be independent of the path approaching it.
There are similar effects in other contexts unrelated to age. Income changes in particular are nearly always found to have an effect on choices, but those effects are far from immediate. The work of Dargay and Gately (1999)[40] found strong and consistent similarities among many countries, including the UK, using a dynamic specification for estimation of the effects of income on car ownership. Even if one assumes that all countries will eventually approach the same high ‘saturation’ level of car ownership, (which I think is doubtful, but not crucial to the result) less than 10% of the full effect was produced within the first year after a change in income, while 90% of the full adjustment takes approximately 24 years.
It is also well established that responses of demand for public and private transport to changes in fares, full prices, travel times and service levels, can take some years to settle down – naturally, since the longer term effects are constrained by the speed at which people change their places of work or home, children’s commitments to schools, and so on.
All these mean that to take account of the effects of such changes it is necessary to have a dynamic formulation of demand, and the consequences are likely to be different according to the direction of change. During a sequence of a long period of rises and falls of public transport fares, for example, there will be many people at a different stage of their dynamic adjustments.
To handle these features by using transport models, one would need to abandon the assumption that equilibrium is reached swiftly and can be observed at any one point in time. The methods of doing so are well established in textbooks, but not even recognised in mainstream transport models. It is unrealistic to expect that such a dynamic direction can be incorporated in models which are already too big and complicated for any one person to comprehend, but quite reasonable to use in the type of aggregate overview which can be used to control the totals[41].
Additional considerations
It is necessary to underline that none of this discussion about demand trends changes the importance of discussion about what demand trends it is desirable to foster, by policy measures, appropriate investment, planning measures, pricing, and law.
In general, the high predictions will have resulted in the provision of more road capacity, which in turn will have to some extent induced more traffic than would otherwise have occurred. This may well be rather small proportion of total traffic at national level, but extending the same arguments to local level, in the neighbourhood of major schemes, the additional traffic generated will be substantial, leading to an element of ‘self-fulfilling forecasts’. I have not taken this into account in this paper.
There will be some sensitivity that projections of falling car traffic might undermine the commitment of Government and Society generally to reduce carbon emissions, the falling car use doing the job without the need for further effort. I think this is wrong. The existence of a downward trend for other reasons should make it easier to consider further reductions, because it is generally easier to accelerate an existing trend than to reduce it, and justify shifting spending to favour it. This has been one of the problems in expectations of every increasing traffic, that it has raised spending and providing for – and accelerating – the trend. Correcting that imbalance will help carbon reduction.
In conclusion, I do not think the administrative arguments against giving public access to DfT models should be given weight. Not very many would have the technical ability to make use of this, but it would increase confidence, deepen understanding, and, I suspect, improve the chances of making improvements. In any case, it will not now be very difficult for bright enthusiasts, assisted by artificial intelligence, to reverse-engineer a black box version of the model and nearly all of its functionality, from the voluminous and very detailed tables of results, data, sensitivity tests, and reports already published. It would be better to release the real thing.
When citing, please refer to this paper as Goodwin, P (2025) National Road Traffic Forecasts 1965-2025: Why did they become so inaccurate and how can they be improved? Tapas Network 25 June 2025, https://tapas.network/93/goodwin.php.
References and Links
-
I gratefully acknowledge the great help I have received from Lisa Hopkinson, and useful comments from Gordon Stokes, Tom van Vuren, Iven Stead, and Peter Stonham, as well as discussions with generations of DfT and (T)RRL staff (and ex staff), and their critics. Responsibility for errors remains mine.
-
Glanville W and Smeed R (1958) The basic requirements for the roads of Great Britain. Institution of Civil Engineers, London.
-
Tanner, J C (1965) Forecasts of future numbers of vehicles. In Road Research Laboratory (ed) Research on road traffic. HMSO, London, pp. 63-84. Also in Roads and Road Construction, 43 341-347, 371-376
-
Tanner J C (1977) Car ownership trends and forecasts TRRL Report LR799, Transport and Road Research Laboratory, Crowthorne
-
Tulpule AH (1973) Forecasts of vehicles and traffic in Great Britain 1972 revision, Report LR543, Transport and Road Research Laboratory, Crowthorne. This diagram was prepared with the help of Kit Mitchell’s compilation of statistics published by the Institute of Advanced Motoring, but no longer available. I believe it to be accurate.
-
Advisory Committee on Trunk Road Appraisal. It was the predecessor of SACTRA, and sometimes confused with it, but that was a different committee, with different membership, and different terms of reference.
-
Van Vuren T, Gordon A, Mackie P, Harris R, and Williams I (2001) From NRTF to National Transport Model – a New National Transport Forecasting Tool, Association for European Transport https://aetransport.org/public/downloads/fxWX0/357-514ec4d54aadb.pdf
-
It is an equilibrium model with trip generation, mode choice, distribution and assignment, and in principle time of day choice, defining equilibrium in interaction with generalised costs, a form of speed-flow relationship, and informed by a wide range of empirical evidence on demand elasticities, travel costs, economic, social and environmental impacts, and theories on wider impacts. There is an extensive literature on theoretical and practical issues, including some by me, of which only some are discussed here.
-
National Road Traffic Forecasts (Great Britian) 1989, Department of Transport.
-
Mackett R L (1998) Why are travel demand forecasts so often wrong (and does it matter) UTSG Conference, Dublin, January https://discovery.ucl.ac.uk/id/eprint/144591/1/Mackett_C53%20UTSG%2098%20Dublin%20travel%20forecasting.pdf
-
https://naei.energysecurity.gov.uk/sites/default/files/cat07/0910021355_10_National_Transport_Model_2008_Forecasts_Malcolm_Jay_DfT.pdf Fuller version in https://data.parliament.uk/DepositedPapers/Files/DEP2009-1768/DEP2009-1768.pdf; 2011 Road Transport Forecasts 2011 Results from the Department for Transport's National Transport Model DfT January 2012: Road Transport Forecasts 2013: https://webarchive.nationalarchives.gov.uk/ukgwa/20140325060129/ https:/www.gov.uk/government/uploads/system/uploads/attachment_data/file/212474/road-transport-forecasts-2013.pdf 2015 Road Traffic Forecasts 2015 https://gat04-live-1517c8a4486c41609369c68f30c8-aa81074.divio-media.org/M4-Newport/C%20-%20Core%20Documents/6.%20Transport%20and%20Engineering/6.3.7%20-%20Road%20Transport%20Forecasts%202015.pdf 2018 https://assets.publishing.service.gov.uk/media/5e73a43d86650c2978afa311/road-traffic-forecasts-2018-document.pdf https://www.gov.uk/government/statistics/national-travel-survey-2023/nts-2023-car-availability-and-trends-in-car-trips
-
These period is covered in the TSU report, supported by the Rees Jeffreys Road Fund, ‘Transport: the New Realism’ https://tapas.network/rr2/downloads/1991%20goodwin-hallett-kenny-stokes%20Transport%20the%20New%20Realism%20rerelease%202012.pdf
-
Development of an Aggregated Transport Forecasting Model, by Dargay J, Goodwin P and Hanly M, UCL, September 2002.
-
Noble, B. (2005) Why are some young people choosing not to drive? Proceedings of European Transport Conference, Strasbourg, France, 18-20 September 2005. https://aetransport.org/past-etc-papers/conference-papers-pre-2012/conference-papers-2005?abstractId=2093&state=b
-
A series of five articles in LTT in 2011, conveniently brought together in an article ‘Three views on peak car’ (World Transport Policy and Practice, 2012).
-
Goodwin, Phil (2012) : Peak travel, peak car and the future of mobility, OECD/ITF Paris, https://www.oecd.org/content/dam/oecd/en/publications/reports/2012/12/peak-travel-peak-car-and-the-future-of-mobility_g17a2241/5k4c1s3l876d-en.pdf
-
Le Vine, S. and Jones, P. (2012). On the Move: Making Sense of Car and Train Travel Trends in Britain. RAC Foundation http://www.racfoundation.org/assets/rac_foundation/content/downloadables/on_the_move-le_vine_&_jones-dec2012.pdf
-
David Metz, 2013. Peak Car and Beyond: the Fourth Era of Travel" Transport Reviews, 33(3). Also Peak Car: The Future of Travel, Landor Links, 2014
-
Stokes, G (2013) The prospects for future levels of car access and car use, Transport Reviews 33(3)
-
Headicar P (2013) The changing spatial distribution of the population in England: its nature and significance for ‘peak car’ Transport Reviews 33 (3)
-
Goodwin P and Van Dender, K (2013) Peak Car – Themes and Issues, Transport Reviews 33 (3)
-
Department of Transport (2012) Road Transport Forecasts 2011 Jan 2012, Box, page 40
-
‘Travel will continue to grow but at a declining rate’ was described as a feature of nearly all the forecasts, including those from 1989. This is less useful than it sounds, as even an unending uniform linear increase would show this pattern: it is an arithmetically necessary feature of even straight lines.
-
Goodwin P (2012) Due Diligence, Traffic Forecasts, and the Pension Infrastructure Platform, Local Transport Today 594, 13.4.2012
-
Chatterjee, K., Goodwin, P., Schwanen, T., Clark, B.,Jain, J., Melia, S., Middleton, J., Plyushteva, A., Ricci, M., Santos, G. and Stokes, G. (2018). Young People’s Travel – What’s Changed and Why? Review and Analysis. Report to Department for Transport. Centre for Transport and Society, UWE Bristol & Transport Studies Unit, University of Oxford. https://assets.publishing.service.gov.uk/media/5a82a485ed915d74e3402d3e/young-peoples-travel-whats-changed.pdf
-
This was not universally agreed, and some questions remain unresolved. Notably McDonald (2017) discussed several critical approaches including one by the Dutch Ministry of Transport suggesting that the decline in car use by the young was a delay which would be reversed later. https://www.demand.ac.uk/wp-content/uploads/2017/03/26-EC1-McDonald.pdf
-
Stokes G (2013) ref.19
-
Headicar (2013) ref. 20
-
2022 National Road Traffic Projections 2022 https://assets.publishing.service.gov.uk/media/6698c4f90808eaf43b50d193/national-road-traffic-projections-2022.pdf
-
Goodwin P (2024) The deep flaws in how we model freight, Local Transport Today 8.5.2024 https://tapas.network/55/goodwin.php
-
A presentation like this was suggested in LTT (2018) with diagrams in Goodwin P (2019), and Lyons, G. and Marsden, G. (2019). Opening out and closing down: the treatment of uncertainty in transport planning’s forecasting paradigm. Transportation, https://doi.org/10.1007/s11116-019-10067-x
-
Anable J and Goodwin P (2021) We are now facing two alternative futures (plus an untenable one), Local Transport Today 6.8.2021, https://tapas.network/a35/goodwin.php
-
Kelly, B, Rowlatt, A & Morgan, L (2022) Transport Business Case Guidance, DfT https://www.gov.uk/government/publications/transport-business-case/transport-business-case-guidance
-
Department for Transport (2023) TAG Uncertainty Toolkit para 4.9 https://assets.publishing.service.gov.uk/media/65a6bc74867cd8000d5ae9b3/tag-uncertainty-toolkit.pdf
-
National Highways (2022) A12 Chelmsford to A120 Widening Scheme Combined Modelling and Appraisal Report TR010060
-
National Highways (2022) A66 Northern Trans-Pennine Project Combined Modelling and Appraisal Report TR010062
-
Highways England (2019) A27 Arundel Bypass Combined Modelling and Appraisal Report
-
National Highways (2022) Lower Thames Crossing Combined Modelling and Appraisal Report Appendix D Economic Appraisal Package Economic Appraisal Report TR010032/APP/7.7
-
Dargay J and Gately D (1999) Income’s effect on car ownership, world-wide: 1960-2015, Transportation Research (A) Policy and Practice, 33 (2) 101-138
-
A model of this sort was commissioned by the Department of the Environment, Transport and the Regions: Development of an Aggregated Transport Forecasting Model, by Dargay J, Goodwin P and Hanly M, UCL, September 2002.
Professor Phil Goodwin is Emeritus Professor of Transport Policy, University College London and University of the West of England. He was head of the Transport Studies Unit at Oxford University for 16 years, before moving to UCL in 1996.
You are currently viewing this page as TAPAS Taster user.
To read and make comments on this article you need to register for free as TAPAS Select user and log in.
Log in